Category: CRE Acquisitions

  • GatherGov Review: Local Government Meeting Intelligence for CRE Investors

    BestCRE 9AI Score

    70/100 · Contender

    GatherGov ranks #76 of 100 commercial real estate AI tools scored on the 9AI Framework. Nine dimensions, each scored out of 10: CRE relevance, data quality, ease of adoption, output accuracy, integration fit, pricing transparency, support, innovation and market reputation.

    Local government meetings are where the most consequential decisions about commercial real estate development, zoning, and policy are made, yet the vast majority of CRE professionals have no systematic way to monitor them. The International City/County Management Association reported that there are over 90,000 local government entities in the United States, each conducting regular meetings that produce decisions affecting land use, development approvals, tax incentives, and regulatory policy. CBRE’s 2025 development advisory estimated that monitoring relevant government meetings across a single state requires tracking hundreds of jurisdictions, each with distinct schedules, agenda formats, and meeting structures. JLL’s policy risk analysis found that 68 percent of institutional CRE investors identified local government policy changes as an undermonitored risk factor, while the Urban Land Institute noted that municipalities adopting new zoning codes, inclusionary housing mandates, or development moratoria rarely give the market advance warning through traditional CRE data channels.

    GatherGov is a platform that indexes every local government meeting in the United States, converting audio recordings and meeting documents into searchable transcripts, structured analytics, and real time alerts for commercial real estate professionals and institutional investors. The platform covers planning commissions, city councils, zoning boards, and county commissions nationwide, providing audio clips, full transcripts, and analytical summaries that help users track development entitlements, monitor policy changes, assess community and political sentiment, and identify active developers and consultants within specific municipalities. GatherGov also serves institutional finance clients through bespoke reports and datasets, leveraging proprietary knowledge graphs, causal models, and geo semantic indexing to deliver intelligence for hedge funds, bond desks, and asset managers.

    GatherGov earns a 9AI Score of 70 out of 100, reflecting exceptional CRE relevance, strong innovation in government intelligence analytics, and a sophisticated data infrastructure. The score is balanced by limited pricing transparency, moderate integration depth with CRE operational systems, and a market presence that is still building beyond its institutional finance client base. The platform represents one of the most ambitious approaches to extracting actionable intelligence from the vast, fragmented landscape of local government proceedings.

    This review is part of BestCRE’s systematic coverage of commercial real estate AI tools across 20 CRE sectors. For the full AI tools directory, see our Best CRE AI Tools hub.

    What GatherGov Does and How It Works

    GatherGov operates by systematically capturing, transcribing, and analyzing local government meetings across the United States. The platform ingests meeting audio, video, agendas, and minutes from thousands of jurisdictions, using AI to convert these unstructured proceedings into searchable, structured data. Users can search across meetings by keyword, geography, topic, or date range, accessing full transcripts, audio clips of specific discussion segments, and analytical summaries that highlight the most relevant CRE content within each meeting.

    The alert system is designed for professionals who need to monitor specific topics or geographies without manually watching meeting recordings. Users can build personal watchlists by asset type, geographic area, or event class, receiving SMS notifications when relevant topics appear in government proceedings. The platform describes these alerts as high signal, low noise, meaning the AI filters out routine government business and surfaces only the items most likely to affect real estate values, development timelines, or policy environments. For a developer tracking a specific project through the entitlement process, the alert system can provide updates each time the project appears on a meeting agenda or is discussed by commissioners.

    Beyond basic meeting search, GatherGov provides advanced analytics that distinguish it from simpler transcript platforms. The system tracks council member sentiment on development issues, identifies patterns in how specific jurisdictions handle rezoning requests, and maps the relationships between developers, consultants, general contractors, and municipal decision makers. These analytical capabilities are powered by proprietary knowledge graphs and causal models that connect discrete meeting events into broader narratives about how specific markets are evolving from a regulatory and political perspective.

    The institutional finance offering adds another layer of capability. GatherGov’s quantitative team builds bespoke reports and datasets for hedge funds, municipal bond desks, and asset managers who need to understand how local government decisions affect property values, tax revenues, and credit risk. This client base validates the platform’s analytical depth, as institutional finance clients typically demand rigorous methodology and defensible data. The platform’s geo semantic index allows these clients to analyze patterns across thousands of jurisdictions simultaneously, identifying trends in municipal behavior that would be invisible through manual monitoring of individual meetings.

    9AI Framework: Dimension by Dimension Analysis

    CRE Relevance: 9/10

    GatherGov directly addresses one of the most significant information gaps in commercial real estate: visibility into local government decisions that affect property values, development feasibility, and market dynamics. The platform’s focus on planning commission hearings, city council votes, and zoning board decisions maps directly to the regulatory process that governs every CRE development project. The ability to track entitlements, monitor policy changes, assess political sentiment, and identify active market participants through government proceedings provides intelligence that is not available from any traditional CRE data platform. The institutional finance client base further validates the CRE relevance by demonstrating that the data drives decisions at the highest levels of real estate investment and credit analysis. In practice: GatherGov occupies a unique position in the CRE data landscape by providing the only comprehensive, nationwide view of the local government decisions that shape real estate markets.

    Data Quality and Sources: 8/10

    GatherGov’s data is sourced from official government proceedings, which provides inherent credibility because the content represents the actual deliberations and decisions of public officials on the record. The AI transcription and analysis layer converts audio and documents into structured data, which introduces the possibility of transcription errors or analytical misinterpretations but is validated against the source material. The platform’s national coverage across thousands of jurisdictions represents an enormous data collection effort that creates a unique asset in the CRE intelligence landscape. The knowledge graph and causal model infrastructure suggest sophisticated data engineering that goes beyond simple transcription to create relational intelligence connecting decisions, participants, and outcomes. The primary data quality limitations are potential transcription inaccuracies in meetings with poor audio quality and the inherent complexity of interpreting nuanced political discussions through AI analysis. In practice: the combination of official government sources, national coverage, and advanced analytics infrastructure produces a data asset of genuinely high quality for its intended purpose.

    Ease of Adoption: 7/10

    GatherGov provides a web based search interface and SMS alert system that allows users to begin monitoring government meetings relatively quickly. The watchlist feature enables users to configure their monitoring preferences without requiring deep technical setup. The search interface supports keyword, geographic, and topic based queries that are intuitive for CRE professionals who understand development and zoning terminology. However, extracting maximum value from the platform requires understanding how local government processes work and being able to interpret the significance of specific decisions within their jurisdictional context. The advanced analytics and bespoke reporting capabilities are designed for institutional clients who likely receive onboarding support and dedicated account management. For individual CRE professionals, the alert and search features are accessible, but the analytical depth may require time to learn effectively. In practice: the basic monitoring and alert features are easy to adopt, while the advanced analytics require more investment in understanding the platform’s capabilities and interpreting its outputs.

    Output Accuracy: 7/10

    GatherGov’s output accuracy depends on the quality of its AI transcription, the accuracy of its analytical categorization, and the reliability of its sentiment and relationship mapping. Transcription accuracy for government meetings can be challenging due to varying audio quality, multiple speakers, technical jargon, and cross talk during public comment periods. The analytical layer must correctly identify real estate relevant content within meetings that cover many other topics, categorize the type and significance of decisions, and assess the sentiment of officials toward specific proposals. The platform’s institutional finance clients likely provide ongoing feedback that helps refine accuracy, and the bespoke reporting service implies human oversight of the most critical analytical outputs. Published accuracy metrics or error rates are not available, which is common for platforms of this nature. In practice: the outputs are credible for monitoring and alerting purposes, but users making significant investment or development decisions should verify critical findings against the original meeting recordings or minutes.

    Integration and Workflow Fit: 5/10

    GatherGov’s primary delivery mechanisms are its web search interface, SMS alerts, and bespoke reports for institutional clients. Direct integrations with CRE operational platforms like CoStar, Yardi, Argus, or deal management tools are not prominently documented. The platform functions as an intelligence layer that informs decision making rather than as an operational tool that connects to existing CRE workflows. For institutional clients receiving bespoke datasets, the data can presumably be delivered in formats suitable for integration into proprietary analytical systems. For individual users, the information gathered from GatherGov must be manually incorporated into their decision making process. The SMS alert system provides a lightweight integration point by pushing relevant information to users without requiring them to actively search the platform. In practice: GatherGov is best used as a standalone intelligence platform that informs decisions made within other CRE systems rather than as an integrated component of an operational tech stack.

    Pricing Transparency: 4/10

    GatherGov uses a subscription model with limited publicly available pricing information. The platform serves both individual CRE professionals and institutional finance clients, which likely means multiple pricing tiers with significant variation based on scope of access, geographic coverage, and service level. The bespoke reporting service for hedge funds and asset managers implies premium pricing that is negotiated on a per engagement basis. For individual CRE professionals evaluating the platform, the absence of published pricing creates friction in the evaluation process. The platform’s positioning toward institutional clients suggests that pricing may be oriented toward enterprise budgets rather than individual practitioner subscriptions. In practice: prospective users should expect to engage with the sales team for pricing information, and individual CRE professionals should confirm that subscription options exist at price points appropriate for their use case.

    Support and Reliability: 7/10

    GatherGov’s support model appears to include dedicated service for institutional clients, with a quantitative team that builds bespoke reports and maintains ongoing analytical relationships. This level of service suggests strong support capacity for the platform’s premium client base. For individual CRE subscribers, the support structure is less clearly defined but the platform’s focus on high value intelligence suggests an organization that takes data quality and client satisfaction seriously. The reliability of the platform depends on the consistency of its meeting ingestion pipeline and the timeliness of its transcription and analysis processing. National coverage across thousands of jurisdictions creates operational complexity that requires robust infrastructure. Government meetings follow irregular schedules and use diverse formats, which means data availability may vary by jurisdiction. In practice: institutional clients likely receive responsive, relationship driven support, while individual subscribers should evaluate the platform’s support responsiveness during a trial or pilot period.

    Innovation and Roadmap: 9/10

    GatherGov demonstrates exceptional innovation across multiple dimensions. The ambition of indexing every local government meeting in the United States represents a massive data collection and processing challenge that the platform has addressed through sophisticated AI infrastructure. The knowledge graphs, causal models, and geo semantic indexing go far beyond simple transcription to create relational intelligence that reveals patterns in municipal behavior, stakeholder networks, and policy trends. The sentiment analysis of council members on development issues provides a unique analytical dimension that no traditional CRE data platform offers. The institutional finance offering demonstrates that the platform’s analytical capabilities are rigorous enough to serve the most demanding data consumers in the financial industry. The platform’s manifesto at gathergov.ai suggests a mission driven approach to making government proceedings more accessible and analytically useful. In practice: GatherGov represents one of the most technically ambitious and analytically sophisticated approaches to local government intelligence in the CRE technology landscape.

    Market Reputation: 7/10

    GatherGov has built credibility by serving institutional finance clients including hedge funds and municipal bond desks, which represents validation from some of the most analytically demanding users in the market. The platform’s national coverage and sophisticated analytical infrastructure suggest a well resourced organization with serious technical capabilities. However, the company’s public profile within the broader CRE community is still developing, with limited independent reviews, case studies, or mainstream industry media coverage compared with established CRE data providers. The institutional finance focus means that GatherGov’s reputation is strongest among sophisticated data consumers rather than among the broader CRE practitioner community. As the platform expands its CRE specific marketing and client base, its market reputation within the development and investment community should strengthen. In practice: GatherGov is well regarded among the institutional clients who use it, but its reputation within the broader CRE community is still emerging.

    9AI Score Card GatherGov
    70
    70 / 100
    Solid Platform
    Government Meeting Intelligence
    GatherGov
    AI platform indexing every U.S. local government meeting to deliver transcripts, alerts, and analytics on zoning, development, and policy decisions for CRE investors.
    9 Dimensions, Scored 1 to 10
    1. CRE Relevance
    9/10
    2. Data Quality & Sources
    8/10
    3. Ease of Adoption
    7/10
    4. Output Accuracy
    7/10
    5. Integration & Workflow Fit
    5/10
    6. Pricing Transparency
    4/10
    7. Support & Reliability
    7/10
    8. Innovation & Roadmap
    9/10
    9. Market Reputation
    7/10
    BestCRE.com, 9AI Framework v2 Reviewed April 2026

    Who Should Use GatherGov

    GatherGov is ideal for institutional CRE investors, developers, and advisory firms that need systematic visibility into local government decisions affecting their target markets. Development teams tracking specific projects through the entitlement process benefit from real time alerts when their project or related topics appear in government meetings. Portfolio managers monitoring regulatory and policy risk across multiple markets can use the platform to track zoning changes, development moratoria, tax increment financing decisions, and other policy actions that affect asset values. Hedge funds and municipal bond analysts who need to understand how local government behavior affects property markets and municipal credit quality are among the platform’s institutional finance clients. Land investors who need to understand which jurisdictions are politically receptive to new development and which are imposing restrictions will find GatherGov’s sentiment and pattern analysis capabilities particularly valuable.

    Who Should Not Use GatherGov

    GatherGov is not designed for CRE professionals whose primary needs are property level data, transaction comparables, or financial modeling tools. The platform provides government intelligence rather than market analytics in the traditional sense. Teams focused on property operations, tenant management, or lease administration will not find relevant features. Individual brokers who operate in a single market and already attend local government meetings may not gain sufficient incremental value to justify a subscription. Organizations with limited budgets that need a basic CRE data platform should prioritize tools like CoStar or REIS before adding government intelligence as a supplementary data layer. If your CRE workflow does not involve development, land investment, or regulatory risk assessment, GatherGov’s intelligence may not be actionable for your specific needs.

    Pricing and ROI Analysis

    GatherGov uses a subscription model with bespoke pricing for institutional clients. Specific rate information is not publicly available, and the institutional finance offering likely commands premium pricing consistent with hedge fund and asset manager data budgets. The ROI case depends on the value of regulatory intelligence in the user’s decision making process. For a developer evaluating a $30 million multifamily project, understanding council member sentiment toward residential density in the target jurisdiction could prevent a costly entitlement denial. For a portfolio manager tracking policy risk across 50 markets, early warning of regulatory changes that affect property values can inform timely disposition or hedging decisions. The bespoke reporting service provides additional ROI for institutional clients who need custom analytical products that are not available through standard data platforms.

    Integration and CRE Tech Stack Fit

    GatherGov delivers intelligence through its web platform, SMS alerts, and bespoke reports for institutional clients. The platform does not offer documented integrations with standard CRE operational software. Institutional clients receiving bespoke datasets can presumably incorporate GatherGov data into proprietary analytical systems, but this requires custom data engineering. The SMS alert system provides a lightweight delivery mechanism that does not require platform integration. For firms that want to combine government meeting intelligence with property level data, market analytics, or deal management workflows, the connection between GatherGov and other CRE systems must be managed manually or through custom development.

    Competitive Landscape

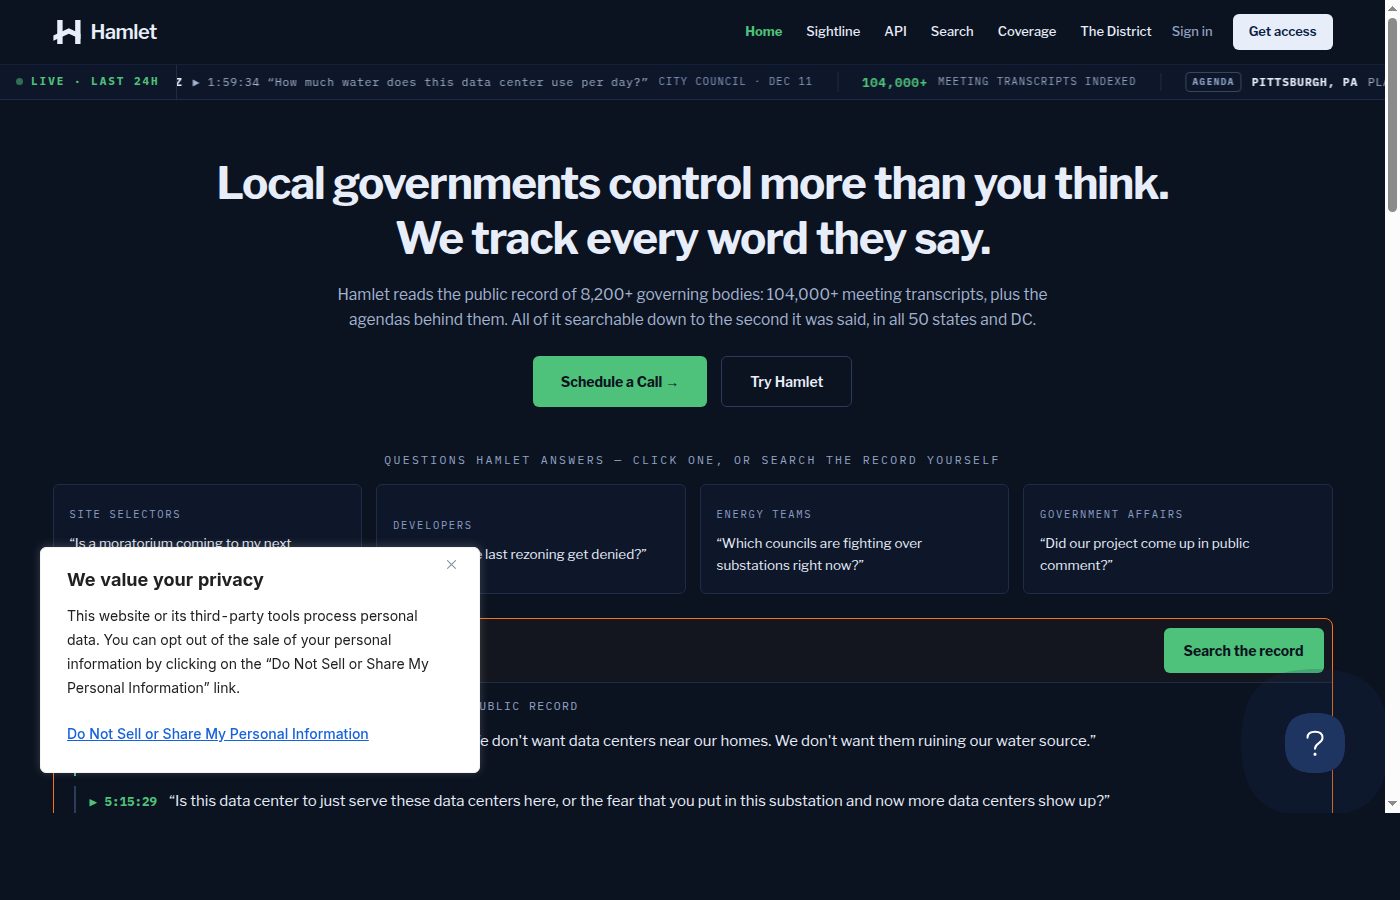
    GatherGov competes with ReZone (now part of Shovels), which focuses on structured zoning decision records across major markets, and LandScout AI, which scans county meeting minutes for development indicators. Hamlet offers a similar government meeting search capability with a civic engagement focus. Traditional CRE data platforms like CoStar and REIS do not provide comparable government meeting intelligence. GatherGov differentiates through its national coverage ambition, its advanced analytics (knowledge graphs, causal models, sentiment analysis), and its institutional finance client base. The platform’s analytical sophistication, particularly the bespoke reporting capability for hedge funds and bond desks, positions it at a higher tier than competitors focused primarily on searchable transcripts. The competitive landscape for government intelligence in CRE is still emerging, and GatherGov’s early mover position and analytical depth provide meaningful advantages.

    The Bottom Line

    GatherGov is an ambitious and analytically sophisticated platform that converts the vast, fragmented landscape of local government meetings into structured intelligence for CRE investors and developers. The 9AI Score of 70 reflects exceptional CRE relevance, strong innovation in government analytics, and institutional credibility demonstrated by its hedge fund and bond desk client base. The score is balanced by limited pricing transparency, moderate integration capabilities, and a market presence still developing within the broader CRE community. For institutional investors, developers, and policy risk managers who need systematic visibility into local government decisions, GatherGov provides intelligence that is genuinely unique in the CRE data landscape. The platform’s national coverage and analytical depth make it a compelling addition to the intelligence stack for firms that operate across multiple markets and care about the regulatory and political dimensions of real estate investment.

    About BestCRE

    BestCRE.com is the definitive authority on commercial real estate AI, analysis, and investment intelligence. Every article advances the platform’s mission to help CRE professionals identify, evaluate, and adopt the best tools and strategies in the industry. We benchmark platforms using the 9AI Framework so CRE leaders can compare tools with clear evidence. Explore the category map at 20 CRE sectors for deeper coverage across the CRE stack.

    Frequently Asked Questions

    How does GatherGov differ from simply watching government meetings online?

    Watching government meetings manually is impractical for CRE professionals who need to monitor multiple jurisdictions. A single metropolitan area may have dozens of municipalities, each conducting planning commission, city council, and zoning board meetings on different schedules. GatherGov automates this monitoring by ingesting meetings from thousands of jurisdictions, transcribing the content, and using AI to identify the specific items relevant to real estate development and investment. The platform then delivers this curated intelligence through searchable transcripts and SMS alerts, which means users receive actionable information without spending hours watching meeting recordings. The analytical layer adds value by tracking sentiment trends, identifying participant networks, and connecting discrete decisions into broader market narratives that would be invisible from watching individual meetings.

    What types of government decisions does GatherGov track for CRE investors?

    GatherGov tracks a comprehensive range of government decisions relevant to CRE, including rezoning approvals and denials, special use permits, variance requests, subdivision approvals, planned unit developments, comprehensive plan amendments, development moratorium discussions, tax increment financing decisions, inclusionary housing mandates, building code changes, and infrastructure investment commitments. The platform also captures public comment discussions, council member positions on development issues, and the political dynamics surrounding controversial projects. This breadth of coverage means users can monitor not just specific entitlement decisions but the broader policy environment that shapes development feasibility and investment risk in their target markets. The ICMA reports over 90,000 local government entities in the United States, and GatherGov’s ambition to index all of their proceedings represents a uniquely comprehensive data collection effort.

    Does GatherGov cover all U.S. markets?

    GatherGov aims to index every local government meeting in the United States, which represents a significantly broader coverage ambition than most competing platforms. The practical reality is that coverage depth varies by jurisdiction, as some municipalities provide easily accessible meeting recordings and documents while others have less digital infrastructure. Major metropolitan areas and their constituent municipalities are likely to have the most complete coverage, while smaller rural jurisdictions may have gaps. The platform’s coverage is expanding as its AI processing capabilities scale to handle additional jurisdictions and meeting formats. Users should verify current coverage for their specific target markets, particularly if they operate in smaller or less digitally mature jurisdictions. The national coverage ambition distinguishes GatherGov from competitors that focus on specific metropolitan areas.

    How does the SMS alert system work?

    GatherGov’s SMS alert system allows users to configure watchlists based on asset type, geographic area, or event class. When the platform’s AI identifies relevant content in a government meeting that matches a user’s watchlist criteria, it sends an SMS notification with a summary of the relevant discussion or decision. The platform emphasizes high signal, low noise alerts, meaning the AI filters routine government business and surfaces only items likely to affect real estate values, development timelines, or policy environments. For example, a developer tracking a multifamily project in Charlotte could receive an SMS alert when the project appears on a planning commission agenda, when commissioners discuss density requirements in the project’s submarket, or when competing projects in the area receive entitlement decisions. The alert system provides a passive monitoring capability that keeps users informed without requiring active platform engagement.

    Who are GatherGov’s typical institutional clients?

    GatherGov serves institutional finance clients including hedge funds, municipal bond desks, asset managers, and real estate investment firms through its bespoke reporting and dataset service. These clients typically need to understand how local government behavior affects property values, development pipelines, tax revenues, and municipal credit quality across multiple markets simultaneously. The platform’s quantitative team builds custom analytical products using proprietary knowledge graphs, causal models, and geo semantic indexing that connect government decisions to financial outcomes. This institutional client base validates the platform’s analytical rigor, as hedge funds and bond desks demand defensible methodology and data quality. CRE developers and investment firms represent another significant client segment, using the platform to track entitlements, monitor policy risk, and identify market opportunities through government intelligence rather than traditional market data sources.

    Related Reviews

    Explore the broader tool library at Best CRE AI Tools and the sector map at 20 CRE sectors to compare GatherGov against adjacent platforms.

  • ReZone Review: AI Powered Zoning and Planning Decision Intelligence for CRE

    BestCRE 9AI Score

    70/100 · Contender

    ReZone ranks #79 of 100 commercial real estate AI tools scored on the 9AI Framework. Nine dimensions, each scored out of 10: CRE relevance, data quality, ease of adoption, output accuracy, integration fit, pricing transparency, support, innovation and market reputation.

    Zoning and entitlement decisions are among the most consequential variables in commercial real estate development, yet they remain among the most opaque. The Urban Land Institute’s 2025 Infrastructure Report found that zoning approvals typically precede building permit applications by three to nine months, creating a window of strategic advantage for investors and developers who track these decisions systematically. CBRE’s development advisory team estimated that monitoring rezoning activity across a single metropolitan area requires reviewing an average of 40 to 60 city council, planning commission, and zoning board meetings per month, each producing dozens of decision items. JLL’s 2025 development outlook noted that zoning complexity and entitlement timeline uncertainty were the top two concerns for institutional developers, with 73 percent citing insufficient visibility into local government decision patterns. The National Association of Home Builders reported that zoning and regulatory delays add an average of $93,870 to the cost of a new multifamily development, underscoring the financial impact of information gaps in the entitlement process.

    ReZone (now part of Shovels) is an AI platform that tracks city council, planning board, and zoning commission decisions across major U.S. markets and converts them into structured, searchable intelligence for commercial real estate professionals. The platform monitors government meetings as they occur, identifies real estate related decisions (including rezoning approvals, special use permits, variance grants, and zoning code modifications), and publishes them as structured records with location data, decision type, status, and timeline information. ReZone covers multiple major metropolitan areas including Charlotte, Atlanta, San Francisco, Philadelphia, Nashville, Chicago, Columbus, and Jacksonville, providing development intelligence that is not available through traditional CRE data platforms.

    ReZone earns a 9AI Score of 70 out of 100, reflecting exceptional CRE relevance, a genuinely unique dataset derived from government proceedings, and strong innovation in AI driven regulatory intelligence. The score is balanced by moderate pricing transparency, limited integration depth with enterprise CRE systems, and the transition dynamics associated with its acquisition by Shovels. The platform represents one of the most distinctive data sources in the CRE technology landscape.

    This review is part of BestCRE’s systematic coverage of commercial real estate AI tools across 20 CRE sectors. For the full AI tools directory, see our Best CRE AI Tools hub.

    What ReZone Does and How It Works

    ReZone operates on the thesis that commercial real estate is fundamentally a local business driven by thousands of smaller decisions made every month by city councils, planning commissions, and zoning boards. These decisions, which include rezoning approvals for new development, special use permits, planned unit developments, and zoning text amendments, are leading indicators of future construction activity, market supply changes, and neighborhood transformation. A rezoning approval for a multifamily development in a suburban submarket, for example, signals future permit activity, construction starts, and unit deliveries months or years before those events appear in traditional CRE databases.

    The platform uses AI to monitor government meeting agendas, minutes, and decision records as they are published, extracting real estate relevant items and converting them into structured data records. Each decision record includes the location, decision type (rezoning, special use permit, variance, subdivision), the governing body that made the decision, the outcome (approved, denied, continued, withdrawn), and relevant details about the proposed development or land use change. This structured data is then made available through a web interface that allows users to search, filter, and analyze zoning decisions by geography, decision type, time period, and other dimensions.

    The strategic value of this data is significant for multiple CRE user types. Developers can identify markets where rezoning activity is accelerating, signaling political receptivity to new development. Investors can track entitlement approvals that forecast future supply additions in their target markets. Land brokers can identify parcels that have recently received zoning changes, indicating motivated sellers or development ready sites. Infrastructure companies evaluating site selection for data centers, fiber networks, or utility projects can use zoning decisions to understand where growth is being permitted. The data provides a view of development activity that is three to nine months ahead of traditional construction start or permit data.

    ReZone was acquired by Shovels, a broader building permit and construction data platform, which extends the data pipeline from zoning decisions through permit applications and construction activity. This integration positions the combined platform as a comprehensive development intelligence system that tracks projects from their earliest regulatory signals through completion. The acquisition also provides ReZone’s zoning intelligence with a larger distribution channel and the operational resources of a more mature company. The platform currently covers major metropolitan areas across the United States, with coverage expanding as the AI processing capabilities scale to additional jurisdictions.

    9AI Framework: Dimension by Dimension Analysis

    CRE Relevance: 9/10

    ReZone addresses one of the most specific and consequential information gaps in commercial real estate: visibility into zoning and entitlement decisions before they translate into permits and construction starts. Every data point on the platform is directly relevant to CRE development, investment, and market analysis. The tool does not attempt to serve other industries or use cases, and its entire data pipeline is designed around the regulatory process that governs real estate development. The platform’s coverage of rezoning approvals, special use permits, variances, and zoning text amendments maps directly to the entitlement workflows that developers and land investors navigate daily. In practice: ReZone is one of the most CRE relevant data platforms available, addressing a specific intelligence gap that no traditional CRE data provider adequately covers.

    Data Quality and Sources: 8/10

    ReZone’s data is sourced directly from government proceedings, which provides a high degree of reliability because the underlying information is official public record. The AI processing layer extracts and structures this data from meeting agendas, minutes, and decision records, which introduces some risk of extraction errors but is validated against the source documents. The platform covers multiple major metropolitan areas with structured decision records that include location, decision type, outcome, and timeline data. The primary data quality limitations are geographic coverage (not all U.S. markets are covered) and the potential for lag between when a decision occurs and when it appears on the platform. The data is also inherently limited to decisions that are documented in public proceedings, which means informal staff level discussions or pre application negotiations are not captured. In practice: the data quality is high for its specific domain, with the government source providing inherent credibility, though coverage gaps in smaller markets may limit utility for some users.

    Ease of Adoption: 7/10

    ReZone provides a web based interface that allows users to search and filter zoning decisions by geography, decision type, and time period. The platform offers city specific demo pages for markets like Charlotte, Atlanta, and Chicago, which allows prospective users to evaluate the data before committing to a subscription. The search and filtering interface is relatively intuitive for CRE professionals who understand zoning concepts and decision types. However, extracting maximum value from the platform requires knowledge of how local zoning processes work, what different decision types mean for development timelines, and how to interpret zoning designations across jurisdictions. Users who are already familiar with the entitlement process will find the platform immediately useful. Those who are newer to development or unfamiliar with zoning terminology may need time to develop the contextual knowledge that makes the data actionable. In practice: the platform is accessible for CRE professionals with development experience, but the specialized nature of zoning data means that the learning curve depends heavily on the user’s existing knowledge of regulatory processes.

    Output Accuracy: 7/10

    ReZone’s output accuracy depends on two factors: the accuracy of the AI extraction from government documents and the accuracy of the underlying government records themselves. Government proceedings provide a reliable source because decisions are formally documented and publicly reported. The AI extraction layer must correctly identify real estate relevant items, categorize decision types, extract location data, and record outcomes. For straightforward decisions like rezoning approvals with clear addresses and zoning designations, accuracy is likely high. For more complex items like planned unit developments with multiple conditions or text amendments with broad applicability, the extraction may miss nuances that would be apparent to a human reviewer. The platform’s structured format imposes consistency, which is valuable for analysis but may oversimplify decisions that have conditional approvals or complex stipulations. In practice: the outputs are reliable for identifying what zoning decisions have occurred and where, but users should consult the original government records for decisions that involve complex conditions or nuanced interpretations.

    Integration and Workflow Fit: 6/10

    ReZone provides a web based search interface and, through the Shovels integration, may offer API access for enterprise clients who want to incorporate zoning decision data into their own analytical systems. However, direct integrations with major CRE platforms like CoStar, Yardi, Argus, or deal management tools are not prominently documented. The data is most useful when combined with other CRE datasets, such as property ownership records, permit data, and market analytics, which requires manual correlation or custom data engineering. The Shovels acquisition potentially improves the integration surface by connecting zoning decisions with permit and construction data in a single pipeline. For firms with data science capabilities, the structured nature of ReZone’s output makes it relatively straightforward to integrate into proprietary analytics workflows. In practice: ReZone fits best as a supplementary data source that feeds into a firm’s broader analytical process rather than as an integrated component of an operational CRE tech stack.

    Pricing Transparency: 5/10

    ReZone operates on a paid subscription model, but specific pricing tiers and rate structures are not prominently displayed on the platform’s website. The city specific demo pages provide free access to sample data, which allows prospective users to evaluate the product before engaging in a pricing conversation. The Shovels acquisition may have introduced new pricing structures that combine zoning intelligence with broader permit and construction data access. For institutional users who need comprehensive coverage across multiple markets, pricing is likely negotiated based on geographic scope, user count, and data access level. The availability of demo data provides some pricing transparency in the sense that users can evaluate product quality before committing, but the lack of published pricing creates friction for firms trying to budget for data subscriptions. In practice: prospective users should expect to engage with the sales team for pricing details, but the demo pages provide enough data access to evaluate the product’s relevance before that conversation.

    Support and Reliability: 6/10

    ReZone’s support profile is in transition following its acquisition by Shovels. The combined entity likely provides stronger operational resources and support capacity than ReZone operated independently, but the transition period introduces uncertainty about support structures, SLAs, and the continuity of existing customer relationships. The platform’s reliability depends on the consistency of its AI processing pipeline and the timeliness of data updates from government sources. Government meeting schedules are inherently irregular, which means data availability may vary by jurisdiction and time of year. The web interface appears stable based on the publicly accessible demo pages, but enterprise level reliability guarantees are not publicly documented. In practice: users should confirm current support structures and data update commitments with the Shovels team, particularly if they plan to depend on the data for time sensitive development decisions.

    Innovation and Roadmap: 8/10

    ReZone represents genuine innovation in CRE data by creating a structured intelligence layer from government proceedings that were previously accessible only through manual monitoring of meeting agendas and minutes. The concept of using AI to parse thousands of local government meetings and extract real estate relevant decisions into a searchable database is technically ambitious and commercially valuable. No other CRE data platform provides equivalent coverage of zoning and entitlement decisions at this scale. The Shovels acquisition extends the innovation by connecting zoning intelligence with permit and construction data, creating a comprehensive pipeline from earliest regulatory signal through project completion. This end to end development tracking capability is unique in the market. In practice: ReZone has created a genuinely novel data product that addresses a persistent information gap in CRE, and the Shovels integration extends that innovation into a broader development intelligence platform.

    Market Reputation: 7/10

    ReZone has built meaningful credibility within the CRE development and investment community through its unique data offering and coverage of major metropolitan markets. The platform’s acquisition by Shovels represents market validation from a larger player in the construction and permit data space. Coverage across major markets including Charlotte, Atlanta, San Francisco, Philadelphia, Nashville, Chicago, Columbus, and Jacksonville demonstrates a growing footprint. However, the platform’s user base and public customer references are limited compared with established CRE data providers, and the Shovels transition introduces some uncertainty about the product’s future positioning and branding. The niche nature of zoning intelligence means that ReZone’s reputation is concentrated among development focused CRE professionals rather than the broader industry. In practice: ReZone is well regarded among the CRE professionals who need zoning intelligence, but its market reputation is narrower than that of horizontal CRE data platforms like CoStar or REIS.

    9AI Score Card ReZone
    70
    70 / 100
    Solid Platform
    Zoning and Planning Decision Intelligence
    ReZone
    AI platform converting city council and planning board zoning decisions into structured intelligence for CRE developers and investors across major U.S. markets.
    9 Dimensions, Scored 1 to 10
    1. CRE Relevance
    9/10
    2. Data Quality & Sources
    8/10
    3. Ease of Adoption
    7/10
    4. Output Accuracy
    7/10
    5. Integration & Workflow Fit
    6/10
    6. Pricing Transparency
    5/10
    7. Support & Reliability
    6/10
    8. Innovation & Roadmap
    8/10
    9. Market Reputation
    7/10
    BestCRE.com, 9AI Framework v2 Reviewed April 2026

    Who Should Use ReZone

    ReZone is ideal for CRE developers, land investors, and development focused advisory firms who need early visibility into zoning and entitlement activity across major U.S. markets. Developers evaluating market entry decisions benefit from understanding where local governments are approving new development, which signals both political receptivity and future competition. Land brokers and acquisition teams can use zoning decision data to identify parcels with recently approved entitlements, reducing due diligence timelines. Infrastructure companies making site selection decisions for data centers, distribution facilities, or utility projects gain strategic advantage from understanding zoning trends before they become visible in permit data. Portfolio managers monitoring supply risk in their target markets can track rezoning approvals that forecast future unit or square footage deliveries.

    Who Should Not Use ReZone

    ReZone is not designed for CRE professionals focused on existing property operations, tenant management, or investment analysis of stabilized assets. The platform’s value is concentrated in the development and pre development phases of the CRE lifecycle. Professionals who work primarily in markets not yet covered by the platform will find limited utility. Teams that need property level data, transaction comparables, or market analytics should use platforms like CoStar or REIS, which serve different analytical needs. Organizations that require real time integration with deal management or underwriting platforms will need to build custom data pipelines, as ReZone does not offer direct integrations with those systems.

    Pricing and ROI Analysis

    ReZone operates on a paid subscription model, with pricing details available through the sales team. The ROI case centers on the value of information timing: knowing about a rezoning approval three to nine months before it appears in permit data can inform land acquisition decisions, competitive market analysis, and portfolio supply risk assessment. For a developer evaluating a $20 million land acquisition, early intelligence about nearby zoning approvals that could introduce competitive supply might change the underwriting assumptions and prevent an overvalued purchase. For infrastructure firms evaluating multi million dollar site selection decisions, zoning trend data can identify receptive jurisdictions and reduce the risk of regulatory delays. The financial impact of better zoning intelligence is difficult to quantify precisely but can be substantial for firms making large development or investment commitments.

    Integration and CRE Tech Stack Fit

    ReZone provides a web based search interface and, through the Shovels platform, may offer API access for enterprise data integration. The structured nature of the zoning decision data makes it well suited for incorporation into proprietary analytics databases, GIS mapping tools, and market research platforms. However, direct integrations with CRE operational software are limited. The data is most valuable when combined with other CRE datasets such as property ownership records, permit data from Shovels, and market analytics from platforms like REIS or CoStar. For firms with data engineering capabilities, the integration path is clear. For smaller firms without technical resources, the web interface provides the primary access method.

    Competitive Landscape

    ReZone occupies a unique niche in the CRE data landscape with few direct competitors. GatherGov offers similar government meeting monitoring with a focus on real time transcripts and alerts. LandScout AI scans county meeting minutes for development indicators. Traditional CRE data platforms like CoStar and REIS do not provide equivalent zoning decision intelligence at the granularity that ReZone offers. The Shovels integration differentiates ReZone by connecting zoning decisions with downstream permit and construction data, creating a more complete development intelligence pipeline than any competitor currently offers. The platform’s competitive position depends on maintaining geographic coverage expansion and data timeliness as more competitors recognize the value of regulatory intelligence in CRE.

    The Bottom Line

    ReZone is a distinctive CRE intelligence platform that converts the opaque world of local government zoning decisions into structured, actionable data for developers and investors. The 9AI Score of 70 reflects exceptional CRE relevance, genuine data innovation, and strong data quality from government sources, balanced by transition dynamics from the Shovels acquisition and limitations in pricing transparency and enterprise integration. For CRE professionals focused on development, land investment, or supply risk analysis, ReZone provides intelligence that is not available from any other single source. The platform’s unique positioning in the CRE data landscape makes it worth evaluating for any firm that makes decisions influenced by zoning and entitlement activity.

    About BestCRE

    BestCRE.com is the definitive authority on commercial real estate AI, analysis, and investment intelligence. Every article advances the platform’s mission to help CRE professionals identify, evaluate, and adopt the best tools and strategies in the industry. We benchmark platforms using the 9AI Framework so CRE leaders can compare tools with clear evidence. Explore the category map at 20 CRE sectors for deeper coverage across the CRE stack.

    Frequently Asked Questions

    What types of zoning decisions does ReZone track?

    ReZone tracks a comprehensive range of real estate related government decisions, including rezoning approvals, special use permits, variances, planned unit developments, subdivision approvals, and zoning text amendments. Each decision record documents the governing body that made the decision (city council, planning commission, zoning board of appeals), the location, the decision type and outcome (approved, denied, continued, withdrawn), and relevant details about the proposed development or land use change. The platform focuses specifically on decisions that have CRE implications, filtering out non real estate government actions. This focused approach means that users receive a curated feed of development relevant decisions rather than having to parse through the full volume of local government proceedings manually.

    Which U.S. markets does ReZone currently cover?

    ReZone covers multiple major U.S. metropolitan areas including Charlotte, Atlanta, San Francisco, Philadelphia, Nashville, Chicago, Columbus, and Jacksonville, with coverage expanding over time. The platform’s AI processing capabilities allow it to scale to additional jurisdictions as it processes more government meeting formats and decision structures. The coverage depth within each metropolitan area includes city council, planning commission, and zoning board decisions for the primary jurisdiction and may extend to adjacent municipalities depending on the market. Users should verify current coverage for their specific target markets, as geographic expansion is ongoing. The Shovels integration may accelerate coverage expansion by leveraging the broader platform’s existing jurisdiction connections.

    How far in advance do zoning decisions predict development activity?

    Zoning decisions typically precede building permit applications by three to nine months, depending on the jurisdiction and the complexity of the proposed development. A rezoning approval for a multifamily project signals that the developer has cleared the most uncertain regulatory hurdle and is likely to proceed with architectural plans and permit applications. However, the timeline between zoning approval and construction start can vary significantly based on market conditions, financing availability, and the developer’s readiness to proceed. Some approved projects are delayed or cancelled due to changing economics, while others move quickly from entitlement to permits. The Urban Land Institute’s research indicates that tracking zoning approvals provides a meaningful forward indicator of supply pipeline activity, but users should treat the data as a probability signal rather than a certainty of future construction.

    How does the Shovels acquisition affect ReZone users?

    The Shovels acquisition integrates ReZone’s zoning decision intelligence with Shovels’ broader building permit and construction data platform. For ReZone users, this means potential access to a more comprehensive development intelligence pipeline that tracks projects from their earliest regulatory signals through permit application and construction activity. The combined platform can provide end to end visibility into the development lifecycle, which is more valuable than either dataset alone. Users may experience changes in pricing structures, interface design, and data access methods as the integration progresses. Existing ReZone subscribers should engage with the Shovels team to understand how the transition affects their specific data access and contract terms. The acquisition generally represents a positive development for users, as the larger platform provides more resources for data expansion and product development.

    Can ReZone data be integrated into proprietary analytics systems?

    ReZone’s structured decision data is well suited for integration into proprietary analytics systems, GIS mapping platforms, and market research databases. The data includes geographic coordinates, decision types, and standardized fields that can be mapped to existing data schemas. Through the Shovels platform, API access may be available for enterprise clients who need programmatic data delivery. For firms with data engineering capabilities, incorporating ReZone data into existing analytical workflows is technically straightforward because the structured format requires minimal transformation. The most common integration use cases include mapping zoning decisions onto GIS layers to visualize development activity, combining zoning data with permit and construction data for supply pipeline analysis, and feeding decision records into proprietary market scoring models that evaluate development risk and opportunity by submarket.

    Related Reviews

    Explore the broader tool library at Best CRE AI Tools and the sector map at 20 CRE sectors to compare ReZone against adjacent platforms.

  • REIS Review: Moody’s Analytics CRE Market Intelligence Platform

    BestCRE 9AI Score

    77/100 · Contender

    REIS ranks #59 of 100 commercial real estate AI tools scored on the 9AI Framework. Nine dimensions, each scored out of 10: CRE relevance, data quality, ease of adoption, output accuracy, integration fit, pricing transparency, support, innovation and market reputation.

    Institutional commercial real estate decision making depends on market intelligence that is both granular and forward looking. CBRE’s 2025 Global Investor Intentions Survey found that 89 percent of institutional investors rank market data quality as their top criterion when evaluating new markets, while JLL’s capital markets report indicated that acquisition committees increasingly require submarket level trend data and forecasts before approving investment decisions. The Urban Land Institute’s 2025 Emerging Trends report noted that the proliferation of CRE data sources has made analytical rigor more important than raw data access, with investors seeking platforms that can synthesize property level, submarket, and macroeconomic data into actionable intelligence. CoStar Group reported that the commercial real estate analytics market exceeded $4.8 billion in 2025, reflecting the industry’s growing dependence on data driven decision frameworks that go beyond traditional broker opinions and anecdotal market knowledge.

    REIS, now operating as Moody’s Analytics CRE following Moody’s acquisition, is one of the foundational market intelligence platforms in commercial real estate. The platform provides proprietary trend and forecast data across 10 major CRE sectors, more than 275 U.S. markets, and over 3,000 submarkets. Its database covers more than 8 million properties and includes over 500,000 time series spanning vacancy rates, effective rents, absorption, new construction, capitalization rates, and forward looking forecasts. The platform operates at cre.reis.com and serves institutional investors, lenders, developers, and advisory firms that require defensible, analytically rigorous market data for underwriting, portfolio strategy, and risk assessment.

    REIS earns a 9AI Score of 77 out of 100, reflecting exceptional data quality, deep CRE relevance, and strong institutional reputation backed by the Moody’s brand. The score is balanced by enterprise level pricing opacity, a learning curve associated with the platform’s analytical depth, and a traditional interface that has been slower to adopt modern AI capabilities compared with newer competitors. The result is a heavyweight market intelligence platform that remains essential infrastructure for institutional CRE decision making.

    This review is part of BestCRE’s systematic coverage of commercial real estate AI tools across 20 CRE sectors. For the full AI tools directory, see our Best CRE AI Tools hub.

    What REIS Does and How It Works

    REIS operates as a comprehensive CRE market analytics platform that delivers time series data, market trends, and proprietary forecasts at the property, submarket, and metropolitan level. The platform’s core value proposition is the combination of historical trend data with forward looking forecasts, which allows institutional users to underwrite deals, evaluate markets, and assess risk using a consistent analytical framework. Users can access vacancy rates, asking and effective rents, absorption trends, new supply pipelines, and capitalization rates across apartment, office, retail, industrial, flex/R&D, self storage, senior housing, student housing, affordable housing, and medical office sectors.

    The forecasting engine is a key differentiator. REIS produces econometric forecasts that project market conditions forward, incorporating macroeconomic variables, construction pipeline data, and sector specific demand drivers. These forecasts are used by institutional investors to stress test underwriting assumptions, evaluate hold period performance, and compare target markets against national benchmarks. The methodology has been refined over decades of operation, and the Moody’s acquisition added credit analytics and macroeconomic modeling capabilities that strengthen the forecasting framework.

    The platform also provides comparative market scoring that allows users to rank markets and submarkets across multiple performance dimensions, which is particularly useful for portfolio allocation decisions and market entry analysis. Data can be exported for integration with proprietary underwriting models, and the platform supports API access for enterprise clients who need to feed REIS data into their own analytical systems. The interface provides visualization tools for trend analysis, though the user experience reflects the platform’s institutional orientation rather than the consumer grade design of newer competitors.

    REIS’s data collection methodology combines primary research with statistical modeling. The company maintains a team of analysts who track market conditions, verify data points, and update the database on a regular cycle. The Moody’s acquisition in 2019 integrated REIS’s CRE data capabilities with Moody’s broader economic and credit analytics platform, creating a combined offering that serves the intersection of CRE market intelligence and financial risk assessment. The platform is used by many of the largest institutional investors, lenders, and advisory firms in the United States, and its data is frequently cited in industry research, regulatory filings, and investment committee materials.

    9AI Framework: Dimension by Dimension Analysis

    CRE Relevance: 10/100

    REIS is built exclusively for commercial real estate market analytics, making it one of the most CRE relevant platforms in the entire AI tools landscape. Every feature, data point, and analytical capability is designed for CRE practitioners. The platform covers 10 major property sectors, 275 plus markets, and 3,000 plus submarkets with proprietary data that is not available through any other single source. The forecasting engine is calibrated specifically for CRE market dynamics, incorporating supply pipeline data, absorption trends, and sector specific demand drivers. The Moody’s integration adds macroeconomic context that enhances the CRE analytics with credit and economic risk perspectives. In practice: REIS is foundational CRE infrastructure that directly addresses the market intelligence needs of institutional investors, lenders, and advisory firms without requiring any adaptation or customization for CRE use cases.

    Data Quality and Sources: 9/10

    REIS’s data quality is among the highest in the CRE analytics industry. The platform maintains over 8 million property records and 500,000 plus time series, with data collection supported by a dedicated analyst team and validated through statistical quality controls. The forecasting methodology has been refined over decades, and the Moody’s backing adds institutional credibility to the analytical framework. The data covers historical trends, current conditions, and forward looking projections, providing a complete temporal view that supports both retrospective analysis and forward underwriting. The primary data limitations are geographic (U.S. focused) and temporal (forecast accuracy degrades over longer horizons, as with all econometric models). Some users note that the data update frequency lags behind real time market movements, which can create gaps for teams making time sensitive decisions. In practice: REIS data is widely accepted as institutional grade and is frequently used in investment committee presentations, regulatory filings, and academic research, which is the strongest possible validation of data quality.

    Ease of Adoption: 6/10

    REIS is an enterprise platform with analytical depth that requires meaningful investment in training and workflow integration. New users need to understand the platform’s data taxonomy, navigate sector specific dashboards, and learn how to construct queries that produce the specific market insights they need. The interface is functional but reflects a data centric design philosophy that prioritizes analytical capability over consumer grade user experience. For analysts and research professionals who work with market data daily, the learning curve is manageable and the depth is appreciated. For executives or deal professionals who need quick market snapshots, the platform may feel complex relative to simpler competitors. The Moody’s acquisition has introduced updates to the interface and added capabilities, but the platform’s institutional orientation means it is designed for professional analysts rather than casual users. In practice: teams that invest in REIS training and build the platform into their standard workflows extract significant value, but the initial adoption period requires dedicated effort.

    Output Accuracy: 9/10

    REIS’s output accuracy is validated by decades of institutional use and the analytical rigor that the Moody’s brand demands. The historical data is compiled through primary research and statistical verification, producing a dataset that institutional investors trust for underwriting and risk assessment. The forecasting engine uses econometric models that incorporate macroeconomic variables and CRE specific supply and demand data, producing projections that are generally well regarded within the industry. No forecast model is perfect, and REIS’s projections are subject to the same limitations as all economic forecasting, but the methodology is transparent and the track record is long enough to evaluate performance across multiple market cycles. Users note that the forecasts tend to be conservative, which aligns with the institutional orientation of the platform. In practice: REIS outputs are trusted by investment committees, rating agencies, and regulatory bodies, which represents the highest standard of institutional accuracy validation in CRE analytics.

    Integration and Workflow Fit: 7/10

    REIS provides data export capabilities and API access that allow enterprise clients to integrate market data into proprietary underwriting models, portfolio analytics systems, and reporting platforms. The data can be consumed in Excel, through direct database connections, or via programmatic interfaces, which provides flexibility for firms with diverse technical environments. The Moody’s platform also connects REIS data with broader economic and credit analytics capabilities, creating an integrated analytical environment for firms that subscribe to multiple Moody’s products. However, native integrations with specific CRE software platforms like Yardi, Argus, or deal management tools are limited, meaning that data transfer between REIS and operational systems often requires manual steps or custom data engineering. In practice: REIS integrates well into analytical and research workflows through its data export and API capabilities, but connecting its outputs to operational CRE systems requires additional technical effort.

    Pricing Transparency: 4/10

    REIS uses enterprise pricing with no publicly available tiers, rate cards, or self service subscription options. The platform is sold through direct sales engagement with Moody’s commercial team, and pricing varies based on the number of users, data modules, geographic coverage, and contract terms. This is standard for institutional data platforms, but it creates significant friction for smaller firms and individual professionals who want to evaluate the platform before committing to a sales process. The enterprise pricing model also makes it difficult to compare REIS against competitors on a cost basis without engaging in parallel procurement conversations. For large institutional investors and lenders, the procurement process is expected and manageable. For mid market firms and boutique advisory shops, the opacity and likely high cost of the platform may be a barrier. In practice: pricing is accessible only through direct engagement with Moody’s sales team, which limits the platform’s addressable market to firms willing to invest in an enterprise data relationship.

    Support and Reliability: 8/10

    As a Moody’s product, REIS benefits from enterprise grade support infrastructure, dedicated account management, and the operational reliability that a major financial services company provides. Subscribers typically have access to analyst support for data interpretation questions, technical support for platform issues, and account managers who can facilitate custom data requests. The platform’s uptime and data delivery reliability are consistent with enterprise SLA expectations. Moody’s reputation in financial services means that the support organization is structured to serve demanding institutional clients who depend on data availability for time sensitive decisions. The depth of analyst expertise available to support clients is a meaningful differentiator, as users can engage with Moody’s research team for market specific questions and analytical guidance. In practice: REIS support reflects the enterprise service standards that institutional clients expect, with dedicated resources and analytical expertise that smaller competitors cannot match.

    Innovation and Roadmap: 7/10

    REIS has been a CRE analytics innovator since its founding, pioneering the systematic collection and forecasting of commercial real estate market data. The Moody’s acquisition has accelerated innovation by integrating CRE market intelligence with macroeconomic modeling, credit analytics, and climate risk assessment capabilities. Recent platform updates have introduced enhanced visualization tools, improved data delivery mechanisms, and expanded sector coverage. However, the pace of AI specific innovation has been moderate compared with newer competitors that are building AI native platforms from the ground up. REIS’s analytical engine relies on established econometric methodologies rather than cutting edge machine learning approaches, which provides reliability but may limit the platform’s ability to capture nonlinear market dynamics. The Moody’s roadmap includes continued integration of AI and machine learning capabilities, but the institutional orientation means that innovation is governed by regulatory and methodological rigor rather than speed. In practice: REIS innovates steadily within its institutional framework, with the Moody’s platform providing resources and direction for continued analytical advancement.

    Market Reputation: 9/10

    REIS has one of the strongest market reputations in CRE analytics, built over decades of serving institutional investors, lenders, and advisory firms. The Moody’s brand adds a layer of financial services credibility that few CRE data providers can match. REIS data is cited in academic research, industry reports, regulatory filings, and investment committee presentations across the industry. The platform serves many of the largest CRE investment firms, banks, insurance companies, and pension funds in the United States. Industry surveys consistently rank REIS among the top CRE data sources alongside CoStar and NCREIF. The reputation is particularly strong in the institutional lending and investment community, where the combination of historical data, forecasts, and Moody’s credit analytics creates a uniquely comprehensive market intelligence offering. In practice: REIS’s market reputation is near the top of the CRE analytics industry, supported by decades of institutional adoption and the credibility of the Moody’s brand.

    9AI Score Card REIS (Moody’s Analytics CRE)
    77
    77 / 100
    Solid Platform
    CRE Market Analytics and Forecasting
    REIS (Moody’s Analytics CRE)
    Institutional grade market intelligence platform delivering trend data, forecasts, and analytics across 275+ U.S. CRE markets and 3,000+ submarkets.
    9 Dimensions, Scored 1 to 10
    1. CRE Relevance
    10/100
    2. Data Quality & Sources
    9/10
    3. Ease of Adoption
    6/10
    4. Output Accuracy
    9/10
    5. Integration & Workflow Fit
    7/10
    6. Pricing Transparency
    4/10
    7. Support & Reliability
    8/10
    8. Innovation & Roadmap
    7/10
    9. Market Reputation
    9/10
    BestCRE.com, 9AI Framework v2 Reviewed April 2026

    Who Should Use REIS

    REIS is essential infrastructure for institutional CRE investors, lenders, developers, and advisory firms that require defensible market data for investment committee presentations, underwriting models, and portfolio strategy. Pension funds, insurance company investment teams, CMBS analysts, and large private equity real estate firms represent the core user base. Research departments at major brokerage firms use REIS as a primary data source for market reports and client advisory. Any organization that needs to answer questions about submarket vacancy trends, rental rate forecasts, supply pipeline analysis, or comparative market performance across 275 plus U.S. markets should evaluate REIS as a foundational data platform. The Moody’s credit analytics integration makes it particularly valuable for lenders who need to connect market conditions with credit risk assessment.

    Who Should Not Use REIS

    REIS is not designed for individual brokers, small property managers, or CRE professionals who need a simple, low cost market data tool. The enterprise pricing model and analytical complexity make it impractical for users who need quick property level searches or basic market snapshots. Firms operating exclusively outside the United States will find limited value, as the platform’s coverage is primarily domestic. Teams that need real time transaction data or property level listing information should look to CoStar, which offers broader property level coverage. Small to mid size firms with limited research budgets may find that the platform’s cost exceeds the value they can extract from its analytical capabilities. If your data needs are primarily property level rather than market and submarket level, REIS may not be the right fit.

    Pricing and ROI Analysis

    REIS uses enterprise pricing with no publicly available rate information. Subscriptions are negotiated through Moody’s commercial team and vary based on the number of users, data modules, geographic coverage, and contract duration. Industry estimates suggest that enterprise subscriptions can range from $25,000 to $100,000 or more annually depending on the scope of access. The ROI case is strongest for firms making large investment decisions where accurate market data directly impacts returns. For an institutional investor underwriting a $50 million acquisition, the marginal value of better vacancy forecasts and rental rate projections can easily justify a six figure data subscription. Lenders who use REIS for credit risk assessment can point to reduced default rates and better loan pricing as ROI drivers. For smaller firms, the ROI calculation is more challenging because the data cost represents a larger percentage of potential deal economics.

    Integration and CRE Tech Stack Fit

    REIS provides API access and data export capabilities that allow enterprise clients to feed market data into proprietary underwriting models, portfolio analytics platforms, and risk management systems. The Moody’s platform also offers integration with other Moody’s products, creating a comprehensive analytical ecosystem for firms that subscribe to multiple data services. Data can be exported in standard formats for use in Excel, Python, R, or other analytical environments. Direct integrations with operational CRE software like Yardi, Argus, or specific deal management platforms are limited, meaning that connecting REIS outputs to operational workflows typically requires custom data engineering. For firms with dedicated data science or analytics teams, the integration surface is flexible and well documented. For smaller teams without technical resources, data integration may require more manual effort.

    Competitive Landscape

    REIS competes primarily with CoStar’s market analytics offerings, Green Street Advisors, and NCREIF for institutional CRE market intelligence. CoStar offers broader property level coverage and listing data but positions its market analytics as part of a larger platform. Green Street provides independent research and advisory with a focus on REIT and institutional property analysis. NCREIF offers performance benchmarking data from institutional portfolios. REIS differentiates through its depth of submarket level data, its proprietary forecasting engine, and the credibility of the Moody’s brand in financial services. The Moody’s integration also uniquely positions REIS at the intersection of CRE market intelligence and credit analytics, which is particularly valuable for lenders and investors who need to connect property market conditions with financial risk assessment. No single competitor offers the same combination of granular CRE data, economic forecasting, and credit analytics integration.

    The Bottom Line

    REIS is a foundational market intelligence platform for institutional CRE decision making. The 9AI Score of 77 reflects exceptional data quality, unmatched CRE relevance, and a market reputation built over decades of institutional adoption, balanced by enterprise pricing opacity and a traditional platform experience that could benefit from more AI native features. For institutional investors, lenders, and advisory firms that require defensible, analytically rigorous market data and forecasts, REIS remains essential infrastructure. The Moody’s backing provides both credibility and a pathway for continued analytical innovation. Smaller firms and individual practitioners should evaluate whether the platform’s depth and cost align with their specific data needs and budget constraints before committing to an enterprise subscription.

    About BestCRE

    BestCRE.com is the definitive authority on commercial real estate AI, analysis, and investment intelligence. Every article advances the platform’s mission to help CRE professionals identify, evaluate, and adopt the best tools and strategies in the industry. We benchmark platforms using the 9AI Framework so CRE leaders can compare tools with clear evidence. Explore the category map at 20 CRE sectors for deeper coverage across the CRE stack.

    Frequently Asked Questions

    What is the relationship between REIS and Moody’s Analytics?

    Moody’s Corporation acquired REIS in 2019, integrating its commercial real estate market data and analytics capabilities into the broader Moody’s Analytics platform. The combined offering now operates as Moody’s Analytics CRE, accessible at cre.reis.com. The acquisition brought together REIS’s decades of CRE market intelligence with Moody’s macroeconomic modeling, credit analytics, and financial risk assessment capabilities. For CRE practitioners, this means that REIS data can now be analyzed alongside economic indicators, credit risk metrics, and climate risk assessments within a unified analytical framework. The Moody’s backing also provides enterprise grade infrastructure, support, and continued investment in the platform’s development. The REIS brand continues to be recognized within the CRE community, even as the platform increasingly operates under the Moody’s Analytics umbrella.

    How does REIS compare to CoStar for CRE market analytics?

    REIS and CoStar serve overlapping but distinct segments of the CRE data market. CoStar offers broader property level coverage with detailed listing information, tenant data, and transaction records, supported by over 1,600 dedicated researchers. REIS specializes in submarket level trend data and econometric forecasts, with deeper analytical capabilities for vacancy, rent, absorption, and supply pipeline analysis across 275 plus markets. CoStar is generally the primary choice for brokers and asset managers who need property level information for leasing and transaction decisions. REIS is often preferred by institutional investors, lenders, and researchers who need defensible market forecasts and trend analysis for underwriting and portfolio strategy. Many institutional firms subscribe to both platforms, using CoStar for property level research and REIS for market level analytics and forecasting.

    What CRE property sectors does REIS cover?

    REIS covers 10 major commercial real estate sectors: apartment (multifamily), office, retail, industrial, flex/R&D, self storage, senior housing, student housing, affordable housing, and medical office. For each sector, the platform provides vacancy rates, asking and effective rents, absorption data, new construction pipeline, and capitalization rate information at the metropolitan and submarket levels. The depth of coverage varies by sector and market, with the largest markets typically having the most granular submarket data. The forecasting engine produces forward looking projections for each sector, incorporating sector specific demand drivers, construction activity, and macroeconomic variables. This multi sector coverage allows portfolio managers and institutional investors to compare performance and risk across asset classes within a single analytical framework.

    How accurate are REIS market forecasts?

    REIS market forecasts use econometric models that incorporate macroeconomic variables, construction pipeline data, employment trends, and sector specific demand drivers. The forecasting methodology has been refined over decades of operation, and the Moody’s acquisition added macroeconomic modeling capabilities that strengthen the analytical framework. Like all economic forecasting, REIS projections are estimates that become less precise over longer time horizons and are subject to unexpected market disruptions. The platform’s forecasts are generally considered conservative and methodologically rigorous, which aligns with the institutional orientation of its user base. Investment committees, rating agencies, and regulatory bodies regularly use REIS forecasts as inputs for decision making, which represents a high standard of market acceptance for forecast accuracy. Users should treat the forecasts as informed estimates that are useful for scenario analysis rather than precise predictions.

    Is REIS suitable for small or mid size CRE firms?

    REIS is primarily designed and priced for institutional users, which means small and mid size firms need to carefully evaluate whether the platform’s depth and cost align with their needs. The enterprise pricing model typically requires annual subscriptions that can range from $25,000 to $100,000 or more, which may be difficult to justify for firms with smaller deal volumes or narrower geographic focus. However, firms that compete for institutional mandates, provide advisory services to large clients, or underwrite deals that require defensible market data may find REIS essential regardless of firm size. Some mid size firms access REIS data through client relationships or industry memberships rather than direct subscriptions. Moody’s may also offer scaled pricing options for smaller firms, though these are negotiated on a case by case basis. For firms that need market level data but cannot justify the REIS price point, alternatives like CoStar’s market analytics or free sources like Census and BLS data may provide sufficient coverage.

    Related Reviews

    Explore the broader tool library at Best CRE AI Tools and the sector map at 20 CRE sectors to compare REIS against adjacent platforms.

  • Advance Auto Parts NNN Lease Investment Profile & Credit Analysis

    Executive Summary

    Advance Auto Parts, Inc. operates approximately 4,000 retail automotive aftermarket locations across North America, making it one of the largest suppliers of automotive parts, accessories, and maintenance products. As a specialist automotive retailer serving both professional mechanics and do-it-yourself consumers, Advance Auto Parts represents a below-investment-grade tenant with defensive characteristics. The company’s essential automotive aftermarket positioning and substantial market presence provide moderate lease stability despite current credit challenges.

    Company Overview & Business Model

    Advance Auto Parts operates approximately 4,000 store locations across the United States and Canada, serving automotive professionals, small business operators, and do-it-yourself consumers. The company generated annual revenue exceeding $5 billion, making it one of the largest automotive aftermarket retailers globally. Advance Auto Parts’s market position is supported by extensive product selection, knowledgeable staff, and convenient store locations near customer concentration points.

    The company’s business model generates revenue through three primary channels: over-the-counter sales to professional mechanics (approximately 50% of revenue), do-it-yourself consumer sales (approximately 35% of revenue), and commercial fleet and delivery services (approximately 15% of revenue). This diversified customer base provides multiple revenue streams while reducing dependence on any single customer segment.

    Advance Auto Parts maintains relationships with numerous manufacturers and suppliers, providing exclusive products and preferred pricing arrangements that enhance competitive positioning. The company benefits from network effects where each store location creates awareness and customer acquisition benefits for nearby locations.

    The company operates under significant competitive pressure from national competitors (AutoZone, O’Reilly Auto Parts), online retailers (Amazon, RockAuto), and manufacturer direct sales. Recent strategic challenges have required significant operational restructuring and store consolidation to maintain competitive positioning.

    Credit Analysis & Financial Strength

    Credit Ratings: Advance Auto Parts does not maintain investment-grade credit ratings. The company is rated below investment-grade by major rating agencies, reflecting operational challenges, competitive pressures, and recent profitability deterioration. This below-investment-grade rating reflects heightened credit risk relative to other retail tenants.

    Financial Challenges: Advance Auto Parts has faced significant operating challenges in recent years, including reduced customer traffic, inventory management issues, and competitive pressures from online retailers. The company has undertaken substantial operational restructuring including store closures, cost reduction initiatives, and supply chain optimization.

    Operational Restructuring: Management has implemented strategic initiatives to improve profitability including store rationalization, digital capabilities enhancement, and supply chain modernization. These initiatives reflect management recognition of competitive challenges and commitment to operational improvement.

    Cash Flow Generation: While profitability has been challenged, Advance Auto Parts continues generating positive operating cash flows supporting ongoing operations and capital investments. The company maintains access to credit facilities enabling operational flexibility during the restructuring process.

    NNN Lease Structure & Key Terms

    Lease Classification: Advance Auto Parts store locations typically operate under net lease arrangements where the tenant bears responsibility for property operating expenses including property taxes, insurance, and maintenance. This structure protects landlord cash flow while ensuring store locations remain competitive and well-maintained.

    Lease Duration & Renewals: Advance Auto Parts store leases typically include terms of 5–10 years with renewal options. The shorter lease terms compared to some retail competitors reflect the company’s ongoing store portfolio optimization. This provides landlords with periodic opportunities to re-evaluate lease economics and tenant performance.

    Rental Escalations: Most Advance Auto Parts store leases include annual escalation clauses of 2–3%, tied to inflation indices or fixed percentage increases. These escalations provide periodic income growth while maintaining competitive positioning.

    Location Economics: Advance Auto Parts store locations generate moderate per-square-foot sales economics, typically ranging from $200–$400 per square foot depending on store format and market characteristics. These economics reflect the automotive aftermarket retail segment and the company’s competitive positioning.

    Investment Merits & Competitive Advantages

    Essential Automotive Aftermarket Positioning: Automotive maintenance and repair represents essential consumer and business spending. Vehicle owners must maintain and repair vehicles regardless of economic conditions. This essential positioning creates relatively stable demand for automotive parts and maintenance products.

    Diversified Customer Base: Advance Auto Parts serves professional mechanics, small business operators, and do-it-yourself consumers. This diversified customer base reduces dependence on any single customer segment while providing multiple revenue sources.

    Geographic Footprint: The company’s approximately 4,000 store locations across North America provide extensive customer accessibility. This geographic scale enables efficient distribution and creates network effects supporting market position.

    Store Productivity Diversity: While the company faces competitive challenges, numerous store locations remain highly productive. The company’s ongoing store optimization focuses resources on highest-productivity locations, supporting long-term profitability.

    Omnichannel Development: Management is investing in digital capabilities, online ordering, curbside pickup, and delivery services. These capabilities position the company to compete effectively in evolving consumer preferences while leveraging physical store network.

    Risk Factors & Considerations

    Intense Competitive Pressures: Advance Auto Parts faces substantial competition from AutoZone, O’Reilly Auto Parts, online retailers (Amazon, RockAuto), and manufacturer direct sales. These competitors have stronger financial positions and comparable market presence.

    Below-Investment-Grade Credit Quality: The company’s credit challenges reflect fundamental competitive and operational pressures. Below-investment-grade ratings indicate elevated default risk relative to investment-grade tenants.

    Store Rationalization Risk: The company’s ongoing store optimization process involves continued closures of underperforming locations. Landlords face potential lease non-renewal risk at stores selected for closure, though the company typically provides appropriate lease termination notice.

    Consumer Preference Shifts: Long-term industry trends toward electric vehicle adoption and reduced vehicle ownership among younger consumers could reduce long-term demand for traditional automotive parts and maintenance products.

    Operational Execution Risk: The company’s turnaround strategy requires effective execution of supply chain optimization, digital capability development, and store productivity improvement. Execution shortfalls could further impair financial performance.

    Economic Cycle Sensitivity: While automotive maintenance is relatively essential, severe economic downturns reduce discretionary maintenance and accessory purchases. Economic recessions could reduce sales and profitability.

    Historical Performance & Trends

    Advance Auto Parts has faced significant operational challenges in recent years. The company faced profitability deterioration, store productivity declines, and competitive pressures from larger competitors and online retailers. These challenges prompted major operational restructuring including significant store closures.

    The company’s strategic transformation toward digital capabilities, supply chain modernization, and store optimization demonstrates management awareness of competitive challenges. Implementation of these initiatives appears to be improving operational metrics and positioning the company for improved long-term competitiveness.

    While historical performance has been challenged, the company’s essential market positioning and ongoing operational improvements suggest stabilization is possible. However, below-investment-grade ratings appropriately reflect execution risks and competitive pressures remaining.

    Comparable Tenants & Market Position

    Advance Auto Parts is significantly larger and more diversified than many automotive retailers, competing directly with AutoZone and O’Reilly Auto Parts. While these competitors maintain stronger credit ratings and financial positions, Advance Auto Parts remains one of the largest automotive aftermarket retailers in North America.

    Among below-investment-grade retail tenants, Advance Auto Parts represents a substantial company with essential market positioning and ongoing operational improvements. The company’s diversity, geographic scale, and customer base exceed many smaller retail tenants.

    Advance Auto Parts leases generally command lower cap rates than typical below-investment-grade retail due to the company’s size, market position, and essential service characteristics of automotive aftermarket retail.

    Cap Rate Analysis & Valuation

    Advance Auto Parts store leases typically trade at cap rates ranging from 7.0% to 8.5%, depending on property location, lease term remaining, and specific tenant creditworthiness. Premium locations in high-traffic areas command lower cap rates (7.0–7.5%), while secondary markets command higher cap rates (7.5–8.5%).

    These cap rates reflect the company’s below-investment-grade credit status and the competitive challenges facing automotive aftermarket retail. The elevated cap rates provide returns appropriate for credit risk undertaken relative to investment-grade tenants.

    Current market conditions suggest Advance Auto Parts leases offer value for investors willing to accept below-investment-grade credit risk in exchange for enhanced yield and exposure to the essential automotive aftermarket retail segment.

    Investment Conclusion

    Advance Auto Parts NNN store leases represent a below-investment-grade investment opportunity for yield-focused investors willing to accept credit and operational risk in exchange for enhanced returns and exposure to the essential automotive aftermarket retail segment. The company’s market scale, geographic footprint, and customer diversity provide moderate defensibility despite current credit challenges.

    The company’s ongoing operational restructuring and strategic initiatives toward digital capability development and supply chain modernization suggest management commitment to competitive positioning improvement. While execution risks remain, the company’s essential market positioning provides baseline demand stability that supports ongoing store operations.

    Investors should recognize that below-investment-grade ratings appropriately reflect execution risks, competitive pressures, and credit challenges. However, for yield-focused investors with appropriate credit risk tolerance, Advance Auto Parts leases offer compelling risk-adjusted returns given the company’s market position and essential service characteristics. Landlords should ensure appropriate lease structures, security deposits, and renewal provisions reflecting credit status.

    Key Investment Metrics

    Metric Value
    Company Advance Auto Parts, Inc.
    Sector Retail – Automotive Aftermarket
    S&P Rating Below Investment Grade
    Moody’s Rating Below Investment Grade
    Investment Grade No
    Store Count ~4,000
    Annual Revenue $5+ Billion
    Typical Lease Term 5–10 Years
    Typical Cap Rate Range 7.0%–8.5%
    Annual Escalations 2–3%
    Lease Type Net Lease (NNN)
    Credit Status Below Investment Grade (Higher Risk)
  • Best Buy NNN Lease Investment Profile & Credit Analysis

    Executive Summary

    Best Buy Company, Inc. is the largest consumer electronics and appliances retailer in North America, operating approximately 1,000 store locations. As the dominant player in its category, Best Buy represents a solid investment-grade tenant providing stable, predictable lease cash flows. The company’s market leadership position, essential service characteristics, and demonstrated operational resilience make NNN leases a compelling opportunity for investors seeking consumer discretionary exposure with institutional credit quality.

    Company Overview & Business Model

    Best Buy operates approximately 1,000 store locations across North America, primarily in the United States and Canada. The company generated annual revenue exceeding $55 billion, making it the dominant retailer in consumer electronics, appliances, and consumer technology. Best Buy’s market position is reinforced by exclusive product availability, knowledgeable staff, and comprehensive product selection that online-only competitors struggle to replicate.

    Best Buy’s business model generates revenue through three primary channels: consumer electronics and appliances sales, service contracts and technical support, and ancillary services including installation and extended warranties. The diversified revenue model provides multiple cash flow streams while the company transitions toward services-centric positioning.

    The company operates under significant competitive pressure from online retailers (Amazon, Newegg) and has adapted by emphasizing in-store experience, expert consultation, and services rather than competing purely on price. This strategic shift toward services and experience has created more defensible competitive positioning and higher-margin revenue streams.

    Best Buy maintains approximately 140,000 employees across North America, providing substantial employment and supporting local communities. The company’s Magnolia and Pacific Sales subsidiary brands serve premium home theater and custom installation markets, providing exposure to higher-income consumers and discretionary spending.

    Credit Analysis & Financial Strength

    Credit Ratings: Best Buy maintains investment-grade ratings from major rating agencies. Standard & Poor’s rates the company at BB+, which represents the highest rating in the speculative-grade category, while Moody’s rates the company at Ba1. These ratings reflect the company’s market leadership position, solid operating margins, and demonstrated capacity to adapt to evolving consumer preferences.

    Financial Scale: With annual revenue exceeding $55 billion, Best Buy maintains significant scale in its operating category. The company generates operating margins of approximately 3–4%, producing annual operating cash flows exceeding $3 billion. These substantial cash flows provide capacity for lease obligations, capital investments, and shareholder returns.

    Balance Sheet: Best Buy maintains conservative balance sheet positioning with manageable leverage ratios. The company has systematically reduced debt levels while returning capital to shareholders through dividends and share repurchases. This financial discipline demonstrates management commitment to balance sheet strength.

    Profitability & Cash Generation: Best Buy has maintained profitability through the transition away from pure consumer electronics retail. The company’s focus on services, extended warranties, and higher-margin categories has stabilized operating margins. Annual net earnings typically exceed $1 billion, providing substantial cushion for lease obligations.

    NNN Lease Structure & Key Terms

    Lease Classification: Best Buy retail locations typically operate under net lease arrangements where the tenant bears responsibility for property operating expenses including property taxes, insurance, and maintenance. This structure protects landlord cash flow while ensuring store locations remain competitive and modern.

    Lease Duration & Renewals: Best Buy store leases typically include terms of 10–20 years with multiple renewal options. The substantial lease duration provides predictable long-term cash flows. Best Buy’s strategy of maintaining locations in high-traffic shopping centers suggests reasonable renewal probability at productive locations.

    Rental Escalations: Most Best Buy store leases include annual escalation clauses of 2–3%, typically tied to inflation indices or percentage rent components. These escalations protect investor purchasing power while maintaining alignment with retailer expectations.

    Location Economics: Best Buy store locations generate strong per-square-foot sales economics, typically exceeding $600–$800 per square foot. These strong sales economics ensure store locations maintain profitability across different markets and economic periods, supporting lease renewal likelihood.

    Investment Merits & Competitive Advantages

    Market Leadership: Best Buy is the dominant consumer electronics retailer in North America with approximately 1,000 stores and unmatched retail presence in this category. This market leadership enables exclusive product availability, purchasing power advantages, and brand recognition that online competitors struggle to replicate.

    Physical Retail Resilience: Despite online competition, Best Buy has demonstrated that physical retail remains valuable for technology and appliances. Consumers desire hands-on product evaluation, expert consultation, and immediate availability that Best Buy’s store format provides. This has enabled Best Buy to maintain market share despite Amazon disruption.

    Services Revenue Growth: Best Buy’s strategic shift toward services (technical support, extended warranties, installation, home theater consulting) creates higher-margin recurring revenue streams. Services revenue has grown as a percentage of total revenue, supporting margin stability and cash flow predictability.

    Digital Integration: Best Buy has invested substantially in omnichannel capabilities enabling online ordering with in-store pickup, curbside delivery, and digital consultation. These capabilities position the company to compete effectively in evolving consumer preferences while leveraging store network advantages.

    Vendor Partnerships: Best Buy’s market leadership enables partnership opportunities with major technology vendors (Apple, Samsung, Microsoft) that generate exclusive in-store experiences and co-marketing support. These partnerships strengthen competitive positioning and customer draw.

    Risk Factors & Considerations

    Amazon & E-Commerce Competition: Amazon’s expansion into physical retail and same-day delivery capabilities represent ongoing competitive threats. Consumer preference for convenience and price competition from online retailers could compress Best Buy margins or reduce store traffic.

    Consumer Discretionary Exposure: Unlike essential services (grocery, banking, pharmacy), consumer electronics purchases are discretionary. Economic downturns reduce consumer spending on technology and appliances, creating earnings volatility. However, the company’s services focus provides some offsetting stability.

    Technology Product Cycles: Best Buy’s business is influenced by consumer technology upgrade cycles. Slower adoption of new categories or extended product replacement cycles could reduce traffic and sales momentum.

    Speculative-Grade Rating: While Best Buy maintains high ratings within the speculative-grade category (BB+/Ba1), the company is technically below investment-grade by traditional definitions. This rating reflects the inherent cyclicality and competitive pressures facing retail electronics retailers.

    Store Productivity Variation: Best Buy’s store portfolio includes both highly productive locations and underperforming stores. Some locations may face closure or non-renewal if demographic shifts or competitive pressures reduce store productivity.

    Historical Performance & Trends

    Best Buy has demonstrated remarkable operational resilience through multiple technological transitions and competitive disruptions. The company survived the shift from physical media (DVDs, CDs) to digital streaming, maintaining relevance despite fundamentally changed product categories.

    During the 2008–2009 financial crisis and the COVID-19 pandemic, Best Buy demonstrated operational flexibility and customer demand resilience. During COVID-19, the company benefited from accelerated digital device purchases and home technology investments while maintaining store operations under enhanced safety protocols.

    The company’s strategic transformation from pure electronics retailer toward services-centric positioning demonstrates management awareness of evolving competitive dynamics. This proactive adaptation suggests continued competitive viability despite ongoing e-commerce disruption.

    Comparable Tenants & Market Position

    Best Buy compares favorably to other major retail tenants within REIT portfolios. While the company’s BB+/Ba1 ratings place it in the speculative-grade category, the company is at the high end of that spectrum with institutional-quality operations and market leadership. Best Buy’s credit quality is significantly stronger than struggling retailers that have filed for bankruptcy.

    Among consumer discretionary retailers, Best Buy represents one of the strongest tenants available, with market leadership, brand value, and demonstrated competitive resilience exceeding most peers. The company’s services evolution provides defensive characteristics unusual for discretionary retailers.

    Best Buy’s location quality and sales productivity exceed many traditional retailers, supporting higher valuation multiples and greater lease payment reliability confidence.

    Cap Rate Analysis & Valuation

    Best Buy store leases typically trade at cap rates ranging from 5.5% to 7.5%, depending on property location, lease term remaining, and market conditions. Premium locations in high-traffic shopping centers command lower cap rates (5.5–6.5%), while secondary market locations command higher cap rates (6.5–7.5%).

    These cap rates reflect Best Buy’s speculative-grade but high-quality credit status and the stability of consumer electronics retail operations. The cap rate range provides attractive income yields appropriate for credit risk undertaken.

    Current market conditions suggest Best Buy leases offer attractive value for investors willing to accept retail operational risk in exchange for above-market yield and exposure to the leading consumer electronics retailer.

    Investment Conclusion

    Best Buy NNN store leases represent an attractive investment opportunity for yield-focused investors willing to accept retail operational risk in exchange for superior credit quality relative to retail peers and exposure to the dominant North American consumer electronics retailer.

    The company’s market leadership position, strategic services transformation, and demonstrated operational resilience through multiple technological disruptions provide confidence in long-term competitive viability. While consumer discretionary exposure creates earnings volatility, Best Buy’s scale and market position provide defensibility exceeding most retail competitors.

    For investors seeking enhanced yield with moderate retail exposure and exposure to quality management and strategic positioning, Best Buy store leases represent a compelling investment. The company’s demonstrated ability to adapt to consumer preference changes and online competition suggests continued operational viability and lease payment reliability.

    Key Investment Metrics

    Metric Value
    Company Best Buy Company, Inc.
    Sector Retail – Consumer Electronics
    S&P Rating BB+
    Moody’s Rating Ba1
    Investment Grade No (High Speculative)
    Store Count ~1,000
    Annual Revenue $55+ Billion
    Operating Margin 3–4%
    Annual Operating Cash Flow $3+ Billion
    Typical Lease Term 10–20 Years
    Typical Cap Rate Range 5.5%–7.5%
    Annual Escalations 2–3%
    Lease Type Net Lease (NNN)
  • Kroger NNN Lease Investment Profile & Credit Analysis

    Executive Summary

    The Kroger Company is the largest supermarket retailer in the United States, operating approximately 2,800 store locations across 35 states. As a pure-play grocery operator, Kroger represents a solid investment-grade tenant providing stable, recession-resistant cash flows. The company’s essential service positioning and market-leading scale make NNN leases a compelling opportunity for conservative investors seeking defensive consumer staple exposure.

    Company Overview & Business Model

    Kroger operates the nation’s largest supermarket chain, employing over 400,000 associates across approximately 2,800 store locations. The company generated annual revenue exceeding $150 billion, making it one of the largest food retailers globally. Kroger’s geographic footprint spans the entire continental United States with particularly strong presence in Midwest and Southeast regions.

    The company operates through diversified banner brands including Kroger, Fred Meyer, Ralphs, Smith’s, and Harris Teeter, enabling market-specific positioning and customer preference accommodation. This diversified banner approach allows Kroger to compete effectively in different regional markets while maintaining operational scale efficiencies.

    Kroger’s business model generates revenue through traditional grocery sales (low single-digit margins of 1–3%) supplemented by high-margin ancillary services including pharmacy, fuel centers, and grocery delivery services. This diversified revenue model provides multiple cash flow streams while the company transitions toward e-commerce and digital capabilities.

    As a publicly traded company with approximately 3.4 billion shares outstanding, Kroger maintains liquid publicly traded equity enabling access to capital markets. The company has substantial scale advantages enabling negotiation power with suppliers, competitive pricing for consumers, and operational efficiency across a national footprint.

    Credit Analysis & Financial Strength

    Credit Ratings: Kroger maintains investment-grade credit ratings from major rating agencies. Standard & Poor’s rates Kroger at BBB, while Moody’s rates the company at Baa1. These solid investment-grade ratings reflect the company’s market leadership position, stable cash flows, and demonstrated financial capacity to manage debt obligations.

    Financial Scale: With annual revenue exceeding $150 billion, Kroger is one of the largest retailers globally. The company’s substantial scale provides negotiation leverage with suppliers, enabling favorable pricing and terms. This scale advantage directly translates to cost competitiveness and financial strength.

    Operating Margins & Cash Flow: Kroger generates operating margins of approximately 3–4% on sales, producing annual operating cash flows exceeding $5 billion. These substantial cash flows provide multiple avenues for lease obligation fulfillment, capital investments, and debt service.

    Debt Management: Kroger maintains debt levels consistent with investment-grade peers. The company’s net debt to EBITDA ratios typically range from 2.0x to 2.5x, which while elevated relative to some peers, remains appropriate for the company’s stable business model and cash generation capacity.

    NNN Lease Structure & Key Terms

    Lease Classification: Kroger supermarket locations typically operate under net lease arrangements where the tenant bears responsibility for property operating expenses including property taxes, insurance, and maintenance. This structure protects landlord cash flows while ensuring store locations remain competitive and well-maintained.

    Lease Duration & Renewals: Kroger supermarket leases typically include terms of 10–20 years with multiple renewal options. The substantial lease duration provides predictable long-term cash flows. Kroger’s market leadership position and strong operating economics suggest high probability of lease renewal at productive locations.

    Rental Escalations: Most Kroger supermarket leases include annual escalation clauses of 2–3%, typically tied to inflation indices or CPI adjustments. These escalations protect investor purchasing power while maintaining competitiveness relative to alternative retail locations.

    Sales Economics: Kroger supermarket locations generate strong per-square-foot sales economics, typically exceeding $600–$700 per square foot annually. These strong sales economics ensure locations maintain profitability and value across different markets and economic periods, supporting lease renewal probability.

    Investment Merits & Competitive Advantages

    Essential Service Positioning: Unlike discretionary retailers, supermarkets provide essential consumer staples (food, beverages, household items) that customers must purchase regardless of economic conditions. This essential positioning creates recession-resistant cash flows that continue through economic downturns.

    Market Leadership: Kroger is the dominant supermarket operator in the United States with approximately 2,800 locations providing unmatched geographic scale. This market leadership enables operational efficiencies, favorable supplier terms, and brand recognition that smaller competitors cannot match.

    Demographic Tailwinds: U.S. population growth and household formation trends support long-term supermarket demand growth. The company’s expansion into growing metropolitan areas positions it to benefit from demographic trends supporting sustained store economics.

    Private Label Growth: Kroger has successfully developed private label brands that generate higher margins than national brands. Growth in private label penetration (currently exceeding 25% of sales) provides margin expansion opportunity and customer loyalty enhancement.

    Digital & E-Commerce Evolution: While facing increased e-commerce competition from Amazon and others, Kroger has invested substantially in digital capabilities, online ordering, and delivery services. These capabilities position the company to compete effectively in evolving consumer preferences.

    Risk Factors & Considerations

    E-Commerce Competition & Amazon Threat: Amazon’s acquisition of Whole Foods and expansion into grocery delivery represents a competitive threat to traditional supermarket models. However, Kroger’s scale, existing store footprint, and brand recognition provide defensibility against pure online competitors.

    Private Label Commoditization: As grocery increasingly transitions toward commodity-like pricing, margin compression represents ongoing risk. However, Kroger’s market leadership and private label focus position the company to compete effectively on price while maintaining reasonable margins.

    Labor Cost Inflation: Supermarket operations are labor-intensive, requiring store associates, checkout personnel, and logistics workers. Wage inflation and unionization pressures could compress margins if pricing power is insufficient to offset wage increases.

    Real Estate Portfolio Optimization: As consumer shopping patterns evolve and e-commerce penetration increases, some underperforming supermarket locations may face closure or non-renewal. However, Kroger’s selective store footprint and market leadership suggest most productive locations will remain open.

    Food Cost Inflation: Supermarket margins are sensitive to food cost inflation. Rising agricultural commodity costs could compress margins if the company cannot pass costs to consumers through price increases.

    Historical Performance & Trends

    Kroger has maintained market leadership and operating viability through multiple economic cycles spanning over a century of operations. The company operated profitably through the 2008–2009 financial crisis and the COVID-19 pandemic, demonstrating resilience of the supermarket model.

    During the COVID-19 pandemic, Kroger benefited from accelerated shift toward at-home food consumption. The company expanded workforce, maintained operations despite disruptions, and continued dividend payments to shareholders. This pandemic resilience demonstrates financial strength and operational reliability.

    The company’s gradual transition toward digital and e-commerce capabilities demonstrates management awareness of evolving consumer preferences. Rather than facing disruption from changing preferences, Kroger is proactively adapting its business model to maintain market relevance.

    Comparable Tenants & Market Position

    Kroger compares favorably to other grocery and consumer staple retailers within REIT portfolios. The company’s BBB/Baa1 credit ratings are consistent with other major grocery operators. Kroger’s market leadership position provides competitive advantages over regional grocery chains with lower market shares and less diversified operations.

    Among consumer staple retailers, Kroger represents one of the largest and most creditworthy options available as an NNN lease tenant. The company’s demonstrated operational resilience and market position compare favorably to smaller regional grocers or specialty retailers.

    The company’s long-term strategic focus on market leadership through store investments, technology deployment, and supply chain optimization demonstrates commitment to maintaining store productivity and lease payment reliability.

    Cap Rate Analysis & Valuation

    Kroger supermarket leases typically trade at cap rates ranging from 5.0% to 7.0%, depending on property location, lease term remaining, and market conditions. Premium locations in dense urban or high-traffic areas command lower cap rates (5.0–6.0%), while secondary market locations command higher cap rates (6.0–7.0%).

    These cap rates reflect Kroger’s solid investment-grade credit quality and the stability of supermarket operations. The cap rate range is appropriate for investment-grade retail tenants, providing attractive income yields relative to other consumer staple retailers.

    Current market conditions suggest Kroger leases remain attractively priced for investors seeking essential service exposure with solid credit quality. The company’s market leadership and demonstrated operational resilience support valuation levels observed in market transactions.

    Where This Tenant Fits in the Broader Investment-Grade Map

    Kroger makes the most sense when investors compare grocery durability against the broader investment-grade tenant universe. The fastest way to frame that comparison is the investment grade commercial real estate guide together with the live investment-grade tenant ratings hub, which shows where grocery credit sits relative to banks, pharmacies, convenience retail, and other rated net lease sectors.

    For a tighter pricing lens, pair Kroger with research on credit spreads, what investment grade actually means, and investment-grade versus high-yield bonds. That broader context helps explain why a BBB grocery tenant can still price materially differently from higher-rated names even when store sales and lease occupancy look stable on the surface.

    Investment Conclusion

    Kroger NNN supermarket leases represent a solid investment opportunity for income-focused investors seeking defensive consumer staple exposure with investment-grade credit quality. The company’s BBB/Baa1 credit ratings, market leadership position, and demonstrated resilience through economic cycles provide assurance of lease income stability.

    The company’s essential service positioning creates recession-resistant cash flows that continue through economic downturns. Supermarket demand remains relatively inelastic to economic cycles, as consumers must continue purchasing food regardless of economic conditions. This essential positioning supports predictable lease payment performance.

    While ongoing e-commerce competition and supermarket industry disruption represent long-term challenges, Kroger’s market scale, strategic positioning, and operational investments position the company to remain competitive and maintain store productivity. For investors prioritizing income stability and defensive consumer staple exposure, Kroger supermarket leases represent a compelling addition to diversified property portfolios.

    Key Investment Metrics

    Metric Value
    Company The Kroger Company
    Sector Retail – Grocery
    S&P Rating BBB
    Moody’s Rating Baa1
    Investment Grade Yes
    Store Count ~2,800
    Annual Revenue $150+ Billion
    Operating Margin 3–4%
    Annual Operating Cash Flow $5+ Billion
    Typical Lease Term 10–20 Years
    Typical Cap Rate Range 5.0%–7.0%
    Annual Escalations 2–3%
    Lease Type Net Lease (NNN)
  • Costco NNN Lease Investment Profile & Credit Analysis

    Executive Summary

    Costco Wholesale Corporation is a membership-based warehouse retailer operating one of the most successful and resilient retail business models in North America. Costco represents one of the premier NNN lease tenants in the REIT sector, combining exceptional credit quality, fortress-like balance sheet strength, and demonstrable resilience through multiple economic cycles. The company’s investment-grade credit profile makes it an ideal tenant for conservative investors seeking stable, predictable returns.

    Company Overview & Business Model

    Costco operates approximately 850 warehouse clubs globally (majority in North America) generating annual revenue exceeding $250 billion. The company’s membership-based model creates a highly stable, recurring revenue stream. Members pay annual membership fees ($60–$130 depending on membership tier), generating substantial predictable cash flows independent of unit sales.

    The company generates revenue through three primary sources: member purchases (low single-digit profit margin of 1–3%), membership fee income (high-margin recurring revenue), and ancillary services (gas stations, pharmacy, tire centers). This diversified revenue model provides multiple cash flow streams and reduces dependence on core merchandise sales.

    Costco’s warehouse format emphasizes operational efficiency and high inventory turnover. The company maintains inventory turns exceeding 10 times annually—significantly higher than traditional retailers. This inventory efficiency generates substantial operational cash flow and minimizes working capital requirements.

    The company’s member-centric culture and employee-focused policies have created exceptional customer and employee loyalty. Employee turnover is substantially below retail industry averages, reducing training costs and operational disruption. This operational excellence directly supports financial performance and lease payment reliability.

    Credit Analysis & Financial Strength

    Credit Ratings: Costco maintains investment-grade ratings across all major rating agencies. Standard & Poor’s rates the company at A, while Moody’s maintains a rating of A1. These ratings reflect the company’s exceptional business model resilience, fortress-like balance sheet, and consistent earnings quality.

    Balance Sheet Strength: Costco maintains a minimal debt profile with net debt to EBITDA ratios typically below 1.0x. The company generates substantial annual free cash flow (typically exceeding $10 billion annually) that provides multiple avenues for debt reduction, dividend growth, or strategic investments. This balance sheet strength creates an exceptional safety margin for lease obligation fulfillment.

    Profitability & Earnings Quality: While merchandise margins are intentionally maintained at low levels (1–3%) to maintain member value, membership fee income and ancillary services generate high-margin revenue. Operating margins exceed 3–4% of sales, demonstrating pricing power and operational leverage. Net earnings exceed $8 billion annually, providing substantial capacity for lease obligations.

    Recession Resilience: Costco demonstrated exceptional resilience during the 2008–2009 financial crisis and the COVID-19 pandemic. During both periods, the company expanded store count and increased capital investment despite economic uncertainty. This counter-cyclical expansion demonstrates management confidence in long-term prospects and exceptional financial flexibility.

    NNN Lease Structure & Key Terms

    Lease Classification: Costco warehouse facilities typically operate under net lease arrangements where the tenant bears responsibility for property operating expenses including property taxes, insurance, and maintenance. This structure protects landlord cash flow while ensuring warehouse locations remain highly maintained and operationally efficient.

    Lease Duration & Renewals: Costco warehouse leases typically include terms of 10–20 years with multiple renewal options. The substantial lease duration provides predictable long-term cash flow. Costco’s strategy of gradually opening new locations suggests high probability of lease renewal at existing high-performing locations.

    Rental Escalations: Most Costco warehouse leases include annual escalation clauses of 2–3%, typically tied to inflation indices. These escalations protect investor purchasing power while maintaining competitive positioning relative to other Costco leases and alternative retail spaces.

    Location Economics: Costco locations generate substantially higher per-square-foot sales than traditional retailers, typically exceeding $1,000 per square foot annually. These strong sales economics ensure Costco locations maintain value across different markets and economic periods, supporting lease renewal likelihood.

    Investment Merits & Competitive Advantages

    Fortress Business Model: The membership-based model creates recurring, predictable revenue streams substantially insulated from discretionary spending fluctuations. Members renew memberships repeatedly over decades, creating high customer lifetime value and exceptional business stability.

    Operational Excellence: Costco is renowned for operational discipline and continuous improvement. The company’s inventory turnover, labor efficiency, and supply chain management are among the best in global retail. This operational excellence directly translates to financial strength and lease payment reliability.

    Consistent Growth: Costco has demonstrated consistent growth through multiple economic cycles, expanding membership rolls and warehouse count even during recessions. Unlike commodity-dependent retailers, Costco’s growth trajectory appears sustainable across economic conditions.

    Brand Loyalty & Switching Costs: Costco members demonstrate exceptional loyalty and willingness to pay for membership privileges. The upfront membership cost creates switching costs that encourage long-term commitment. This loyalty insulates the company from competitive threats and supports consistent store performance.

    Defensive Consumer Staple Characteristics: Despite wholesale classification, Costco operates with characteristics typical of consumer staple companies. Members purchase necessities and household staples at Costco, creating non-discretionary demand patterns similar to grocery stores despite higher price points for membership.

    Risk Factors & Considerations

    E-Commerce & Omnichannel Competition: While Costco has been slower to embrace e-commerce than many retailers, online grocery and warehouse alternatives pose potential long-term competitive threats. However, Costco’s membership model and operational advantages appear to provide defensibility against online-only competitors.

    Mature Market Saturation: In mature markets like Southern California and the Pacific Northwest, Costco warehouse density is substantial. Growth in these markets will necessarily slow as the company reaches saturation. This could ultimately constrain store growth rates in core markets, though international expansion provides substantial opportunity.

    Wage Inflation: Costco’s competitive compensation philosophy (substantially above industry averages) positions the company well for attracting talent but creates exposure to wage inflation. Rising labor costs could pressure margins if membership prices don’t adjust accordingly.

    Economic Sensitivity: While Costco is substantially more recession-resistant than typical retailers, severe economic downturns could reduce membership renewal rates and per-member spending. However, the company’s demonstrated resilience suggests lease payments would remain prioritized even in severe recessions.

    Historical Performance & Trends

    Costco has demonstrated exceptional financial performance across multiple economic cycles spanning three decades of public company operations. The company has never experienced quarterly losses or missed dividend payments, demonstrating uninterrupted financial strength through recessions, financial crises, and competitive disruptions.

    During the 2008–2009 financial crisis, while many retailers filed for bankruptcy or faced severe financial distress, Costco expanded warehouse openings and increased capital investment. This counter-cyclical approach demonstrates management confidence in business resilience and financial capacity to honor lease obligations.

    The COVID-19 pandemic created unprecedented disruption to physical retail, yet Costco thrived. The company expanded warehouse openings, hired tens of thousands of employees, and increased membership growth rates. This pandemic resilience demonstrates the fundamental strength of Costco’s membership model.

    Comparable Tenants & Market Position

    Costco is widely considered among the premier tenants in the REIT sector, often cited alongside financial services titans like JPMorgan Chase and Bank of America as the most creditworthy retail/commercial tenants. Costco’s A/A1 credit ratings place it in the top tier of retail tenants alongside only the strongest specialty retailers and essential service providers.

    Among retail and consumer-oriented tenants, Costco represents an exceptional opportunity to partner with a best-in-class operator. The company’s demonstrated ability to maintain store economics through economic cycles, maintain employee satisfaction, and deliver member value creates a stable foundation for lease obligations.

    The company’s selective real estate footprint (unlike mass-market retailers operating hundreds of locations) means Costco warehouse leases represent premium properties in their respective markets, commanding appropriate economic returns.

    Cap Rate Analysis & Valuation

    Costco warehouse leases typically trade at cap rates ranging from 4.0% to 6.0%, depending on property location, lease term remaining, and market conditions. Premium locations in high-density markets command lower cap rates (4.0–5.0%), while secondary markets command higher cap rates (5.0–6.0%).

    These cap rates reflect Costco’s exceptional credit quality and the predictability of warehouse operations. The cap rate range is consistent with investment-grade office and retail tenants, validating Costco lease valuations relative to comparable investment opportunities.

    Current market conditions suggest Costco leases remain attractively priced for investors seeking best-in-class retail tenants. The company’s demonstrated performance consistency and balance sheet strength support valuation levels observed in market transactions.

    Investment Conclusion

    Costco NNN warehouse leases represent a premier investment opportunity for conservative, income-focused investors seeking exceptional credit quality and business model resilience. The company’s A/A1 credit ratings, fortress-like balance sheet, and demonstrated capacity to thrive through multiple economic cycles provide exceptional assurance of lease income stability.

    The company’s membership-based model creates recurring revenue streams substantially insulated from economic cycles. Members renew memberships repeatedly over decades, creating a stable cash flow foundation that directly supports lease payment reliability. The company’s operational excellence and continuous improvement culture ensure sustained financial strength.

    For conservative investors prioritizing income stability, credit quality, and business model resilience over maximum yield, Costco warehouse leases represent one of the most compelling opportunities in the REIT sector. The company’s institutional quality and demonstrated reliability make it one of the most preferred tenants among sophisticated real estate investors.

    Key Investment Metrics

    Metric Value
    Company Costco Wholesale Corporation
    Sector Retail – Warehouse
    S&P Rating A
    Moody’s Rating A1
    Investment Grade Yes
    Warehouse Count ~850 Global
    Annual Revenue $250+ Billion
    Annual Free Cash Flow $10+ Billion
    Typical Lease Term 10–20 Years
    Typical Cap Rate Range 4.0%–6.0%
    Annual Escalations 2–3%
    Lease Type Net Lease (NNN)
  • Wells Fargo NNN Lease Investment Profile & Credit Analysis

    Executive Summary

    Wells Fargo & Company is a leading diversified financial services company operating banking, investment, and mortgage services across the United States. As a major REIT tenant, Wells Fargo represents a lower-risk opportunity given its systemically important status, strong financial position, and predictable revenue streams. The company’s NNN lease represents a stable, credit-grade investment suitable for conservative portfolios.

    Company Overview & Business Model

    Wells Fargo is one of the largest banks in the United States with a market capitalization exceeding $180 billion. The company operates through three primary segments: Community Banking (retail banking, branch operations, mortgage services), Wholesale Banking (commercial and corporate banking), and Wealth & Investment Management (asset management and brokerage services).

    The company maintains a substantial physical branch network with approximately 4,300 branch locations across the United States. This significant real estate footprint underscores the importance of NNN lease arrangements for Wells Fargo’s operational strategy. Branch locations serve as critical customer touchpoints and generate substantial foot traffic and revenue.

    Wells Fargo’s business model relies on net interest margin (difference between interest earned and interest paid), fee-based services, and commissions. The company benefits from recurring deposits, long-term customer relationships, and regulatory barriers to entry that protect market position.

    Credit Analysis & Financial Strength

    Credit Ratings: Wells Fargo maintains investment-grade credit ratings across all major rating agencies. Standard & Poor’s rates the company at A–, while Moody’s maintains a rating of A1. These ratings reflect the company’s systemically important status within the U.S. financial system, substantial capital reserves, and consistent earnings generation.

    Financial Position: Wells Fargo operates with total assets exceeding $1.9 trillion, making it one of the largest financial institutions globally. The company maintains capital ratios well above regulatory minimums, with Tier 1 common equity ratios exceeding 11%. These substantial capital buffers provide significant cushion against economic downturns and underscore the company’s financial stability.

    Revenue Stability: With annual revenues exceeding $80 billion, Wells Fargo generates predictable revenue streams across its three primary business segments. The diversified revenue model (net interest income, service charges, investment advisory fees) reduces dependence on any single revenue source, providing stability through economic cycles.

    Operating Leverage: Wells Fargo’s scale provides significant operating leverage. The company’s substantial branch network and digital banking capabilities create multiple revenue streams per location. The fixed cost base is spread across an extensive customer base, enabling strong profitability during normal economic periods.

    NNN Lease Structure & Key Terms

    Lease Classification: Wells Fargo branch locations typically operate under net lease arrangements where the tenant bears primary responsibility for property operating expenses including property taxes, insurance, and maintenance. This lease structure protects the landlord’s cash flow while ensuring the branch location remains competitive and well-maintained.

    Lease Duration: Wells Fargo branch leases typically include terms ranging from 10 to 20 years with multiple renewal options. The substantial lease duration provides predictable, long-term cash flow to the property owner while allowing Wells Fargo flexibility to adjust its branch footprint as customer preferences and technology evolve.

    Rental Escalations: Most Wells Fargo branch leases include annual escalation clauses tied to inflation indices (typically 2–3% annual increases). These escalations help ensure that rental income keeps pace with inflation and rising operating costs, providing real return protection to investors.

    Guarantee & Creditworthiness: Wells Fargo’s national credit standing means branch leases are backed by a company with A–/A1 credit ratings. This corporate guarantee provides substantial assurance of lease payment performance, even in challenging economic periods. Wells Fargo’s regulatory capital requirements and stress-testing regimes ensure the company maintains capacity to meet lease obligations.

    Investment Merits & Competitive Advantages

    Systemically Important Institution: Wells Fargo is designated as a systemically important financial institution (SIFI) by financial regulators. This status means the company receives enhanced regulatory oversight and is considered too large and interconnected to fail without systemic consequences. This creates an implicit support mechanism that enhances credit quality.

    Diversified Revenue Streams: Unlike pure retail or hospitality tenants dependent on consumer discretionary spending, Wells Fargo generates revenue from essential financial services (deposit taking, lending, payments). These services are essential to economic function and demonstrate non-discretionary demand patterns.

    Brand Value & Customer Loyalty: Wells Fargo is one of the most recognized financial services brands in the United States with over 150 years of history. The company benefits from strong customer relationships, with many customers maintaining accounts for decades. This customer stickiness supports stable revenue and lease payment reliability.

    Regulatory Capital Requirements: As a heavily regulated financial institution, Wells Fargo must maintain substantial capital buffers and satisfy stress-testing requirements. These regulatory safeguards ensure the company maintains capacity to honor lease obligations even during economic downturns.

    Real Estate as Core Operational Asset: Branch locations represent critical operational infrastructure for Wells Fargo’s business model. Unlike discretionary real estate expansion, branch locations support the company’s core banking operations. This operational imperative provides strong motivation to maintain lease compliance.

    Risk Factors & Considerations

    Digital Banking Shift: Ongoing trends toward digital and mobile banking have reduced customer demand for physical branch locations. Wells Fargo has systematically reduced its branch count as customers shift toward online banking. This trend could potentially impact long-term lease renewal prospects at some locations, particularly in urban areas with high branch density.

    Regulatory Environment: Banks face substantial regulatory oversight and potential regulatory actions. While regulatory safeguards support financial stability, regulatory constraints can limit profitability and flexibility. Changes in banking regulations, capital requirements, or stress-testing methodologies could impact Wells Fargo’s earnings and lease payment capacity.

    Economic Sensitivity: Banking profitability is sensitive to economic cycles and interest rate environments. During severe recessions, loan losses can spike and net interest margins can compress. However, Wells Fargo’s scale and regulatory capital requirements provide substantial buffer against these cyclical risks.

    Reputational Risks: Wells Fargo has faced significant regulatory and reputational challenges in recent years. While the company has implemented remedial measures and enhanced oversight, lingering reputational concerns could impact customer acquisition and retention over time.

    Historical Performance & Trends

    Wells Fargo has demonstrated consistent earnings power across multiple economic cycles. Even during the 2008–2009 financial crisis, while the banking sector faced significant stress, Wells Fargo maintained lease payment performance and did not require government bailout support (unlike some competitors). This demonstrated resilience provides confidence in credit quality.

    The company has maintained dividend payments to shareholders throughout economic cycles, demonstrating commitment to stakeholder distributions and financial stability. The company’s ability to maintain dividends even during challenging periods provides confidence regarding lease payment priority.

    Wells Fargo’s branch network optimization strategy reflects rational capital allocation. Rather than defaulting on leases or abandoning properties, the company has methodically reduced branch count while maintaining presence in high-traffic locations. This measured approach demonstrates operational discipline and commitment to lease obligations.

    Comparable Tenants & Market Position

    Wells Fargo compares favorably to other major financial services tenants within REIT portfolios. The company’s A–/A1 credit ratings are stronger than many retail or hospitality tenants with BBB or lower ratings. Wells Fargo’s branch lease economics (rental yields of 5–7% depending on location quality) compare favorably to other investment-grade tenants.

    Among financial services tenants, Wells Fargo represents one of the largest and most creditworthy options. The company’s systemically important designation and regulatory safety net provide competitive advantages over regional or community banks with lower credit ratings.

    The company’s long-term branch lease strategy demonstrates commitment to real estate ownership through corporate leases, unlike some financial institutions that have shifted toward shorter-term subleases or alternative occupancy arrangements.

    Cap Rate Analysis & Valuation

    Wells Fargo branch leases typically trade at cap rates ranging from 4.5% to 6.5%, depending on property location, lease term remaining, and market conditions. Prime urban locations with high visibility command lower cap rates (4.5–5.5%), while secondary market locations command higher cap rates (5.5–6.5%).

    These cap rates reflect Wells Fargo’s strong credit quality and the predictability of banking operations. The cap rate range is consistent with other investment-grade tenants in the office and retail sectors, validating Wells Fargo lease valuations relative to comparable investment opportunities.

    Current market conditions and interest rate environment suggest Wells Fargo leases remain attractively priced for conservative income investors. The company’s demonstrated lease payment reliability and strong financial position support the valuation levels seen in market transactions.

    Where This Tenant Fits in the Broader Investment-Grade Map

    Wells Fargo is useful to study inside a wider investment-grade framework, not as a standalone branch lease story. Investors comparing top-credit tenants across sectors should start with the broader investment grade commercial real estate guide, then use the live investment-grade tenant ratings hub to compare Wells Fargo with other rated net lease names.

    For a deeper underwriting lens, pair this tenant profile with research on credit spreads, yield to maturity, and investment-grade capital markets. Those pages help explain why an A-range bank tenant can still trade at different cap rates depending on market depth, lease duration, and the spread investors demand over public-credit alternatives.

    Investment Conclusion

    Wells Fargo NNN branch leases represent a compelling investment opportunity for conservative, income-focused investors seeking below-market risk profiles. The company’s A–/A1 credit ratings, systemically important designation, and demonstrated lease payment reliability provide strong assurance of lease income stability.

    The company’s substantial financial position (total assets exceeding $1.9 trillion) and regulatory capital requirements create a substantial credit safety margin. Even in severe economic downturns, Wells Fargo’s scale and regulatory protections position the company to maintain lease payment obligations.

    While digital banking trends have created long-term uncertainty regarding branch location viability, Wells Fargo’s measured approach to branch optimization demonstrates commitment to maintaining key operational real estate. Investors should recognize that some properties may face non-renewal risk as the company optimizes its branch network, but the company’s lease payment reliability during the optimization process remains strong.

    For investors prioritizing income stability and credit quality over maximum yield, Wells Fargo branch leases represent an excellent addition to diversified property portfolios. The company’s institutional quality and demonstrated reliability make it a preferred tenant for conservative real estate investors.

    Key Investment Metrics

    Metric Value
    Company Wells Fargo & Company
    Sector Financial Services
    S&P Rating A–
    Moody’s Rating A1
    Investment Grade Yes
    Total Assets $1.9+ Trillion
    Annual Revenue $80+ Billion
    Market Cap $180+ Billion
    Typical Lease Term 10–20 Years
    Typical Cap Rate Range 4.5%–6.5%
    Annual Escalations 2–3%
    Lease Type Net Lease (NNN)
PRIME 6.75%FED FUNDS 3.63%5-YR UST 4.38% 10-YR UST 4.72% SOFR 30D 3.64%Updated Aug 19, 2026
Talk to a CRE Capital Advisor
Sizing a deal? | Curated capital network Tell Us About Your Deal (307) 439-0410