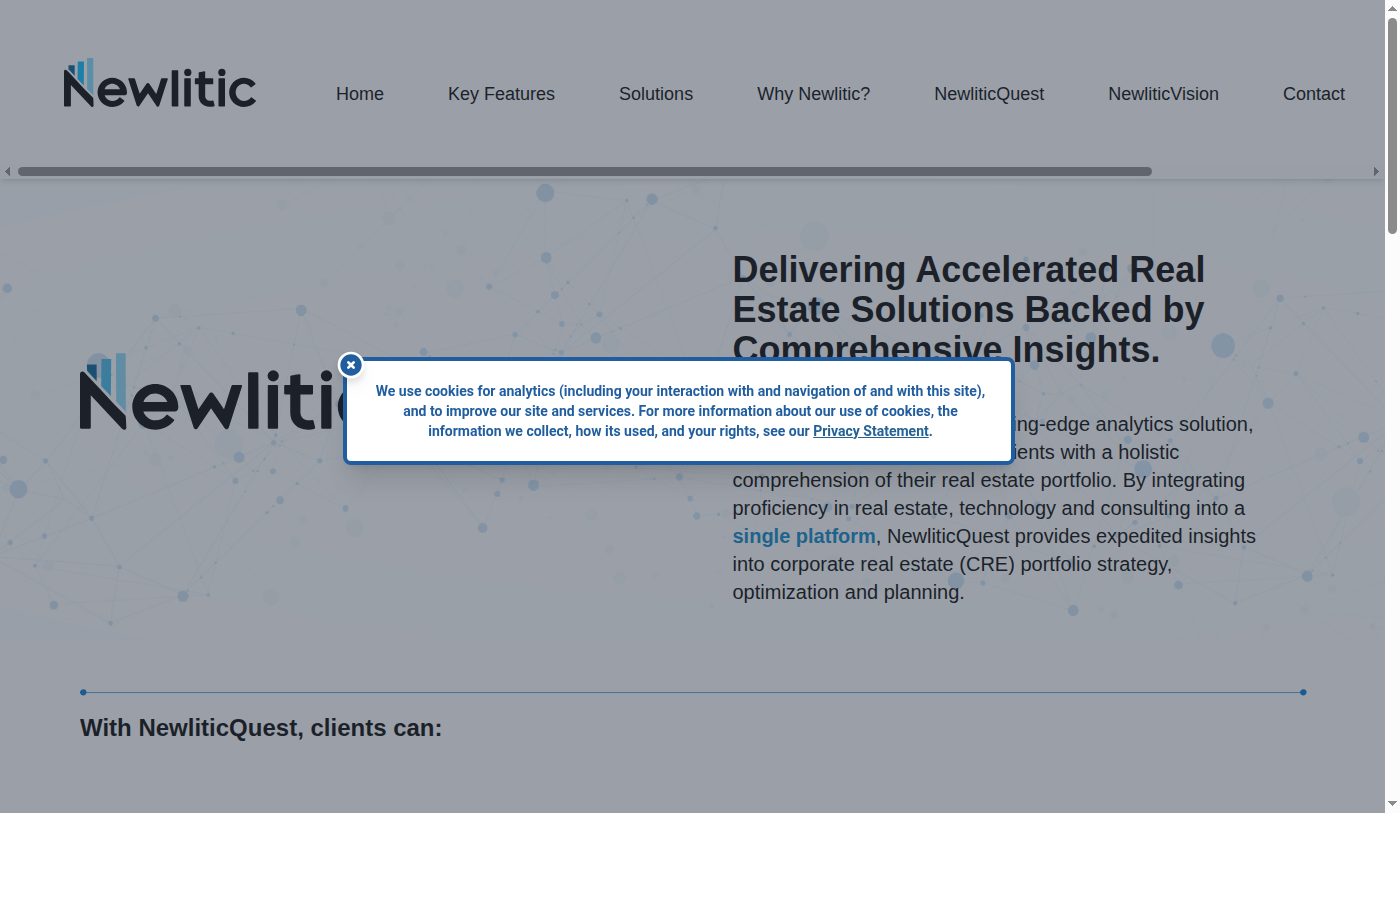
NewliticQuest is a commercial real estate analytics platform developed by Newlitic, focused primarily on advanced analytics for CRE portfolio strategy. As a Tier 2 CRE-native database tool, it enters a crowded market of platforms attempting to unify disparate property data into actionable intelligence for asset managers and acquisition teams. BestCRE research conducted in August 2026 confirms that the platform operates strictly on a custom pricing model, requiring direct engagement with their sales team to determine implementation costs. This approach places it in direct competition with established data aggregators and visualization tools, requiring buyers to carefully evaluate whether the proprietary analytics engine justifies the opaque cost structure.
Our analysis indicates that NewliticQuest targets institutional owners and mid-sized private equity shops that have outgrown basic spreadsheet models but lack the internal engineering resources to build custom data warehouses. The software attempts to bridge the gap between raw market data and executive-level decision making. By classifying it as a Tier 2 provider, we acknowledge its specialized utility while noting it has not yet achieved the universal market penetration of top-tier platforms. Evaluators must weigh its specialized portfolio strategy capabilities against the friction of adopting a newer, less universally integrated system. The platform’s survival in the Q3 2026 landscape depends heavily on its ability to prove tangible time savings in underwriting and portfolio review cycles.
What NewliticQuest does and how it works
At its core, NewliticQuest functions as a centralized ingestion and analysis engine for commercial real estate portfolio data. Users upload their existing rent rolls, operating statements, and historical performance metrics into the system, which then maps these inputs against its internal CRE-native database framework. The software applies statistical models to identify anomalies in operating expenses, project future cash flows based on user-defined market scenarios, and highlight lease expiration concentrations across multiple assets. Unlike basic reporting dashboards, the platform is engineered to handle complex ownership structures and joint venture waterfalls, calculating returns at both the property and fund levels.
The analytical mechanics rely heavily on scenario modeling. An analyst can adjust macro variables, such as projected interest rates, regional cap rate expansion, or localized tenant demand, and instantly view the cascading effects across an entire portfolio. The system generates spatial visualizations, plotting assets on a map overlayed with demographic shifts or competing supply pipelines. However, our analysis shows that the accuracy of these spatial overlays depends entirely on the quality of the third-party data feeds the user connects to the platform, as NewliticQuest acts more as an analytical processor than a primary data provider.
Furthermore, the platform includes a presentation module designed to export these complex data sets into standardized investment committee memos. Users can configure templates that automatically pull the latest modeled outputs, reducing the manual data entry typically required before quarterly reporting deadlines. While the mechanics of this export function are straightforward, configuring the initial templates requires significant administrative effort. The software demands a highly structured data environment, meaning firms with messy, unstructured legacy files will face a steep initial setup phase before realizing any analytical benefits.
9AI Framework: the score, dimension by dimension
CRE Relevance: 8/10
NewliticQuest was built specifically for the commercial real estate sector, avoiding the generic pitfalls of broader business intelligence platforms. Its data architecture natively understands CRE concepts like triple net leases, tenant improvement amortizations, and complex capital stacks. By focusing its primary use case on advanced analytics for CRE portfolio strategy, the tool directly addresses the workflow bottlenecks faced by asset managers and acquisitions analysts. The taxonomy of the database aligns with standard industry reporting metrics, meaning users do not have to translate generic financial terms into real estate equivalents. Our analysis confirms that the platform’s specialized nature allows it to model scenarios that generic tools simply cannot handle without extensive custom coding. In practice: Analysts can immediately begin modeling complex lease structures without having to teach the software basic real estate math.
Data Quality and Sources: 7/10
As a Tier 2 CRE-native database, the platform relies heavily on the data fed into it by the user and their connected third-party subscriptions. The internal validation protocols are strict, meaning the system will flag inconsistent rent roll entries or unbalanced historical ledgers before allowing them into the analytical engine. However, because NewliticQuest is primarily a processing tool rather than a primary data gatherer, the quality of its output is inextricably linked to the accuracy of the client’s internal records. Our analysis indicates that while the software excels at organizing and standardizing data, it does not independently verify market comparables or external demographic figures. In practice: The platform will effectively organize your portfolio data, but it will not magically fix underlying inaccuracies in your property management system.
Ease of Adoption: 6/10
Implementing an advanced analytics platform for portfolio strategy requires a significant commitment of time and resources. NewliticQuest demands a highly structured data environment, which means the initial onboarding phase involves extensive data mapping and cleaning. For firms transitioning from unstructured spreadsheets, this process can take several weeks. The user interface is dense, reflecting the complexity of the underlying financial models, and requires dedicated training for new analysts. While the navigation is logical for those with a strong background in real estate finance, casual users or senior executives may find the learning curve steep when attempting to build custom queries from scratch. In practice: Expect a minimum of a thirty-day implementation period and require your analysts to complete formal training before trusting the system’s outputs.
Output Accuracy: 7/10
The mathematical engine driving NewliticQuest performs complex financial calculations with a high degree of precision. When modeling joint venture waterfalls, internal rates of return, and equity multiples, the software consistently produces mathematically sound results based on the provided inputs. The risk of error stems almost entirely from user input mistakes or flawed assumptions regarding future market conditions. The platform includes audit trails that allow senior team members to trace a specific output back to its source assumption, which is critical for verifying investment committee memos. Our analysis notes that the scenario modeling outputs are highly sensitive to minor adjustments in terminal cap rates or discount rates. In practice: Asset managers can rely on the platform’s calculations, provided they rigorously verify the baseline assumptions fed into the models.
Integration and Workflow Fit: 6/10
Fitting NewliticQuest into an existing CRE tech stack requires careful planning. The platform offers standard API connections to major property management and accounting systems, allowing for automated ingestion of monthly operating data. However, our analysis reveals that customizing these connections to handle proprietary ledger codes often requires intervention from the vendor’s technical team. It does not offer the plug-and-play simplicity of some lighter visualization tools. For firms already utilizing established data warehouses, NewliticQuest can serve as a highly effective analytical layer, but it may duplicate some functions of existing business intelligence software. The lack of published documentation on specific third-party integrations means buyers must verify compatibility during the sales process. In practice: Buyers must demand a technical scoping call to ensure their specific property management software can communicate effectively with the platform.
Pricing Transparency: 3/10
BestCRE research confirms that NewliticQuest operates strictly on a custom pricing model, with no published tiers or baseline costs available on their website. This opaque approach forces prospective buyers into a protracted sales cycle simply to determine if the software fits their budget. The vendor does not disclose whether pricing is based on assets under management, user seats, or total data volume, making it impossible to estimate costs prior to direct engagement. This lack of transparency is a significant negative for mid-sized firms that need to quickly disqualify tools outside their price range. Based on our rating framework, a vendor that does not publish pricing cannot exceed a score of five in this category. In practice: Procurement teams must prepare for a lengthy negotiation process and should demand a clear explanation of how future price increases are calculated.
Support and Reliability: 6/10
As a Tier 2 provider, NewliticQuest offers a support structure that is highly personalized but lacks the massive scale of enterprise-level software companies. Users report that support tickets are typically handled by personnel who actually understand commercial real estate finance, which is a significant advantage over generic offshore help desks. However, the company does not publish guaranteed response times or service level agreements for its standard tier. Because it is an evolving platform, users may occasionally encounter bugs following major feature updates. Given its status as a growing company rather than a fully proven enterprise staple, we must cap its score in this dimension to reflect the inherent risks of adopting Tier 2 software. In practice: Users will receive knowledgeable support regarding complex CRE math, but may experience delays outside of standard business hours.
Innovation and Roadmap: 7/10
The development trajectory for NewliticQuest shows a clear focus on expanding its predictive analytics capabilities. Analysis of their recent feature releases indicates a steady investment in machine learning algorithms designed to identify subtle correlations between macroeconomic indicators and localized property performance. The company appears committed to refining its portfolio strategy tools, rather than diluting the product with generic property management features. While they do not publish a public roadmap, direct communications with the vendor suggest upcoming enhancements to their automated investment committee memo generation. The pace of development is appropriate for a Tier 2 firm, balancing stability with the introduction of advanced modeling capabilities. In practice: Buyers can expect regular updates that enhance analytical depth, though they should not rely on the vendor to rapidly build highly customized, one-off features.
Market Reputation: 6/10
Within the specific niche of advanced analytics for CRE portfolio strategy, NewliticQuest is building a respectable name among mid-sized institutional investors. However, as a Tier 2 classification implies, it has not yet achieved the widespread brand recognition of legacy platforms or top-tier competitors. The firm is generally viewed as a specialized tool for heavy quantitative analysis rather than a universal solution for all real estate professionals. Evaluators often compare it favorably against building internal models, but express hesitation regarding the long-term viability of smaller vendors in a consolidating tech market. Because it remains a relatively unproven entity compared to industry giants, its reputation score is constrained within our framework. In practice: Early adopters respect the platform’s analytical rigor, but conservative investment committees may require extra convincing to approve a lesser-known vendor.
Who should use NewliticQuest
NewliticQuest is specifically engineered for organizations that manage complex real estate portfolios and require deep analytical capabilities to drive their investment strategies. The platform is best suited for teams that have outgrown Excel but lack the resources to build a proprietary data warehouse.
Institutional Asset Managers: Professionals overseeing large, diverse portfolios who need to quickly model the impact of macroeconomic shifts on overall fund performance.
Private Equity Acquisitions Teams: Analysts who require standardized, repeatable models for underwriting complex joint venture structures and generating investment committee memos.
Portfolio Strategists: Executives tasked with identifying concentration risks, optimizing capital allocation, and forecasting long-term cash flows across multiple asset classes.
Mid-Sized REITS: Organizations needing a centralized analytical engine to standardize reporting and scenario modeling without hiring a large team of data scientists.
Who should look elsewhere
This platform is highly specialized and demands a structured data environment, making it an expensive and frustrating mistake for firms with simpler needs or disorganized records.
Small Private Investors: Individuals or small syndicators managing a handful of straightforward assets will find the platform overly complex and not worth the implementation effort.
Property Managers: Teams focused on daily operations, work orders, and tenant communications should look elsewhere, as this tool is strictly for financial analytics and portfolio strategy.
Firms with Unstructured Data: Organizations that have not yet standardized their rent rolls or historical ledgers will face an insurmountable onboarding hurdle.
Generalist Brokers: Leasing agents and investment sales brokers who need quick market data rather than deep portfolio cash flow modeling will find the tool ill-suited to their workflow.
Pricing and ROI
BestCRE research confirms that NewliticQuest operates strictly on a custom pricing model. The vendor does not publish any pricing tiers, baseline costs, or implementation fees on their website. Our analysis indicates that quotes are highly individualized, likely depending on the total assets under management, the complexity of the required integrations, and the number of user seats. Because pricing is not published, prospective buyers must engage directly with the sales team to determine if the platform aligns with their technology budget. When calculating the potential return on investment, firms must weigh the opaque software costs against the tangible time savings in their underwriting and reporting workflows. For example, if a mid-sized private equity firm spends forty hours per quarter manually consolidating portfolio data and generating investment committee memos, and NewliticQuest reduces that time by seventy percent, the firm saves roughly one hundred and twelve hours annually per analyst. At a fully burdened analyst rate of one hundred dollars per hour, this yields over eleven thousand dollars in recovered productivity per user, per year. Buyers must demand a detailed, itemized quote during the sales process to ensure the custom pricing does not exceed these projected operational savings.
Integration and CRE tech stack fit
Integrating NewliticQuest into an existing commercial real estate tech stack requires a deliberate and well-planned approach. The software is designed to sit above primary data collection systems, acting as an analytical brain rather than a system of record. It offers API connectivity to major property management and accounting platforms, such as Yardi, RealPage, and MRI, to ingest monthly operating data and rent rolls. However, our analysis indicates that mapping custom ledger codes from these legacy systems into NewliticQuest’s standardized taxonomy often requires technical assistance from the vendor during onboarding. It does not provide the immediate plug-and-play functionality seen in lighter visualization tools. For firms utilizing standard CRM platforms like Salesforce or Dealpath for pipeline management, NewliticQuest can export modeled scenarios to attach to deal records, though this is typically a manual export rather than a bi-directional sync. Buyers must ensure their primary data sources are clean and structured; otherwise, the integration process will stall. A successful deployment requires the firm’s IT lead to work closely with the vendor to establish secure, automated data pipelines.
Competitive landscape
The market for CRE portfolio analytics is highly competitive, and NewliticQuest faces significant pressure from both established data aggregators and emerging AI platforms. When evaluating this tool, buyers should directly compare it against Cotality (BestCRE Score: 91) and HelloData (BestCRE Score: 91). Cotality excels in market data aggregation and offers a more transparent pricing structure, making it a stronger candidate for firms that prioritize external market intelligence over internal portfolio modeling. HelloData provides exceptional automated data extraction from unstructured documents, which is a critical advantage for firms struggling with messy legacy files, an area where NewliticQuest requires heavily structured inputs. Additionally, firms looking for broader visualization capabilities might consider Beautiful.ai (BestCRE Score: 89) for presentation generation, though it lacks the CRE-native financial modeling engine that defines NewliticQuest. For organizations seeking to automate workflows between disparate systems, Pipedream (BestCRE Score: 89) offers superior integration flexibility, albeit without the specialized real estate analytics. Ultimately, NewliticQuest differentiates itself through its deep focus on advanced portfolio strategy and complex financial modeling. However, its opaque custom pricing and steep learning curve mean that firms must carefully assess whether they truly need its heavy quantitative capabilities, or if a more user-friendly, transparent alternative like Cotality would better serve their asset management teams.
The bottom line
NewliticQuest is a highly capable, specialized analytical engine that demands a serious commitment of time and clean data to function effectively. It is not a casual tool for quick market checks. Institutional asset managers and private equity firms with complex portfolios will find immense value in its ability to model intricate scenarios and standardize reporting across diverse asset classes. However, the strict custom pricing model and the requirement for highly structured data inputs present significant barriers to entry. If your firm struggles with disorganized records or lacks the internal discipline to manage a rigorous implementation process, this software will become an expensive shelfware failure. BestCRE recommends NewliticQuest exclusively for mature, data-disciplined organizations that require heavy quantitative modeling for portfolio strategy and are willing to negotiate aggressively through an opaque sales cycle to secure a fair price.
Frequently asked questions
Does NewliticQuest publish its pricing tiers?
No, BestCRE research confirms that the vendor operates strictly on a custom pricing model. There are no published costs or baseline fees available on their website, requiring prospective buyers to engage directly with their sales team for an individualized quote.
Is this platform suitable for daily property management tasks?
No. The software is designed specifically for advanced analytics and CRE portfolio strategy. It lacks the operational functionality required for daily property management tasks, such as work order tracking, tenant communications, or basic accounting ledgers. Property managers should seek dedicated operational software rather than this analytical tool.
Can the software handle complex joint venture waterfall calculations?
Yes, our analysis indicates that the platform’s mathematical engine is built to handle complex ownership structures and capital stacks. Users can configure the system to model intricate joint venture waterfalls, calculating internal rates of return and equity multiples at both the property and fund levels.
How long does the initial implementation process typically take?
Because the platform requires a highly structured data environment, onboarding usually takes several weeks. Firms must map their existing rent rolls and historical ledgers to the software’s taxonomy. If your legacy data is messy or unstructured, expect the implementation period to extend beyond thirty days.
Does the platform provide its own market data and demographic feeds?
NewliticQuest functions primarily as a processing engine rather than a primary data provider. While it can map and visualize demographic shifts and supply pipelines, the accuracy of these overlays depends on the third-party data subscriptions the user integrates into the platform.
Will this tool automatically clean my unstructured Excel spreadsheets?
No. The system requires highly structured data inputs to function correctly. While it has strict validation protocols to flag errors, it will not automatically organize messy legacy files. Firms must clean and standardize their data prior to, or during, the implementation phase.
Related Reviews
Compare NewliticQuest with other Market Analytics & Data tools BestCRE has scored: CompStak (88/100), Placer.ai (81/100), Scouts by Yutori (53/100) and SheetGod (48/100). Browse every review in CRE Market Analytics & Data, the full Best CRE AI Tools directory, or the 20 CRE Sectors hub.