Superlocal is an AI-powered personalized map and local discovery engine, positioned in the BestCRE database as a Tier 2 CRE-Native application for acquisitions. Currently offered at a highly accessible price point of $39.99 per year following a free tier, the platform diverges from traditional commercial real estate data providers by focusing heavily on neighborhood-level insights rather than parcel-level financial metrics. For commercial real estate principals and acquisitions analysts, the tool functions primarily as a top-of-funnel geographic filter rather than an underwriting workhorse. By aggregating local points of interest, demographic trends, and spatial data into a dynamically generated map interface, Superlocal attempts to answer qualitative questions about neighborhood viability before an analyst pulls expensive property records from platforms like Crexi or Prospect by Buildout.
While classified in the acquisitions category, our analysis indicates Superlocal operates closer to a consumer-grade discovery application adapted for light commercial use. In Q3 2026, acquisitions teams evaluating retail site selection, multifamily developments, or mixed-use projects often spend hours manually mapping local amenities, transit nodes, and competitor locations. Superlocal automates this specific spatial awareness phase. However, buyers expecting deep ownership data, debt histories, or zoning overlays will find the platform lacking compared to established industry standards. The software serves as a preliminary scouting mechanism, allowing users to rapidly discard unsuitable submarkets based on local density and amenity profiles before deploying more expensive, specialized data subscriptions for the remaining targets.
What Superlocal does and how it works
Superlocal operates as a spatial search engine, replacing traditional keyword-based property searches with an AI-driven map interface. When an acquisitions analyst inputs a query—such as identifying emerging retail corridors with high foot traffic and specific demographic markers—the platform generates a customized map highlighting zones that match the criteria. The core mechanic relies on synthesizing unstructured local data, including business reviews, municipal points of interest, and neighborhood sentiment, into visual heat maps and pin drops. This allows users to visualize the qualitative aspects of a submarket, such as the density of coffee shops, proximity to transit, or the general commercial character of a street, without needing to conduct physical site visits or manually cross-reference multiple consumer review sites.
The platform’s architecture is built around dynamic local discovery rather than static property records. Users can filter geographic areas based on highly specific, natural language prompts. For example, a multifamily developer can ask the engine to map areas within a specific city that have experienced recent growth in boutique fitness centers and organic grocers—classic leading indicators of neighborhood gentrification and rising rent ceilings. The AI processes these inputs and returns a tailored map overlay, which the analyst can then use to define search boundaries for their actual property acquisition targets.
From a workflow perspective, Superlocal functions as the layer immediately preceding direct owner outreach or parcel analysis. Once the AI map identifies a high-potential block or neighborhood, the user must export their geographic parameters and transition to a specialized CRE database to find the actual buildings available for purchase or off-market negotiation. The tool does not provide property owner names, loan maturity dates, or tax histories. Instead, it delivers a macro-level understanding of micro-locations, helping acquisitions teams narrow their geographic focus based on the commercial and cultural fabric of the surrounding area.
9AI Framework: the score, dimension by dimension
CRE Relevance: 6/10
Superlocal is classified as a Tier 2 CRE-Native application, but its primary utility bridges consumer local discovery and commercial site selection. The platform excels at identifying neighborhood amenities, mapping retail competitor density, and visualizing submarket gentrification indicators. However, it lacks the foundational commercial real estate datasets required for actual transaction underwriting, such as parcel boundaries, ownership portfolios, or historical cap rates. For an acquisitions analyst, the tool is relevant only during the initial geographic screening phase of a deal cycle. It answers questions about location quality rather than asset valuation. In practice: Acquisitions teams use the platform to validate the neighborhood narrative for investment committee memos before pulling property-specific data from dedicated CRE platforms.
Data Quality and Sources: 6/10
The platform relies on aggregating public points of interest, consumer reviews, and local business directories to power its AI maps. Our analysis indicates that while the density and freshness of this consumer-facing data are generally high in primary urban markets, the quality degrades significantly in tertiary markets or industrial zones where consumer check-ins and reviews are sparse. Because the tool does not integrate institutional-grade municipal data or verified property tax records, its outputs are entirely dependent on the accuracy of third-party local APIs. Users must verify any critical location assumptions before committing capital. In practice: Analysts should trust the map for general retail and amenity density but verify exact business operating statuses manually during the underwriting process.
Ease of Adoption: 9/10
With an interface modeled after modern consumer applications, Superlocal requires almost zero formal training for a commercial real estate professional to begin using. The natural language search bar and intuitive map controls bypass the steep learning curves typically associated with enterprise GIS software or complex property databases. New users can create an account, input a geographic query, and generate a customized map within minutes. The absence of complex data field mapping or mandatory onboarding sessions makes this one of the most accessible tools in the acquisitions tech stack. In practice: An analyst can sign up for the free tier and immediately generate a neighborhood amenity map for a pitch deck without consulting a user manual.
Output Accuracy: 6/10
The AI-driven personalized maps occasionally suffer from the hallucination issues common to generative location models. While the engine is generally accurate when plotting major retail anchors or established transit lines, it can misinterpret natural language queries regarding zoning types or misplace newer, unverified local businesses. The qualitative nature of local discovery means that accuracy is somewhat subjective; what the AI considers a highly walkable retail corridor may not align with an institutional investor’s strict definition. Users must apply a layer of professional skepticism to the generated maps, treating them as directional guides rather than absolute geographic truth. In practice: Users must cross-reference the AI-generated neighborhood boundaries with actual municipal maps before finalizing their target acquisition zones.
Integration and Workflow Fit: 3/10
As a lightweight, low-cost application, Superlocal offers minimal integration capabilities with the broader commercial real estate technology stack. The platform does not currently publish native APIs for syncing with enterprise CRMs like Dealpath or underwriting platforms like Argus. Analysts cannot easily push the AI-generated maps or location data directly into their proprietary databases without resorting to manual screenshots or basic data exports. This lack of connectivity traps the neighborhood insights within the Superlocal ecosystem, forcing users to operate the tool in a silo alongside their primary workflow applications. In practice: Analysts will find themselves taking screenshots of the generated maps to paste into investment memos rather than pulling live data feeds into their underwriting models.
Pricing Transparency: 10/10
Superlocal achieves a perfect score in this dimension by publishing its pricing model directly and unambiguously on its website. The company offers a free tier for basic usage, followed by a remarkably low premium subscription of $39.99 per year. There are no hidden implementation fees, mandatory multi-year contracts, or opaque contact sales gates that plague the majority of commercial real estate software vendors. This straightforward approach allows principals and analysts to evaluate the cost-benefit ratio instantly without engaging in protracted vendor negotiations. In practice: A junior analyst can expense the annual subscription on a corporate credit card without requiring formal procurement approval from the firm’s chief financial officer.
Support and Reliability: 5/10
At a price point of $39.99 per year, the economics do not support dedicated customer success managers or live telephone support. Users are entirely reliant on self-serve documentation, automated chatbots, and asynchronous email ticketing for troubleshooting. While the simplicity of the platform means that critical technical failures are rare, our analysis suggests that users experiencing account issues or map rendering bugs may face delayed response times. The platform is built for volume and self-sufficiency, meaning enterprise-grade service level agreements are neither offered nor expected. In practice: Teams encountering technical difficulties will need to rely on internal troubleshooting and patience, as immediate vendor intervention is not part of the service model.
Innovation and Roadmap: 6/10
The underlying technology of AI spatial mapping is advancing rapidly, and Superlocal is positioned to benefit from broader improvements in large language models and geospatial data processing. However, the company has not published a specific roadmap detailing features tailored explicitly for commercial real estate acquisitions, such as parcel data overlays or zoning integrations. The development trajectory appears focused on enhancing general local discovery rather than deepening its utility for institutional property investors. While the core mapping engine will likely become faster and more intuitive, it remains uncertain if the tool will evolve into a dedicated CRE platform. In practice: Buyers should purchase the tool for its current mapping capabilities rather than expecting future releases of institutional-grade property data.
Market Reputation: 4/10
Superlocal is an unproven entity within the institutional commercial real estate sector. While it may possess traction in consumer discovery or light small-business applications, it lacks the established track record of legacy CRE data providers. Major brokerages and institutional private equity firms do not currently cite it as a standard component of their acquisitions tech stack. The platform is viewed primarily as a novel, low-cost utility rather than a mission-critical enterprise system. Building trust among skeptical CRE principals will require the vendor to demonstrate consistent data reliability and perhaps introduce more industry-specific functionalities over time. In practice: Analysts pitching the tool internally should frame it as a low-risk, supplementary mapping experiment rather than a replacement for established data providers.
Who should use Superlocal
Superlocal is best suited for real estate professionals who require rapid, high-level geographic filtering before committing to deep property-level research. The low price point makes it an attractive supplementary tool for teams focused on neighborhood dynamics rather than pure financial modeling.
- Retail Site Selectors: Professionals needing to map competitor density, foot traffic drivers, and local demographic indicators quickly to identify viable retail corridors.
- Multifamily Developers: Teams looking to visualize neighborhood amenities, such as grocery stores and transit stops, to justify rent premiums in emerging submarkets.
- Junior Acquisitions Analysts: Staff tasked with building the market overview sections of investment committee memos who need fast, visually appealing neighborhood maps.
- Boutique Brokerages: Small teams with limited software budgets that need a cost-effective way to generate local market intelligence for client presentations.
Who should look elsewhere
Firms requiring deep, parcel-level data or institutional-grade underwriting inputs will find this platform entirely insufficient for their core workflows. It is not a replacement for traditional property databases.
- Industrial Acquisitions Teams: Investors focused on logistics, warehousing, or heavy industrial assets where consumer amenities and local discovery metrics are largely irrelevant.
- Distressed Asset Buyers: Professionals who need granular data on loan maturities, tax defaults, and property liens, none of which are provided by this mapping engine.
- Enterprise Data Teams: Organizations requiring API access to pipe raw property data directly into proprietary data lakes or complex Argus underwriting models.
Pricing and ROI
Superlocal offers one of the most transparent and accessible pricing models in the commercial real estate technology ecosystem. According to the BestCRE master database, the vendor provides a functional Free tier, which allows users to test the basic AI mapping and local discovery features with zero financial commitment. For professionals requiring unhindered access to the platform’s capabilities, the premium tier is priced at an exceptionally low $39.99 per year. This published pricing structure eliminates the friction of mandatory sales calls and custom enterprise quoting.
From an ROI perspective, the math for an acquisitions team is trivial. At under $40 annually, the software costs less than a single hour of a junior analyst’s fully burdened time. If the AI mapping engine saves an analyst just two hours per year that would have otherwise been spent manually dropping pins on Google Maps or cross-referencing neighborhood amenities for an investment memo, the tool has already delivered a positive return on investment. While it does not replace expensive core platforms like Prospect by Buildout or Crexi, its negligible cost makes it an easy addition to the tech stack as a specialized geographic visualization utility. Firms can deploy it widely across their analyst pool without triggering capital expenditure reviews.
Integration and CRE tech stack fit
When evaluating Superlocal for commercial real estate tech stack fit, buyers must recognize that it operates primarily as a standalone utility rather than a deeply integrated enterprise platform. Unlike heavy-duty databases that offer bi-directional syncs with Salesforce or Dealpath, this mapping engine does not currently feature native integrations with standard CRE underwriting or pipeline management software. The data generated by the AI—primarily visual maps and lists of local points of interest—remains confined to the platform’s proprietary interface.
For an acquisitions analyst, this means the integration process is entirely manual. Users must execute their geographic queries within Superlocal, visually identify the target submarkets, and then manually recreate those geographic boundaries within their primary property databases to pull ownership records. Exporting the visual outputs typically requires taking screenshots to embed into Word documents or PowerPoint pitch decks. While this lack of connectivity is a significant limitation for enterprise data teams looking to automate their entire deal funnel, the platform’s extreme ease of use and low cost partially mitigate the friction of operating it as an isolated, top-of-funnel screening tool.
Competitive landscape
The competitive landscape for Superlocal depends entirely on how a firm intends to use the tool. If the goal is comprehensive commercial real estate acquisitions, Superlocal competes poorly against established industry heavyweights. Platforms like Prospect by Buildout (BestCRE Score: 89) and Crexi (BestCRE Score: 84) offer vastly superior parcel-level data, ownership contact information, and transaction histories. Similarly, tools like ProspectNow (Score: 80) and PropertyRadar (Score: 79) are purpose-built for off-market deal origination, providing the granular tax and debt data that Superlocal completely lacks.
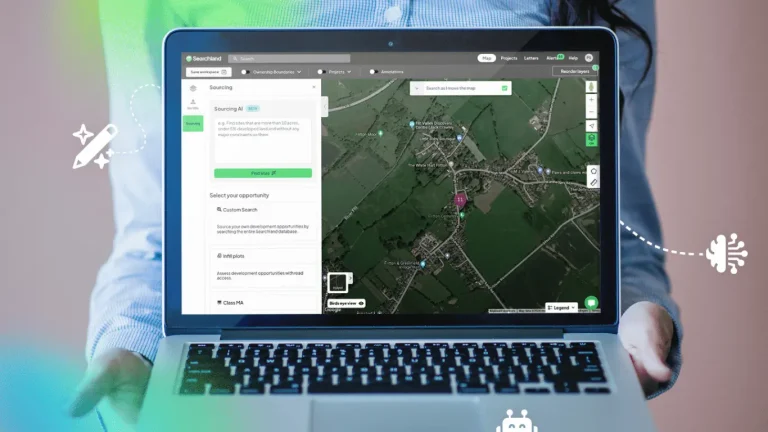
However, Superlocal is not attempting to replace these core underwriting databases. Instead, it competes in the niche space of site selection and spatial visualization. In this narrower context, it serves as a lightweight alternative to complex geographic information systems (GIS) or expensive demographic mapping add-ons. While Searchland AI (Score: 83) offers a highly sophisticated, AI-driven approach to land sourcing and site feasibility with deep zoning integrations, it comes at a significantly higher price point and steeper learning curve. REIkit (Score: 80) provides strong localized data for residential and light commercial flipping, but focuses more on deal analysis than pure spatial discovery. Ultimately, Superlocal acts as a low-cost, top-of-funnel geographic filter, designed to be used in tandem with, rather than instead of, the major platforms like Crexi or PropertyRadar.
The bottom line
Superlocal is a highly accessible, consumer-grade mapping utility that offers marginal but real value to commercial real estate acquisitions teams focused on retail and multifamily site selection. At $39.99 per year, the financial risk of adoption is practically zero. It excels at rapidly visualizing neighborhood amenities, demographic shifts, and local commercial density through an intuitive AI interface. However, principals must understand its severe limitations: it provides no parcel data, no ownership records, and no financial underwriting metrics. It is strictly a top-of-funnel geographic screening tool. If your analysts spend hours manually building neighborhood amenity maps for investment committee memos, Superlocal is an immediate, cost-effective purchase. If you are seeking a primary database to originate off-market deals or underwrite asset cash flows, you must look elsewhere to platforms like Prospect by Buildout or Crexi.
Frequently asked questions
Does Superlocal provide commercial property ownership records or contact information?
No. Superlocal is a local discovery and mapping engine, not a property ownership database. It does not provide parcel boundaries, owner names, LLC resolutions, or contact information. Users must utilize platforms like PropertyRadar or ProspectNow to obtain specific owner details after identifying a target neighborhood.
Can I export the AI-generated maps directly into my underwriting software?
The platform currently lacks native API integrations with commercial real estate underwriting tools or enterprise CRMs like Dealpath. Analysts typically extract insights manually by taking high-resolution screenshots of the generated maps to include directly in their investment committee memos, pitch decks, or internal market research reports.
Is the $39.99 annual pricing a promotional rate or the standard cost?
According to the published pricing data, $39.99 per year is the standard cost for the premium tier, following a basic free version. There are no hidden implementation fees or mandatory multi-year enterprise contracts, making it highly accessible for individual analysts or small boutique brokerages.
How accurate is the neighborhood data provided by the AI engine?
The AI engine aggregates third-party local APIs and consumer reviews, which are generally accurate in dense urban markets. However, the data quality can degrade in tertiary markets or industrial zones. Users should always manually verify critical location assumptions and business operating statuses before finalizing site selection.
Does the platform offer zoning overlays or municipal parcel maps?
No, the software focuses on qualitative neighborhood discovery rather than municipal compliance. It does not feature the detailed zoning overlays, land use classifications, or parcel boundaries found in specialized site selection platforms like Searchland AI. It is strictly for visualizing local amenities and commercial density.
What asset classes benefit most from using this mapping tool?
Retail and multifamily acquisitions teams derive the most value from this software, as these asset classes rely heavily on local amenities, foot traffic, and neighborhood gentrification trends. Industrial or heavy manufacturing investors will find little utility, as consumer points of interest do not drive their site selection.