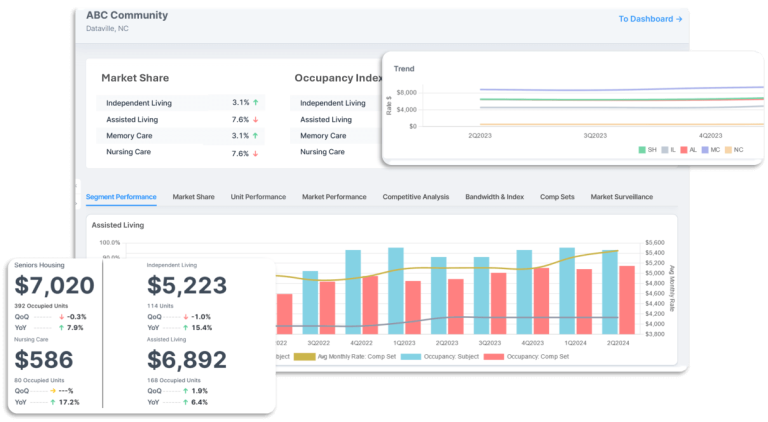
NIC MAP Vision, now presented primarily under the NIC MAP brand, is a market intelligence platform built for senior housing and care real estate. Investors use it to compare markets and assets, lenders use it to test underwriting assumptions, developers use it to assess demand and construction pipelines, and operators use it to benchmark property performance. Its core workflow contribution is replacing fragmented market research with standardized property, occupancy, rent, supply and demographic information.
The platform matters because senior housing cannot be evaluated adequately through conventional apartment or general commercial property data. Care type, resident needs, operator performance, local demographics, inventory composition and development pipelines can materially change an investment thesis. NIC MAP organizes those variables around senior housing rather than forcing analysts to adapt a broad property database. The company says its coverage includes more than 35,000 properties across the United States, giving users a substantial starting universe for screening and comparison.
Its strongest position is as a reference source for market occupancy, supply and performance trends. That makes it particularly useful during market selection, acquisition screening, development feasibility and credit review. A buyer can move from a metropolitan overview into property comparisons without assembling every input manually. The platform also includes a CMBS financial dataset, extending its relevance to debt and transaction research, although buyers should confirm the fields, history and export rights included in their proposed subscription.
BestCRE analysis: NIC MAP Vision is one of the clearest examples of a vertical CRE data product earning its place through specialization rather than feature breadth. It should not be treated as a complete underwriting system, operating platform or universal property database. Its value depends on whether senior housing is important enough to the buyer’s portfolio to justify a dedicated source. For firms active in the sector, the evidence suggests a serious diligence product. For occasional users, price, coverage and workflow fit require closer examination.
What NIC MAP Vision Does and How It Works
NIC MAP Vision centralizes market and property intelligence used to evaluate senior housing opportunities. Users can examine occupancy, asking rents or rates, inventory, absorption, construction activity, ownership, operators and local demand indicators. The practical mechanic is comparison: an analyst selects a market, property set or competitive area, reviews standardized observations, and tests whether an asset’s performance or development assumptions are credible relative to peers. Side by side market analysis can reduce the spreadsheet work required to normalize inconsistent broker packages and operator disclosures.
For development and investment work, the platform connects existing supply with planned inventory and demographic demand. That helps users identify markets where population growth may support additional capacity, then examine whether the pipeline already absorbs that opportunity. Operators can use property and market benchmarks to find performance gaps, while vendors and healthcare providers can use ownership, operator and location data for account targeting or partnership planning. Its published market fundamentals report draws from over 15,000 senior housing and care properties in 214 metropolitan markets, illustrating the type of sector benchmark the underlying data can support.
The product should be understood as decision support, not an automated investment committee. Occupancy and rate comparisons can sharpen an underwriting case, but they do not independently establish property condition, staffing stability, care quality, regulatory exposure or achievable cash flow. Data frequency, field definitions and coverage can also vary by market and property type, so serious users should inspect source methodology and sample depth before treating a result as representative. BestCRE analysis: the platform’s best use is to establish market context, challenge sponsor assumptions and direct deeper diligence toward the variables most likely to change a deal.
9AI Framework: Dimension by Dimension Analysis
CRE Relevance: 10/10
NIC MAP Vision is CRE native and unusually specific within the sector. Its data maps directly to senior housing acquisition, development, lending, operating and market selection decisions. Occupancy, rates, inventory, absorption, construction pipelines, demographics, ownership and operator information are not peripheral research inputs here. They are central to underwriting and portfolio strategy. The inclusion of care property coverage and CMBS financial information further connects the platform to healthcare real estate and debt analysis. BestCRE analysis: the maximum score is justified because the product is designed around identifiable commercial property workflows and serves participants who own, finance, develop or operate physical assets. Its narrow sector focus limits applicability outside senior housing, but that does not reduce its relevance within the category. Buyers seeking a general CRE database should view specialization as a boundary, while sector specialists should view it as the main advantage.
Data Quality and Sources: 9/10
The platform’s strongest asset is the depth and continuity of its senior housing dataset. Longitudinal occupancy, rate, inventory and construction information allows users to distinguish a temporary movement from a structural market pattern. Standardized property and market fields also support comparisons that would be difficult to produce consistently from individual offering memoranda. The vendor publicly describes more than two decades of historical market information and 16,000 or more rate and occupancy comparables. BestCRE analysis: those characteristics support a high score, but buyers still need field level diligence. They should ask how properties enter the database, how frequently each measure is refreshed, how estimates are distinguished from reported values, and where coverage becomes thin. A large national universe does not guarantee equal sample quality in every local submarket, care segment or competitive set. Data licensing and permissible downstream use also need contractual confirmation.
Ease of Adoption: 8/10
NIC MAP Vision organizes research around recognizable senior housing questions, including market comparison, deal evaluation, supply pipelines and operating benchmarks. That should shorten adoption for analysts already familiar with occupancy, inventory and rate terminology. The platform’s audience specific positioning also suggests that investors, lenders, developers and operators can begin from workflows relevant to their roles rather than navigating a generic property database. BestCRE analysis: adoption is likely easier at the research layer than at the organizational layer. Users still need agreement on competitive sets, market boundaries, care categories and acceptable underwriting uses. Teams should establish when NIC MAP data overrides, supplements or merely checks information supplied by an operator or broker. Training requirements, onboarding duration and implementation services are not published in sufficient detail to assume a uniform experience. A controlled pilot using several familiar markets is the safest way to measure usability and analyst time savings.
Output Accuracy: 8/10
NIC MAP Vision provides standardized observations and benchmarks, which can improve consistency compared with manually assembled market surveys. Its historical perspective is especially valuable when analysts need to assess whether current occupancy, rent or construction conditions depart from established patterns. Accuracy, however, must be separated from decision validity. A correctly reported market average may still be a poor comparison for a property with different care levels, age, quality, unit mix or operator profile. BestCRE analysis: the score recognizes a credible sector dataset while preserving room for verification at the asset level. Buyers should test known properties against platform records, document the dates associated with each field and examine how missing observations are handled. They should also distinguish reported data from modeled demand or forward projections. The platform can make an underwriting process more disciplined, but it cannot eliminate judgment about competitive positioning or future operating performance.
Integration and Workflow Fit: 6/10
NIC MAP Vision can fit naturally into a research workflow through exports and analyst review, but the vendor does not publish enough technical detail to treat it as an open data infrastructure layer. Public information emphasizes the platform and its decision workflows more than APIs, warehouse connectors, identity standards or packaged integrations with underwriting and CRM systems. The CMBS dataset may expand its usefulness for debt research, although access format and linkage methods should be confirmed during procurement. BestCRE analysis: the integration score is therefore moderate. A buyer that mainly needs browser based analysis and spreadsheet output may find the available workflow sufficient. A firm seeking automated ingestion into a data lake, proprietary scoring model or portfolio dashboard should request documentation, sample exports, update schedules and licensing terms before committing. The decisive question is not whether data can leave the interface, but whether it can do so reliably, repeatedly and within contractual rights.
Pricing Transparency: 4/10
NIC MAP Vision does not publish standard subscription prices, plan thresholds or data licensing fees on its public website. Prospective customers are directed toward a consultation, which means a buyer cannot estimate total cost without entering a sales process. The final quote may vary with user count, modules, markets, coverage, exports or permitted uses, but the vendor does not publicly explain the pricing formula in enough detail for direct comparison. BestCRE analysis: this materially limits pricing transparency and caps the score below the framework threshold. Enterprise data products often require scoped contracts, yet buyers still benefit from published starting prices or clear packaging. Procurement teams should request an itemized proposal that separates platform access, additional seats, datasets, historical depth, implementation, support, exports and renewal increases. They should also confirm whether internal presentations, investment memoranda, portfolio models and client deliverables are permitted uses under the license.
Support and Reliability: 7/10
NIC MAP positions its service around consultation and industry expertise, and its public customer commentary references responsiveness and delivery. That is directionally encouraging for a specialized product because users often need help interpreting definitions, coverage and competitive sets, not merely resolving login problems. The platform also publishes market research that can help customers understand broader sector conditions. However, the vendor does not publish detailed service levels, support hours, response commitments, onboarding schedules or named success coverage for each subscription tier. BestCRE analysis: support appears credible but cannot receive a top score without clearer evidence about contracted service. Buyers should ask who handles data questions, how suspected errors are investigated, whether methodology specialists are available and what assistance is included during implementation. A useful pilot should include at least one support case involving a disputed property field, because the quality and speed of that response reveal more than a generic product demonstration.
Innovation and Roadmap: 7/10
NIC MAP Vision’s innovation lies primarily in sector specialization, longitudinal data and the combination of market, property, demographic and financial context. It is not necessary for the product to depend on novel generative AI to improve a difficult CRE workflow. A well maintained reference dataset, designed around senior housing decisions, can create more defensible value than an experimental interface. The platform also supports forward looking work through demand indicators and development pipeline analysis. BestCRE analysis: the score reflects meaningful analytical differentiation without assuming capabilities the vendor has not publicly documented. Public materials do not provide enough technical detail about machine learning, automated forecasting, natural language analysis or model governance to judge those areas highly. Buyers should evaluate the product on coverage, methodology and workflow speed rather than on an AI label. Future gains are most likely to come from easier interrogation, stronger interoperability and clearer connection between market signals and asset level decisions.
Market Reputation: 9/10
NIC MAP has a long standing position in senior housing research and is widely recognized among investors, lenders, developers, operators and industry advisers. Its historical market series and recurring sector benchmarks give it a reference role that newer entrants would find difficult to reproduce quickly. The company states that its information is used by more than 8,000 senior housing stakeholders, although buyers should interpret that as a vendor reported measure rather than a count of paying customer organizations. BestCRE analysis: the platform earns a high reputation score because it is associated with a defined professional market, a durable dataset and repeated use in investment and operating discussions. It stops short of the maximum because public brand recognition does not substitute for contract specific validation. Buyers should still request references resembling their own organization, especially if they need smaller market coverage, enterprise integration, lender workflows or extensive redistribution rights.
Who Should Use NIC MAP Vision
NIC MAP Vision is best suited to senior housing investors, acquisition teams and lenders that repeatedly evaluate properties across multiple markets. These buyers can use consistent occupancy, rate, supply and demand information to screen opportunities, challenge offering materials and build comparable market sections for investment or credit memoranda. Developers assessing site feasibility are another strong fit because pipeline and demographic context can expose markets where apparent demand is already being addressed by planned inventory. Healthcare real estate teams expanding beyond medical office properties may also value a purpose built view of senior living supply.
Operators with regional or national portfolios should consider the product when they need external benchmarks for property performance or strategic market planning. Research teams, valuation professionals and vendors serving senior housing may also benefit from ownership and operator intelligence. BestCRE analysis: the economic case becomes strongest when several professionals reuse the same data across acquisitions, development, finance and operations. A buyer should have enough transaction or portfolio volume to make standardized research a recurring process rather than an occasional project. The ideal customer also has an analyst or research lead responsible for methodology, permissions and consistent competitive set construction.
Who Should Not Use NIC MAP Vision
Firms with little or no senior housing exposure should not buy NIC MAP Vision as their primary CRE intelligence platform. Its specialization is an advantage only when the sector matters to the portfolio. A generalist brokerage, industrial investor or retail operator will probably receive broader utility from CoStar or another cross sector property database. Small teams evaluating one isolated opportunity may be better served by targeted third party research, local market interviews and operator diligence, depending on subscription cost.
The product is also a weaker fit for buyers seeking a complete financial underwriting, asset management or operational care system. Market data can inform assumptions, but it does not replace a property model, accounting system, resident platform or physical diligence. Teams requiring an extensively documented API or automated warehouse feed should not assume NIC MAP will meet that need without written technical confirmation. BestCRE analysis: if the purchase case depends mainly on automation rather than proprietary senior housing coverage, another data architecture may deserve priority.
Pricing and ROI Analysis
NIC MAP Vision does not publish subscription prices, standardized packages or a public rate card. Buyers must schedule a consultation to receive a proposal. That approach prevents a reliable public estimate of annual cost and makes competitive comparison harder. A proposal should specify included markets, datasets, historical access, seats, exports, onboarding, support, renewal terms and internal distribution rights. Firms should also ask whether the CMBS dataset is included or separately licensed. Any cost figure offered without a vendor quote would be speculation.
Analysis: calculate return using avoided research hours and decisions improved, not vague claims about better intelligence. If an acquisition team reviews 40 opportunities annually and the platform saves four analyst hours on each, the direct benefit is 160 hours multiplied by the firm’s fully loaded hourly cost. Add any avoided spending on separate market studies, then compare that total with the quoted subscription and implementation cost. Do not assign value to a prevented bad investment unless the firm can document how the data changed a real decision. A pilot should record time spent before and after adoption, data gaps found, assumptions revised and work products reused across teams.
Integration and CRE Tech Stack Fit
NIC MAP Vision fits most clearly between external market research and internal underwriting. Analysts can use its benchmarks to set or challenge assumptions, then carry approved findings into spreadsheet models, investment committee materials, portfolio dashboards or credit files. Ownership and operator information may also support CRM research and business development. The practical fit depends on export formats, field definitions and licensing permissions, all of which should be reviewed before designing a recurring workflow.
Public technical information does not establish the availability or scope of an API, packaged data warehouse connector or native integrations with common CRE systems. Buyers should therefore avoid assuming automated interoperability. BestCRE analysis: start with a controlled export into the firm’s existing model, test record matching and document every manual transformation. If enterprise ingestion is required, request technical documentation, update cadence, identifiers, sample files, authentication requirements and permitted storage duration in writing. Cherre may be the more relevant alternative when data integration and normalization are the primary problem.
Competitive Landscape
CoStar is the most obvious alternative for firms wanting broad commercial property coverage, transaction context and prospecting tools across many asset classes. It has greater cross sector utility, but senior housing teams should compare the depth, definitions and historical consistency of its care property data directly with NIC MAP. Placer.ai approaches market selection from location intelligence and observed visitation patterns. It can help explain trade areas and consumer behavior, but it is not a substitute for specialized occupancy, rate and senior housing supply benchmarks.
Cherre competes more as a data management and connectivity layer than as a direct senior housing reference source. It is worth considering when the buyer’s main challenge is combining internal and external property information across systems. In that case, NIC MAP data could potentially serve as an input rather than a replacement, subject to technical access and licensing. General demographic providers and local market studies may also supplement any of these products, particularly in thinly covered areas.
BestCRE analysis: sector specialists should begin with NIC MAP Vision, then test alternatives against a fixed set of known assets and markets. Generalists should reverse that order, starting with CoStar and adding NIC MAP only if senior housing volume justifies dedicated coverage. The decisive comparison should examine property coverage, history, update frequency, definitions, export rights and analyst time, not the number of features shown in a demonstration.
The Bottom Line
Buy NIC MAP Vision if senior housing is a recurring investment, lending, development or operating focus and your team needs a common market benchmark. Its specialized dataset addresses variables that general CRE platforms can treat inconsistently or too broadly. Make the purchase contingent on validation in several familiar markets, clear licensing terms and a proposal showing exactly which data and services are included.
Do not buy it merely to add another research portal. Assign an owner, define the decisions it will support and measure whether it reduces research time or changes underwriting assumptions. BestCRE analysis: NIC MAP Vision is a category leader for senior housing intelligence, but opaque pricing and limited public integration detail prevent an unconditional recommendation. For the right sector specialist, it belongs on the shortlist. For a generalist or occasional buyer, the business case must be proven through a scoped trial.
About BestCRE
BestCRE.com is the definitive authority on commercial real estate AI, analysis, and investment intelligence. Every article advances the platform’s mission to help CRE professionals identify, evaluate, and adopt the best tools and strategies in the industry. We benchmark platforms using the 9AI Framework so CRE leaders can compare tools with clear evidence. Explore the category map at 20 CRE sectors for deeper coverage across the CRE stack.
Frequently Asked Questions
What is NIC MAP Vision?
NIC MAP Vision is a commercial real estate market intelligence platform focused on senior housing and care properties. It provides property, market, occupancy, rate, inventory, construction, demographic, ownership and operator information for investors, lenders, developers, operators and related service providers. The product is now presented primarily under the NIC MAP brand. Its role is to give analysts a standardized basis for comparing markets and testing deal assumptions that may otherwise depend on broker packages, operator disclosures and manually assembled surveys. It also includes a CMBS financial dataset. BestCRE analysis: buyers should treat it as a specialized research and benchmarking source, not as a complete underwriting, accounting, resident management or asset management system.
How does NIC MAP Vision compare with CoStar?
NIC MAP Vision is narrower than CoStar but more deliberately organized around senior housing. Its value centers on sector specific occupancy, rates, inventory, absorption, construction pipelines and care property comparisons. CoStar covers a much wider range of commercial real estate and may be more useful to firms working across office, industrial, retail, multifamily and other property types. The right choice depends on portfolio concentration. BestCRE analysis: a dedicated senior housing investor should test NIC MAP first because specialized definitions and history may matter more than broad coverage. A diversified CRE firm may prefer CoStar as its primary platform and consider NIC MAP as a specialist addition. Buyers should compare both products using the same known markets, properties and underwriting questions.
How much does NIC MAP Vision cost?
NIC MAP Vision does not publish standard prices, subscription tiers or a public starting rate. Prospective customers must request a consultation and obtain a scoped proposal. Pricing may depend on coverage, datasets, users, exports or licensing rights, but the vendor does not publicly provide enough detail to confirm the formula. Buyers should request an itemized quote covering seats, markets, historical data, onboarding, support, renewal increases and permitted internal use. They should also confirm whether specialized financial data is included. BestCRE analysis: compare the final quote with documented analyst hours saved and third party research avoided. Without those measurements, a buyer cannot distinguish productive data spending from another underused software subscription.
Who should use NIC MAP Vision?
NIC MAP Vision suits organizations that make repeated decisions about senior housing properties or markets. The strongest buyer profiles are acquisition teams comparing opportunities, lenders validating underwriting assumptions, developers testing demand and planned supply, and operators benchmarking portfolio performance. Healthcare real estate investors, valuation teams, researchers and vendors targeting senior living owners may also find useful intelligence. BestCRE analysis: the product is most defensible when several people reuse the same data across multiple decisions. A firm evaluating only one senior housing asset may not generate enough recurring value to justify a subscription. General CRE teams without meaningful exposure to the sector should begin with a broader property platform and use specialist research only when a transaction requires it.
Will NIC MAP Vision add more AI and predictive analytics?
The vendor’s public positioning emphasizes market data, benchmarks and forward looking intelligence, but it does not publish enough technical detail to confirm a specific roadmap for generative AI, machine learning features or automated investment recommendations. Buyers should not base a current purchase on capabilities that have not been released or contractually described. BestCRE analysis: the most valuable future development would be easier natural language interrogation of the dataset, clearer model documentation and stronger connections between market signals and asset level underwriting. Any predictive feature should show its source data, assumptions, update date and uncertainty. For procurement today, evaluate the platform on current coverage, history, workflow speed, exports and decision usefulness, then ask the vendor to demonstrate rather than describe planned analytics.
Related Reviews
Compare NIC MAP Vision with other tools BestCRE has scored in the same category: Matterport, Cotality, HelloData. Explore more CRE AI tool reviews in our Best CRE AI Tools directory. For sector-specific analysis and market intelligence, visit our 20 CRE Sectors hub.