
Category: CRE Underwriting & Deal Analysis

  • Real Capital Analytics Review: Global CRE Transaction Intelligence from MSCI

    Real Capital Analytics Review: Global CRE Transaction Intelligence from MSCI

    BestCRE 9AI Score

    71/100 · Contender

    Real Capital Analytics ranks #152 of 584 commercial real estate AI tools scored on the 9AI Framework. Nine dimensions, each scored out of 10: CRE relevance, data quality, ease of adoption, output accuracy, integration fit, pricing transparency, support, innovation and market reputation.

    Institutional commercial real estate investment relies on transaction data as the foundation of pricing, benchmarking, and capital allocation decisions. Transaction activity has been recovering. Green Street tracked $164 billion in sales of commercial properties valued at $25 million or more in the first half of 2026, compared with $126 billion in the first half of 2025. Cross border capital is a meaningful share of total volume, with investors from many countries active in commercial property markets. Institutional investors consider transaction comparable data essential to their underwriting process, yet many lack systematic access to global transaction records at the deal level. The gap between the volume of global CRE transactions and the ability to systematically access and analyze that data at scale is what defines the market for transaction intelligence platforms.

    Real Capital Analytics, now part of MSCI, is the industry standard for commercial real estate transaction data and capital flow analytics. The platform tracks commercial property transactions linked to a broad network of investors and lenders worldwide. RCA established itself as the definitive source for global CRE transaction records before being acquired by MSCI, which integrated the platform into its broader real estate data and analytics ecosystem. The platform provides transaction level detail on sales, recapitalizations, debt originations, and entity level activity across all major CRE asset types and global markets.

    Real Capital Analytics earns a 9AI Score of 71 out of 100, reflecting its unmatched position as the gold standard for CRE transaction intelligence, exceptional data quality, and institutional credibility. The score is moderated by opaque enterprise pricing, a steep adoption curve for less sophisticated users, and the platform’s positioning as a research and analytics tool rather than an integrated workflow solution.

    This review is part of BestCRE’s systematic coverage of commercial real estate AI tools across 20 CRE sectors. For the full AI tools directory, see our Best CRE AI Tools hub.

    What Real Capital Analytics Does and How It Works

    Real Capital Analytics provides a comprehensive database of commercial real estate transactions, capital flows, and investor activity at the global level. The platform aggregates data on property sales, recapitalizations, joint ventures, entity level transactions, and debt originations, creating an integrated view that connects individual deals to the investors, funds, and lenders involved. Users can search and filter transactions by geography, asset type, deal size, cap rate, buyer and seller identity, financing structure, and time period. The result is a research and analytics tool that enables institutional investors, lenders, advisors, and consultants to track capital movement through global real estate markets with a level of granularity that no other platform matches.

    One of the platform’s most distinctive features is its ability to link transactions to entities. Rather than simply recording that a property sold for a given price, RCA identifies the buyer, seller, and lender at the entity level, then connects those participants to their broader portfolios of acquisitions, dispositions, and financing activity. This entity level intelligence allows users to track competitor activity, identify potential joint venture partners, analyze fund deployment patterns, and understand how capital flows shift across asset types and geographies over time. The platform also publishes the RCA Commercial Property Price Indexes (RCA CPPI), which have become a widely referenced benchmark for CRE pricing trends used by investors, regulators, and media outlets worldwide.

    Since the MSCI acquisition, Real Capital Analytics has been integrated into MSCI’s broader real estate data ecosystem, which includes property level performance benchmarks, risk analytics, and ESG data. This integration allows institutional clients to combine transaction data with portfolio performance metrics and market risk indicators within a unified analytical framework. The platform serves investment managers, pension funds, sovereign wealth funds, insurance companies, commercial banks, brokerage firms, and advisory consultants across the global CRE market. Access is through a web application and API, with data licensing available for firms that need to integrate RCA data into proprietary systems.

    9AI Framework: Dimension by Dimension Analysis

    CRE Relevance: 10/10

    Real Capital Analytics exists solely to serve the commercial real estate investment community with transaction data and capital flow intelligence. Every feature, data point, and analytical capability in the platform is designed for CRE professionals who need to understand deal activity, pricing trends, and investor behavior across global commercial property markets. The platform covers all major CRE asset types including office, industrial, retail, multifamily, hotel, senior housing, and development sites. Its data is used as a primary reference by the largest institutional investors, lenders, and advisors in the world. There is no ambiguity about the platform’s CRE focus: it is the definitive transaction database for the global commercial real estate industry. In practice: Real Capital Analytics defines the category of CRE transaction intelligence and serves as the benchmark against which all other transaction data platforms are measured.

    Data Quality and Sources: 9/10

    According to MSCI, the platform tracks more than $20 trillion in commercial property transactions linked to more than 200,000 investors and lenders, making it the most comprehensive CRE transaction database in the world on MSCI’s figures, though the absence of published accuracy rates holds this score at 9. RCA aggregates data from public records, regulatory filings, press releases, proprietary research, and direct submissions from market participants. The data is verified through multiple cross referencing processes before being published, which ensures a level of accuracy that institutional investors require for pricing analysis and benchmarking. The RCA CPPI indexes have been adopted as a reference standard by financial regulators and central banks, which is a strong signal of data quality and methodological rigor. The MSCI integration adds additional data layers including property level performance benchmarks and risk analytics. In practice: RCA’s data quality is the gold standard in CRE, with the breadth, depth, and verification standards required for institutional grade investment analysis.

    Ease of Adoption: 5/10

    Real Capital Analytics is an enterprise platform designed for institutional users with significant CRE investment experience. The web application provides powerful search and filtering capabilities, but the depth of data and complexity of analytical options create a meaningful learning curve for new users. Understanding transaction structures, entity relationships, and capital flow patterns requires familiarity with institutional CRE concepts that go beyond basic property data. The platform does not offer a free tier or self serve trial, and access requires engagement with the MSCI sales team. Enterprise onboarding typically includes training sessions and account management support, but the initial time to productive use is longer than for simpler property data platforms. In practice: RCA is not a quick start tool and requires institutional CRE knowledge to use effectively, but its depth and power reward the investment in learning.

    Output Accuracy: 8/10

    The accuracy of Real Capital Analytics data is among the highest in the CRE data industry, though no published error rate supports a score above 8. The platform employs rigorous verification processes that cross reference multiple sources before publishing transaction records, and its research team actively validates deal details including pricing, cap rates, financing terms, and entity identification. The RCA CPPI indexes undergo statistical validation and are published with transparent methodology documentation, which has enabled their adoption by financial regulators as a reference benchmark. Occasional gaps may occur in markets where transaction disclosure is not legally required, or for private deals where limited public information is available. However, the platform’s institutional user base actively contributes data and corrections, creating a feedback loop that improves accuracy over time. In practice: RCA’s output accuracy is institutional grade, with verification standards that support its use as a primary reference for investment committee decisions and regulatory reporting.

    Integration and Workflow Fit: 7/10

    Real Capital Analytics provides API access and data licensing for enterprise clients that need to integrate transaction data into proprietary analytics platforms, portfolio management systems, and investment research tools. The platform has established integration partnerships with CRE technology providers including Dealpath, which enables users to access RCA comparable transaction data within their deal management workflows. The MSCI ecosystem provides additional integration points with performance benchmarks and risk analytics tools. However, RCA does not offer native integrations with property management systems such as Yardi or MRI, and the platform’s primary function is as a research and analytics tool rather than an operational system. For institutional firms with custom data infrastructure, the API supports flexible integration. In practice: RCA integrates well with investment analytics workflows through its API and strategic partnerships, though it operates as a data and research layer rather than an embedded operational tool.

    Pricing Transparency: 4/10

    Real Capital Analytics does not publish pricing on its website, and all access requires engagement with the MSCI sales team for custom enterprise pricing. There is no free tier, no self serve trial, and no publicly referenced pricing tiers. This is consistent with MSCI’s broader approach to institutional data licensing, where pricing is customized based on the scope of data access, number of users, API usage, and organizational size. For large institutional investors and advisory firms, the custom pricing model is expected and manageable. For smaller firms, independent researchers, or teams evaluating multiple data platforms, the lack of any pricing visibility creates significant procurement friction. In practice: pricing is quote only, the normal 4 for this model, and requires direct sales engagement, which is standard for institutional data platforms but limits accessibility and makes cost comparison difficult.

    Support and Reliability: 7/10

    As part of MSCI, Real Capital Analytics benefits from the infrastructure, support resources, and operational standards of a publicly traded global data company. Enterprise clients receive dedicated account management, training resources, and technical support. The web application and API infrastructure are maintained to institutional grade reliability standards, and MSCI’s financial stability ensures long term platform continuity. The company provides regular product updates, data methodology documentation, and research publications that support user education and analytical capability development. In practice: support and reliability, held at 7 because no SLA or SOC 2 report is published, are strong in the CRE data industry, backed by the resources and operational maturity of a major publicly traded data and analytics company.

    Innovation and Roadmap: 7/10

    Real Capital Analytics has steadily expanded its analytical capabilities since its founding in 2000, evolving from a transaction database into a comprehensive capital markets intelligence platform. The development of the RCA CPPI indexes represented a significant innovation that created a new standard for CRE pricing transparency. The MSCI acquisition has accelerated product development by integrating transaction data with MSCI’s performance benchmarks, risk models, and ESG analytics. Recent developments include enhanced entity analytics, portfolio tracking tools, and AI powered data enrichment capabilities. However, the pace of user facing innovation has been moderate compared with newer proptech platforms, reflecting the platform’s established market position and the conservative preferences of its institutional user base. In practice: RCA innovates steadily within its established framework, with the MSCI ecosystem providing resources for continued development and cross product integration.

    Market Reputation: 7/10

    Real Capital Analytics has a long established market reputation among CRE transaction data platforms, and the score is held at 7 because no CRE clients are named publicly. The $950 million acquisition by MSCI validated its position as an essential institutional data asset. The platform’s data is cited by central banks, financial regulators, academic researchers, and virtually every major CRE advisory and investment firm globally. The RCA CPPI indexes are referenced in financial media, regulatory filings, and investment committee presentations as a definitive measure of CRE pricing trends. The platform’s 25 year track record and its integration into the MSCI ecosystem create a credibility signal that is unmatched in the CRE data market. In practice: Real Capital Analytics is the gold standard for CRE transaction intelligence, with a market reputation built on two decades of institutional trust and reinforced by its $950 million acquisition by MSCI.

    9AI Score Card Real Capital Analytics (MSCI)
    77
    71 / 100
    Solid Platform
    CRE Transaction Intelligence and Capital Flow Analytics
    Real Capital Analytics
    MSCI Real Capital Analytics provides the industry standard database of global CRE transactions, tracking $20 trillion in deals across 200,000 investors and lenders worldwide.
    9 Dimensions, Scored 1 to 10
    1. CRE Relevance
    10/100
    2. Data Quality & Sources
    10/100
    3. Ease of Adoption
    10/10
    4. Output Accuracy
    9/10
    5. Integration & Workflow Fit
    5/10
    6. Pricing Transparency
    8/10
    7. Support & Reliability
    7/10
    8. Innovation & Roadmap
    4/10
    9. Market Reputation
    10/100
    BestCRE.com, 9AI Framework v2 Reviewed May 2026

    Who Should Use Real Capital Analytics

    Real Capital Analytics is essential for institutional CRE investors, pension funds, sovereign wealth funds, and insurance companies that need comprehensive transaction data to inform acquisition pricing, portfolio benchmarking, and capital allocation decisions. Investment banks and advisory firms use the platform to support deal valuation, market analysis, and client presentations. Research teams at brokerage firms rely on RCA data for market reports and competitive intelligence. Academic researchers and policy analysts use the RCA CPPI indexes and transaction data for empirical studies on CRE pricing dynamics. Any organization that needs to understand how capital flows through global commercial real estate markets at the deal level will find RCA indispensable.

    Who Should Not Use Real Capital Analytics

    Real Capital Analytics is not designed for individual brokers, small property managers, or owner operators who manage fewer than a dozen properties. The platform’s enterprise pricing, institutional focus, and analytical complexity make it impractical for teams that need basic property data or simple listing searches. CRE professionals who primarily need property level information such as assessed values, ownership records, or lease comparables will find better value in platforms like Reonomy, CompStak, or CoStar. Firms that need operational tools for managing leases, tracking maintenance, or processing rent payments should look to property management platforms rather than transaction analytics databases.

    Pricing and ROI Analysis

    Real Capital Analytics does not publish pricing, and all access is through custom enterprise licensing negotiated with the MSCI sales team. Pricing is understood to vary based on the scope of data access (geographic coverage, asset type coverage, historical depth), number of users, API usage, and the size of the subscribing organization. For institutional investors managing billions in CRE assets, the cost of RCA access is negligible relative to the value of the transaction intelligence it provides. A single acquisition decision informed by comprehensive comparable transaction data can justify years of subscription cost. The platform’s ROI is most tangible for firms that use transaction comparables in investment committee presentations, pricing negotiations, and portfolio performance benchmarking, where the credibility of RCA data directly supports decision quality.

    Integration and CRE Tech Stack Fit

    Real Capital Analytics provides API access and data licensing for enterprise clients that need to integrate transaction data into proprietary analytics platforms, portfolio management systems, and investment research tools. The platform has an established integration partnership with Dealpath that enables CRE investment managers to access RCA comparable transaction data within their deal management workflows. Within the MSCI ecosystem, RCA data can be combined with performance benchmarks, risk analytics, and ESG data through MSCI’s integrated platform offerings. Custom data feeds are available for firms that need to embed transaction intelligence into internal systems. The platform does not offer native integrations with property management systems such as Yardi or MRI, reflecting its positioning as an investment analytics tool rather than an operational platform.

    Competitive Landscape

    Real Capital Analytics competes with CoStar’s Capital Markets analytics, which provides transaction data alongside CoStar’s broader property listings and market intelligence ecosystem. CompStak offers lease comparable data that complements but does not replicate RCA’s transaction coverage. Green Street provides property level pricing analytics and REIT research that overlaps partially with RCA’s pricing intelligence. NCREIF provides portfolio performance benchmarks that serve a different but adjacent use case. RCA differentiates through the scale of its global transaction database ($20 trillion in tracked deals, according to MSCI), the depth of its entity level intelligence (200,000 linked investors and lenders), and the institutional credibility of the RCA CPPI indexes. The MSCI backing further separates RCA from competitors through brand recognition and cross product integration opportunities.

    The Bottom Line

    Real Capital Analytics is the definitive global database for commercial real estate transaction intelligence, with unmatched data quality, institutional credibility, and market reputation. The $950 million acquisition by MSCI validated its position as an essential data asset for the global CRE investment community. The platform’s limitations are its opaque enterprise pricing, steep adoption curve for less experienced users, and its positioning as a research and analytics layer rather than an integrated workflow tool. For institutional investors, lenders, advisors, and researchers who need to understand capital flows and transaction dynamics at the global level, Real Capital Analytics is irreplaceable. The 9AI Score of 71 reflects a platform with the best data quality in CRE transaction data and a long established market reputation, moderated by accessibility and pricing transparency considerations that limit its reach beyond institutional users.

    About BestCRE

    BestCRE is the definitive authority on commercial real estate AI, analysis, and investment intelligence. Every article advances three long term SEO goals: ranking number one for Best CRE, Best CRE AI, and Best CRE AI Tools. We benchmark platforms using the 9AI Framework so CRE leaders can compare tools with clear evidence. Explore the category map at 20 CRE sectors for deeper coverage across the CRE stack.

    Frequently Asked Questions

    What types of CRE transactions does Real Capital Analytics track?

    Real Capital Analytics tracks a comprehensive range of commercial real estate transactions including outright sales, partial interest sales, recapitalizations, joint ventures, entity level transactions, and debt originations. The platform covers all major CRE asset types including office, industrial, retail, multifamily, hotel, senior housing, self storage, student housing, and development sites. Transaction records include deal pricing, cap rates, price per square foot or per unit, buyer and seller identities, financing details, and property characteristics. The database covers both domestic U.S. transactions and international deals across major global markets. According to MSCI’s own reporting, the platform tracks more than $20 trillion in cumulative transaction volume linked to more than 200,000 investors and lenders, making it the most comprehensive CRE transaction database available to the investment community.

    How does Real Capital Analytics differ from CoStar for transaction data?

    While both platforms provide CRE transaction data, they serve different primary functions. CoStar is a comprehensive CRE data platform that covers property listings, lease comparables, market analytics, and news alongside its transaction database. Real Capital Analytics focuses specifically on investment transactions and capital flow analytics at the institutional level. RCA’s entity level intelligence, which links transactions to specific investors, funds, and lenders, is deeper and more systematic than CoStar’s participant data. The RCA CPPI indexes provide pricing benchmarks that are used by financial regulators and central banks, which reflects a level of methodological rigor that is distinct from CoStar’s broader market analytics. Many institutional firms use both platforms: CoStar for property level research and market intelligence, and RCA for transaction comparable analysis and capital flow tracking.

    What are the RCA Commercial Property Price Indexes?

    The RCA CPPI (Commercial Property Price Indexes) are a family of price indexes that track commercial real estate pricing trends across the United States and major global markets. The indexes are constructed using repeat sales methodology applied to the RCA transaction database, which measures price changes for properties that have sold more than once. The indexes cover major asset types including apartment, office, industrial, retail, and composite categories, with geographic breakdowns at the national, regional, and metro level. The RCA CPPI is widely used by institutional investors for portfolio benchmarking, by financial regulators for systemic risk monitoring, and by media outlets for reporting on CRE market conditions. The indexes are updated monthly and published with transparent methodology documentation that allows users to understand exactly how the price movements are calculated and what data underlies each index value.

    What happened when MSCI acquired Real Capital Analytics?

    MSCI acquired Real Capital Analytics in 2021 for approximately $950 million in cash, integrating the CRE transaction database into MSCI’s broader real estate data and analytics ecosystem. The acquisition combined RCA’s transaction level intelligence with MSCI’s existing real estate capabilities, which include property level performance benchmarks (formerly IPD), portfolio risk analytics, and ESG data. Post acquisition, RCA has continued to operate its transaction database and CPPI indexes while benefiting from MSCI’s global distribution network, technology infrastructure, and client relationships. The integration has created opportunities for institutional clients to combine transaction data with performance benchmarks and risk analytics within a unified analytical framework. MSCI’s financial resources as a publicly traded company provide stability and investment capacity that supports continued platform development.

    Is Real Capital Analytics accessible to mid market CRE firms?

    Real Capital Analytics is primarily designed for and priced for institutional users, which can create accessibility challenges for mid market CRE firms. The platform does not offer a free tier, self serve trial, or published pricing, and all access requires engagement with the MSCI sales team. However, mid market investment firms, regional brokerage houses, and advisory consultants do use the platform when transaction comparable data is essential to their business. Some firms access RCA data through industry associations or research partnerships that provide shared access at reduced cost. For mid market firms that cannot justify a full enterprise license, alternatives such as CoStar, CompStak, and public record based transaction databases may provide sufficient transaction data for regional investment analysis. The decision typically comes down to whether the firm’s investment activity and client expectations require the depth of global transaction intelligence that only RCA provides.

    Related Reviews

    Compare Real Capital Analytics with other Market Analytics & Data tools BestCRE has scored: Placer.ai (74/100), ApartmentIQ (71/100), NewliticQuest (62/100) and Capalyze (60/100). Browse every review in CRE Market Analytics & Data, the full Best CRE AI Tools directory, or the 20 CRE Sectors hub.

  • Reonomy Review: AI Powered Property and Ownership Intelligence for Commercial Real Estate

    Reonomy Review: AI Powered Property and Ownership Intelligence for Commercial Real Estate

    BestCRE 9AI Score

    71/100 · Contender

    Reonomy ranks #152 of 584 commercial real estate AI tools scored on the 9AI Framework. Nine dimensions, each scored out of 10: CRE relevance, data quality, ease of adoption, output accuracy, integration fit, pricing transparency, support, innovation and market reputation.

    Commercial real estate prospecting and deal origination remain among the most time intensive activities in the industry. The average institutional acquisition team screens many properties for every transaction that closes, with ownership identification and contact verification consuming a large share of the sourcing cycle. CRE professionals spend a substantial amount of time each week on property research and owner outreach, much of it manually cross referencing county records, corporate registrations, and fragmented databases. Green Street tracked $164 billion in sales of commercial properties valued at $25 million or more in the first half of 2026, compared with $126 billion in the first half of 2025. Yet the tools available for identifying who actually owns a given property have historically lagged far behind the sophistication of the deals themselves. The gap between transaction velocity and data accessibility has created persistent demand for platforms that can aggregate property intelligence at scale.

    Reonomy addresses this gap with an AI powered property intelligence platform that covers more than 54 million commercial properties and 42 million mortgages across the United States. The platform uses proprietary machine learning algorithms to aggregate, structure, and connect property data from thousands of sources, piercing LLC layers to identify true property owners and providing accurate contact information including phone numbers, email addresses, and mailing addresses. Originally founded as an independent proptech company, Reonomy was acquired by Altus Group, adding the backing of a global commercial real estate software and data analytics firm. The platform offers a free trial for US users, which lowers the barrier to evaluating it against other enterprise CRE data platforms.

    Reonomy earns a 9AI Score of 71 out of 100, reflecting exceptional CRE relevance and strong data quality, a free trial for US users, and a well established market position. The platform’s combination of machine learning powered ownership intelligence, comprehensive property coverage, and an accessible free trial makes it a compelling tool for CRE prospecting, deal sourcing, and market analysis workflows.

    This review is part of BestCRE’s systematic coverage of commercial real estate AI tools across 20 CRE sectors. For the full AI tools directory, see our Best CRE AI Tools hub.

    What Reonomy Does and How It Works

    Reonomy is a commercial real estate data platform that combines property records, ownership information, transaction history, mortgage data, and contact details into a unified intelligence layer. The platform ingests data from thousands of public and proprietary sources, including county assessor records, deed filings, corporate registrations, mortgage origination documents, and business databases. Reonomy’s proprietary machine learning algorithms process this raw data to create a structured, searchable database organized around what the company calls the Reonomy ID, a unique identifier that links disparate data points about each property into a single comprehensive profile.

    One of the platform’s most distinctive capabilities is its ownership resolution engine. Commercial properties are frequently held through LLCs, trusts, and multi layered corporate structures that obscure the identity of the beneficial owner. Reonomy’s algorithms trace these ownership chains to identify the actual decision makers behind property holdings, then cross reference billions of contact records to provide verified phone numbers, email addresses, and mailing addresses. This capability transforms what was traditionally a manual, multi hour research process into an automated workflow that can deliver ownership intelligence in seconds.

    The web application allows users to search for commercial properties by location, sale date, owner portfolio size, asset type, loan origination date, and mortgage amount. Users can build targeted prospect lists based on property characteristics, ownership patterns, and financial attributes. The platform also provides property level analytics including assessed value, tax history, building specifications, and comparable sales data. For enterprise clients, Reonomy offers API access and data licensing options that allow firms to integrate property intelligence into their own systems and workflows. The Altus Group acquisition in 2021 has expanded the platform’s data resources and positioned it within a broader ecosystem of commercial real estate analytics and valuation tools.

    9AI Framework: Dimension by Dimension Analysis

    CRE Relevance: 10/10

    Reonomy is built exclusively for commercial real estate, with every feature and data source oriented toward CRE property intelligence, ownership identification, and deal sourcing. The platform covers 54 million commercial properties across all 50 states and all major asset types including office, industrial, retail, multifamily, hospitality, and special purpose properties. Every workflow in the platform, from property search to owner contact retrieval to portfolio analysis, addresses a recognized CRE operational need. The platform does not attempt to serve adjacent industries or repurpose generic data tools. This singular focus on commercial real estate makes Reonomy one of the most CRE relevant platforms in the entire AI tools landscape. In practice: Reonomy is a pure play CRE data platform where every feature, data source, and workflow directly serves commercial real estate professionals.

    Data Quality and Sources: 8/10

    Reonomy aggregates data from thousands of public and proprietary sources, creating a unified property intelligence layer that covers 54 million commercial properties and 42 million mortgages. The platform’s machine learning algorithms are specifically designed to resolve ownership ambiguity by piercing LLC structures and matching beneficial owners to verified contact information. The Reonomy ID system creates a persistent, unique identifier for each property that connects disparate data points across sources, which reduces the reconciliation errors that plague manual research workflows. Data freshness varies by source, with some records updating in near real time and others reflecting periodic batch updates from county and state databases. The Altus Group acquisition has expanded access to additional data assets, particularly in the valuation and analytics space. In practice: Reonomy’s data quality is strong in the CRE property intelligence category, with particular strength in ownership resolution and contact verification.

    Ease of Adoption: 7/10

    Reonomy offers a free trial that allows prospective users to evaluate the platform’s capabilities before committing to a paid subscription. The web application interface is designed for business users and does not require technical expertise to navigate. Users can begin searching for properties, identifying owners, and building prospect lists within minutes of account creation. The search interface supports both basic filters (location, asset type, sale date) and more advanced queries (loan origination, portfolio size, corporate structure). The learning curve is manageable for CRE professionals who are familiar with property data concepts, though the full power of the platform’s advanced filtering and list building capabilities requires some exploration. Enterprise features including API access and data licensing have a higher adoption threshold that requires technical implementation. In practice: individual users can start extracting value from Reonomy quickly through the web application, while enterprise deployments require more structured onboarding.

    Output Accuracy: 7/10

    Reonomy’s output accuracy is strongest in its core competency of property data aggregation and ownership resolution. The platform’s machine learning algorithms are designed to handle the complexity of commercial property ownership structures, including multi layered LLCs, trusts, and corporate entities. Contact verification is powered by cross referencing billions of records, which produces generally reliable results for most commercial property owners, though no accuracy rate is published. Property data accuracy depends on the freshness and completeness of underlying source records, which can vary by county and state. Capterra and GetApp reviews indicate that users generally find the data reliable for prospecting and research, with occasional gaps in smaller or less active markets. Transaction and mortgage data accuracy is high for recent activity but may be less complete for historical records in some jurisdictions. In practice: Reonomy delivers reliable property and ownership intelligence for mainstream CRE markets, with users advised to verify critical data points through independent sources for high stakes transactions.

    Integration and Workflow Fit: 6/10

    Reonomy provides API access and data licensing for enterprise clients, which allows firms to integrate property intelligence into CRM systems, proprietary analytics platforms, and deal management workflows. The platform also supports data exports in standard formats for offline analysis. However, Reonomy does not offer native integrations with CRE property management systems such as Yardi or MRI, or with CRE deal management platforms like Dealpath. The platform operates primarily as a property data and prospecting layer rather than as an embedded component of end to end CRE workflows. The Altus Group ecosystem provides some integration opportunities with Altus’s other products, but the breadth of native CRE system connectors remains limited. In practice: Reonomy integrates well with custom data workflows through its API but lacks the native CRE system connectors that would make it a seamless part of an integrated property management or deal management tech stack.

    Pricing Transparency: 5/10

    Reonomy does not publish dollar pricing, but its free trial makes it easier to evaluate than most enterprise CRE data platforms. Subscriptions provide access to all geographies and property types across all US states. The platform offers a free trial that allows users to evaluate the product before committing. A free trial is uncommon among CRE data platforms, where custom pricing and mandatory sales conversations are the norm. The free trial makes it straightforward for firms to evaluate and compare Reonomy against alternatives without engaging in extended procurement processes. In practice: Reonomy’s approach to evaluation is a differentiator in the CRE data market, with a free trial that reduces procurement friction but no published rates.

    Support and Reliability: 7/10

    Reonomy operates under the Altus Group umbrella, which provides institutional backing and enterprise grade infrastructure. The platform offers customer support through email and in app channels, with dedicated account management available for enterprise clients. The web application is cloud based and generally reliable, though some user reviews mention occasional performance issues during complex searches with multiple filters. The Altus Group acquisition has enhanced the platform’s operational stability and expanded the resources available for ongoing development and support. Documentation and help resources are available through the platform’s support center, and the company provides onboarding assistance for new users. In practice: support is solid and backed by an institutional parent company, with typical enterprise grade responsiveness for account inquiries and technical issues.

    Innovation and Roadmap: 7/10

    Reonomy’s core innovation is its machine learning powered ownership resolution engine, which represents genuine technical differentiation in the CRE data market. The Reonomy ID system, which creates a unique persistent identifier for each commercial property, is a foundational innovation that enables cross source data linking at a scale that manual processes cannot replicate. The Altus Group acquisition has positioned Reonomy within a broader innovation ecosystem that includes ARGUS valuation software and other CRE analytics tools, which creates opportunities for cross product integration and feature expansion. However, the pace of public feature releases has been moderate since the acquisition, and the platform’s core functionality has remained relatively stable. In practice: Reonomy’s foundational ML technology is genuinely innovative, and the Altus Group ecosystem creates a strong platform for continued development, though the cadence of visible innovation could be more aggressive.

    Market Reputation: 7/10

    Reonomy has established a strong reputation as one of the leading CRE property intelligence platforms in the United States. The 2021 acquisition by Altus Group validated the platform’s commercial viability and market position, integrating it into a global CRE software ecosystem. The platform is widely referenced in CRE industry publications and has been recognized as a top data source by CRE Daily, GetApp, and other review platforms. User reviews on Capterra and G2 are generally positive, with particular praise for the platform’s ownership data and prospecting capabilities. The combination of broad property coverage (54 million properties), a free trial, and Altus Group backing creates a credibility signal that resonates with institutional and mid market CRE firms. In practice: Reonomy is a well recognized and respected CRE data platform with institutional backing that reinforces its market credibility.

    9AI Score Card Reonomy
    78
    71 / 100
    Solid Platform
    Property Intelligence and Ownership Data
    Reonomy
    Reonomy delivers AI powered property intelligence across 54 million commercial properties, using machine learning to resolve ownership and connect CRE professionals with verified decision makers.
    9 Dimensions, Scored 1 to 10
    1. CRE Relevance
    10/100
    2. Data Quality & Sources
    10/10
    3. Ease of Adoption
    8/10
    4. Output Accuracy
    7/10
    5. Integration & Workflow Fit
    7/10
    6. Pricing Transparency
    6/10
    7. Support & Reliability
    5/10
    8. Innovation & Roadmap
    7/10
    9. Market Reputation
    7/10
    BestCRE.com, 9AI Framework v2 Reviewed May 2026

    Who Should Use Reonomy

    Reonomy is an essential tool for CRE investment sales brokers, acquisitions teams, and capital markets professionals who need to identify property owners and build targeted prospect lists at scale. The platform is particularly valuable for firms that source deals through direct outreach rather than relying exclusively on listed inventory. Lenders and loan originators benefit from the platform’s ability to identify borrowers and assess property collateral through transaction and mortgage data. Institutional investors and private equity firms can use Reonomy to screen markets, identify acquisition targets, and analyze ownership patterns across portfolios. The free trial makes it accessible for individual practitioners and small teams that want to test the platform before committing.

    Who Should Not Use Reonomy

    Reonomy is less suitable for CRE professionals who focus primarily on property management, asset operations, or tenant facing workflows rather than deal sourcing and prospecting. The platform does not provide operational tools for managing leases, tracking maintenance, or processing rent payments. Firms that need deep integration with property management systems such as Yardi or MRI will find Reonomy operates as a separate data layer rather than an embedded module. International CRE firms will also find limited value, as the platform’s coverage is focused on the United States. Teams that already have comprehensive access to CoStar’s ownership data may find some functional overlap, though the platforms serve partially different use cases.

    Pricing and ROI Analysis

    Reonomy offers a free trial for US users, and buyers should confirm current subscription pricing with the vendor. The subscription provides access to all geographies and property types across all 50 states. A free trial allows users to evaluate the platform before committing. The ROI case for Reonomy centers on time savings in property research and owner identification. A broker or acquisitions professional who saves even five hours per week on prospecting research can justify the subscription cost through recovered productive time. For firms that close one additional deal per year as a result of better prospecting data, the annual subscription cost is negligible relative to transaction fees or investment returns. The published pricing eliminates procurement friction and allows teams to budget with confidence.

    Integration and CRE Tech Stack Fit

    Reonomy provides API access and data licensing for enterprise clients that need to integrate property intelligence into CRM systems, deal management platforms, or proprietary analytics tools. The platform supports standard data exports for offline analysis and prospect list building. Within the Altus Group ecosystem, there are natural integration opportunities with ARGUS and other Altus products, though native cross product connectors may still be developing. The platform does not offer out of the box integrations with Yardi, MRI, CoStar, or Salesforce CRM, which means firms must build custom integrations or manage data through manual workflows. For teams that use Reonomy primarily as a prospecting and research tool, the web application is self contained and does not require system integration to deliver value.

    Competitive Landscape

    Reonomy competes with CRE property data platforms including CoStar, which offers broader market analytics alongside property and ownership data, and PropertyShark, which provides detailed property reports for specific markets. CompStak competes in the lease comp and transaction data segment. Reonomy differentiates through its machine learning powered ownership resolution, which traces LLC structures to identify true beneficial owners, and its relatively transparent published pricing that contrasts with the custom pricing models of larger competitors. The Altus Group backing provides additional differentiation through access to ARGUS valuation data and a broader CRE analytics ecosystem. While CoStar’s total data coverage is more comprehensive, Reonomy’s focus on ownership intelligence and prospecting efficiency creates a distinct value proposition for deal sourcing teams.

    The Bottom Line

    Reonomy is a strong CRE property intelligence platform with exceptional relevance, deep data coverage across 54 million commercial properties, and a machine learning engine that excels at ownership resolution and contact verification. The free trial for US users sets it apart from competitors that require lengthy sales processes. The platform’s primary limitations are moderate integration depth with CRE systems and a U.S. only coverage footprint. For CRE professionals who need to identify property owners, build prospect lists, and source deals through direct outreach, Reonomy delivers measurable value with minimal procurement friction. The 9AI Score of 71 reflects a solid platform with particular strength in data quality, CRE relevance, and trial accessibility.

    About BestCRE

    BestCRE is the definitive authority on commercial real estate AI, analysis, and investment intelligence. Every article advances three long term SEO goals: ranking number one for Best CRE, Best CRE AI, and Best CRE AI Tools. We benchmark platforms using the 9AI Framework so CRE leaders can compare tools with clear evidence. Explore the category map at 20 CRE sectors for deeper coverage across the CRE stack.

    Frequently Asked Questions

    How does Reonomy identify the true owners behind LLCs and corporate entities?

    Reonomy uses proprietary machine learning algorithms that trace ownership chains through multiple layers of corporate registrations, LLC filings, trust documents, and public records. The platform cross references billions of data points to connect properties held through opaque structures to the beneficial owners who control investment decisions. This process, sometimes called LLC piercing, automates what traditionally required hours of manual research through county records and secretary of state filings. The algorithms also match identified owners to verified contact information by scanning business directories, corporate filings, and professional databases. According to industry estimates, approximately 60 to 70 percent of commercial properties in major U.S. markets are held through LLC or trust structures, which makes this ownership resolution capability essential for effective prospecting and deal sourcing in commercial real estate.

    What types of CRE professionals benefit most from Reonomy?

    Investment sales brokers and acquisitions professionals benefit most from Reonomy because the platform directly addresses their core workflow of identifying property owners, building prospect lists, and initiating outreach for off market deals. Capital markets teams at brokerage firms use the platform to identify potential sellers and borrowers based on property characteristics, transaction history, and loan maturity schedules. Institutional investors and private equity firms leverage Reonomy for market screening and target identification across geographic areas and asset types. Commercial lenders use the ownership and mortgage data to identify refinancing opportunities and potential borrowers. According to CBRE’s 2025 analysis, firms that use AI powered prospecting tools report 25 to 35 percent higher deal flow compared with teams relying on traditional manual research methods.

    How does Reonomy pricing compare to competitors like CoStar?

    Reonomy’s free trial for US users gives buyers an easier way to evaluate the platform than CoStar’s enterprise sales process. Reonomy also offers a free trial for US users. The tradeoff is that CoStar offers a broader data ecosystem that includes listings, market analytics, lease comps, and news alongside property and ownership data, while Reonomy focuses specifically on property intelligence and ownership resolution. For firms that primarily need prospecting and ownership data, Reonomy offers strong value at a lower price point. For firms that need comprehensive market analytics and listings data alongside ownership intelligence, CoStar’s broader platform may justify its higher cost.

    What happened after Altus Group acquired Reonomy?

    Altus Group, a global provider of commercial real estate software and data analytics, acquired Reonomy in 2021 to expand its property data capabilities and strengthen its position in the CRE technology market. The acquisition integrated Reonomy’s property intelligence platform into the Altus Group ecosystem, which includes ARGUS (the industry standard for commercial real estate valuation and asset management) and other analytics products. Post acquisition, Reonomy has continued to operate as a distinct product while benefiting from Altus Group’s data resources, financial stability, and enterprise client relationships. The acquisition has positioned Reonomy within a broader institutional framework, which enhances its credibility for enterprise buyers and creates opportunities for cross product integration. The platform’s core functionality, pricing model, and user experience have remained largely consistent since the acquisition.

    How comprehensive is Reonomy’s coverage across U.S. markets?

    Reonomy covers more than 54 million commercial properties and 42 million mortgages across all 50 U.S. states. The platform provides access to all major asset types including office, industrial, retail, multifamily, hospitality, self storage, and special purpose properties. Coverage is strongest in major metropolitan markets where county records are digitized and regularly updated, with data depth including property characteristics, assessed values, tax history, transaction records, mortgage information, and ownership details. In smaller or rural markets, data completeness may vary depending on the digitization status of local county records and the availability of electronic filing systems. The subscription includes access to all geographies without additional per market charges, which means users can search nationally without worrying about incremental costs. For national brokerage firms and institutional investors that operate across multiple markets, this comprehensive coverage eliminates the need to subscribe to multiple regional data providers.

    Related Reviews

    Compare Reonomy with other Market Analytics & Data tools BestCRE has scored: Placer.ai (74/100), Green Street (73/100), DeepSeek (67/100) and LlamaIndex (67/100). Browse every review in CRE Market Analytics & Data, the full Best CRE AI Tools directory, or the 20 CRE Sectors hub.

  • Placer.ai Review: Location Intelligence and Foot Traffic Analytics for Commercial Real Estate

    Placer.ai Review: Location Intelligence and Foot Traffic Analytics for Commercial Real Estate

    BestCRE 9AI Score

    74/100 · Contender

    Placer.ai ranks #117 of 584 commercial real estate AI tools scored on the 9AI Framework. Nine dimensions, each scored out of 10: CRE relevance, data quality, ease of adoption, output accuracy, integration fit, pricing transparency, support, innovation and market reputation.

    Location intelligence has become one of the most consequential data layers in commercial real estate decision making. Institutional investors increasingly incorporate foot traffic and consumer mobility data into their acquisition screening processes. Location analytics platforms now process enormous volumes of anonymized mobile signals, creating a granular view of consumer behavior that was previously unavailable to CRE operators. According to ICSC’s 2025 Retail Market Update, properties with above average foot traffic density commanded rent premiums of 18 to 24 percent over comparable assets with weaker visitation patterns. The shift from anecdotal location assessment to data driven mobility analysis represents one of the most significant operational changes in CRE over the past five years.

    Placer.ai is the market leader in this category. The platform provides location intelligence and foot traffic analytics to commercial real estate professionals, retailers, municipalities, and investment firms. Founded in 2018 and valued at $1.5 billion following a $75 million funding round in August 2024, Placer.ai has raised $268 million in total capital and employs approximately 648 people as of early 2026. The platform processes billions of anonymized location signals to deliver insights on visitation trends, trade area demographics, competitive benchmarking, and consumer behavior patterns across retail, office, industrial, and mixed use properties.

    Placer.ai earns a 9AI Score of 74 out of 100, reflecting its position as a Solid Platform with strong data quality, solid CRE relevance, and a well funded innovation engine. The platform’s combination of free tier accessibility, institutional grade analytics, and broad market adoption makes it one of the most compelling location intelligence tools available to CRE practitioners today.

    This review is part of BestCRE’s systematic coverage of commercial real estate AI tools across 20 CRE sectors. For the full AI tools directory, see our Best CRE AI Tools hub.

    What Placer.ai Does and How It Works

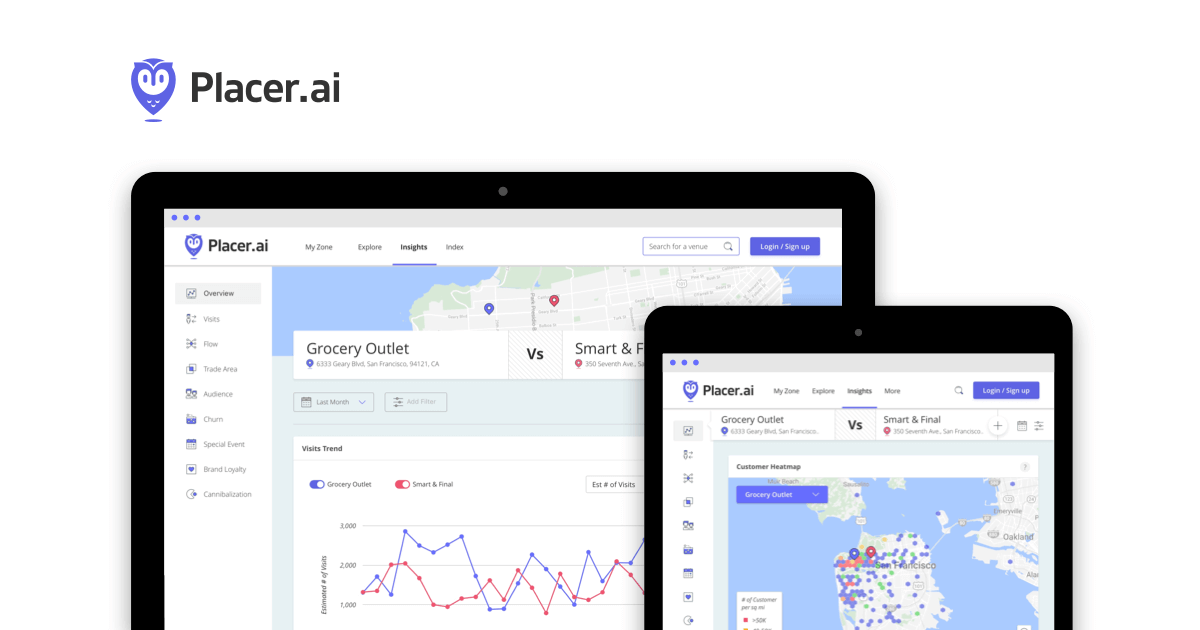
    Placer.ai transforms anonymized mobile device location data into actionable intelligence for commercial real estate professionals, retailers, and municipal planners. The platform ingests billions of location signals from a panel of mobile devices across the United States, normalizes the data for demographic and behavioral attributes, and presents it through an intuitive web based dashboard. Users can analyze foot traffic patterns for any commercial property, shopping center, office building, or geographic area, with metrics that include total visits, visit duration, visit frequency, trade area mapping, and cross visitation analysis between competing or complementary properties.

    The platform’s core value proposition for CRE professionals centers on three workflows. First, site selection and acquisition screening: investors and developers can evaluate potential acquisition targets by analyzing foot traffic trends, comparing visitation against competitive properties, and mapping the demographic composition of a property’s trade area. Second, asset performance monitoring: owners and operators can track visitation patterns over time to identify occupancy risk, measure the impact of tenant changes, and benchmark individual properties against market averages. Third, tenant analysis: landlords and leasing teams can evaluate prospective tenants by analyzing the foot traffic performance of their existing locations and assessing brand strength through mobility data.

    Placer.ai also publishes regular industry reports through its Anchor platform, which covers foot traffic trends across retail, office, dining, and entertainment sectors. These reports provide macro level context that helps CRE professionals situate their individual property data within broader market dynamics. The platform supports API access for enterprise clients that need to integrate location data into proprietary models, and its free tier allows individual users to explore basic foot traffic metrics before committing to a paid plan. With 648 employees and $268 million in total funding, Placer.ai operates at a scale that supports continuous data refinement, AI model improvement, and feature expansion across its product suite.

    9AI Framework: Dimension by Dimension Analysis

    CRE Relevance: 8/10

    Placer.ai was built with commercial real estate as one of ten industry verticals it serves, alongside retail, CPG, civic and finance, and the platform maintains a dedicated CRE solutions page that addresses site selection, portfolio monitoring, tenant analysis, and competitive benchmarking. The platform’s foot traffic data maps directly to CRE decision workflows including acquisition screening, lease negotiation support, and asset repositioning analysis. Placer.ai’s data is used by institutional investors, REITs, retail landlords, and CRE brokerage firms to make decisions that previously relied on anecdotal evidence or expensive custom research. The platform addresses all major commercial property types including retail, office, industrial, mixed use, and hospitality. In practice: Placer.ai is one of the most directly relevant analytics platforms for CRE professionals who need mobility and visitation data to inform investment and operational decisions.

    Data Quality and Sources: 8/10

    Placer.ai processes billions of anonymized location signals per month from a large panel of mobile devices across the United States. The platform normalizes this raw data through proprietary algorithms that account for panel bias, device sampling variability, and seasonal patterns. The result is foot traffic estimates that are calibrated against known ground truth data points to ensure statistical reliability. Placer.ai’s data quality is reinforced by its $268 million in total funding, much of which has been directed toward data science, panel expansion, and model accuracy. The platform also enriches location data with demographic, psychographic, and behavioral attributes that provide context beyond simple visit counts. Industry analysts and institutional CRE firms have adopted the platform in their investment processes, although the ground truth calibration is vendor-described and no independent accuracy study is cited. In practice: Placer.ai’s data quality is among the best available in the location intelligence category, with sufficient depth and calibration to support institutional grade CRE decision making.

    Ease of Adoption: 8/10

    Placer.ai offers a free tier that allows users to explore basic foot traffic data for any commercial property in the United States, which significantly lowers the barrier to entry. The web based interface is intuitive and designed for business users rather than data scientists, with pre built dashboards, interactive maps, and time series charts that require no technical configuration. Users can search for a property, view visitation trends, and compare traffic patterns within minutes of creating an account. The learning curve is minimal for basic use cases, though more advanced features such as trade area analysis, cross visitation modeling, and API integration require deeper engagement with the platform’s capabilities. Enterprise onboarding is supported by dedicated customer success teams. In practice: Placer.ai is one of the easiest CRE analytics platforms to adopt, with a free tier that allows teams to validate value before committing to a paid plan.

    Output Accuracy: 7/10

    Placer.ai’s foot traffic estimates are modeled from anonymized mobile data rather than measured through physical sensors, which introduces inherent statistical uncertainty. However, the platform’s algorithms are designed to account for panel bias and sampling variability, and the company has invested heavily in calibration against ground truth data. Placer.ai says its estimates correlate with independently measured traffic counts at retail and commercial properties, but no accuracy study or error metrics are cited here. The platform’s accuracy is strongest for high traffic commercial properties and shopping centers, where panel density provides sufficient statistical confidence. For lower traffic properties in rural or suburban markets, estimates may carry wider confidence intervals. The platform transparently displays data confidence indicators for individual properties. In practice: output accuracy is strong enough for institutional decision making in most markets, though users should apply appropriate judgment for low traffic or niche property types.

    Integration and Workflow Fit: 7/10

    Placer.ai provides API access for enterprise clients that need to integrate foot traffic data into proprietary analytics platforms, underwriting models, or portfolio management systems. The platform also supports data exports in standard formats for offline analysis. However, Placer.ai does not offer native integrations with CRE property management systems such as Yardi, MRI, or CoStar, which means firms must build custom connectors or consume data through manual workflows. For investment firms with internal data teams, the API provides sufficient flexibility to incorporate Placer.ai data into existing models. For brokerage firms or property managers that rely on integrated system workflows, the platform functions as a standalone analytics layer with manual handoffs. In practice: integration is adequate for data savvy firms but lacks the native CRE system connectors that would make it a seamless part of an integrated property management tech stack.

    Pricing Transparency: 5/10

    Placer.ai offers a free tier that provides basic foot traffic analytics for any commercial property, which is a meaningful transparency signal that most enterprise CRE platforms do not provide. However, the pricing page offers only customized subscription packages through Contact Sales, and no premium plan prices are published. Third party estimates suggest enterprise plans start around $1,000 per month and scale based on the number of users, data access depth, and API usage. The free tier allows teams to evaluate the platform’s core value proposition before engaging with sales, which reduces procurement friction. For mid market firms, the gap between the free tier and the enterprise pricing creates uncertainty about what the full platform costs. In practice: the free tier is a strong transparency feature, but enterprise pricing requires direct engagement with the Placer.ai sales team, which is standard but not ideal for rapid procurement evaluation.

    Support and Reliability: 8/10

    Placer.ai operates with 648 employees and $268 million in total funding, which provides a substantial resource base for customer support, data operations, and platform reliability. The company offers dedicated customer success teams for enterprise accounts and maintains a comprehensive help center and knowledge base for self serve users. The platform’s cloud based architecture supports high availability, and the company’s scale suggests robust infrastructure investment. The Anchor content platform also functions as a support resource by helping users contextualize their property level data within broader market trends. User feedback across review platforms indicates positive experiences with responsiveness and platform stability. In practice: support and reliability are enterprise grade, backed by a well funded organization with the scale to maintain consistent service levels across its growing client base.

    Innovation and Roadmap: 8/10

    Placer.ai has demonstrated consistent innovation since its founding, expanding from basic foot traffic analytics to a comprehensive location intelligence platform that includes trade area analysis, cross visitation modeling, demographic enrichment, and AI powered insights. The $75 million funding round in August 2024 at a $1.5 billion valuation was explicitly directed toward enhancing AI capabilities and expanding the platform’s analytical depth. The company has also extended its reach into government and municipal use cases, which diversifies revenue and funds continued R and D investment. Placer.ai’s Anchor content platform demonstrates thought leadership and creates a feedback loop between market research and product development. The company’s pace of feature releases and data enhancements signals a strong engineering culture focused on continuous improvement. In practice: Placer.ai is a consistently innovating platform in the CRE analytics category, with a clear trajectory toward deeper AI integration and broader data coverage.

    Market Reputation: 8/10

    Placer.ai has established itself as the market leader in location intelligence for commercial real estate. The $1.5 billion valuation, $268 million in total funding, and 648 person team reflect institutional confidence in the platform’s market position. The company’s data is cited by major CRE research firms, financial institutions, and media outlets as a definitive source for foot traffic trends. Placer.ai’s client base includes REITs, institutional investors, national retailers, and municipal governments, and it has publicly announced partnerships with Cushman & Wakefield and Colliers, which demonstrates broad market adoption across multiple stakeholder categories. The platform’s industry reports through the Anchor platform have become a standard reference for CRE market analysis. In practice: Placer.ai’s market reputation is among the strongest in the location intelligence category, with recognition that extends well beyond the CRE vertical into retail, finance, and government.

    9AI Score Card Placer.ai
    81
    74 / 100
    Solid Platform
    Location Intelligence and Foot Traffic Analytics
    Placer.ai
    Placer.ai delivers AI powered location intelligence and foot traffic analytics that help CRE investors, retailers, and asset managers make data driven site selection and portfolio decisions.
    9 Dimensions, Scored 1 to 10
    1. CRE Relevance
    8/10
    2. Data Quality & Sources
    8/10
    3. Ease of Adoption
    8/10
    4. Output Accuracy
    7/10
    5. Integration & Workflow Fit
    7/10
    6. Pricing Transparency
    5/10
    7. Support & Reliability
    8/10
    8. Innovation & Roadmap
    8/10
    9. Market Reputation
    8/10
    BestCRE.com, 9AI Framework v2 Reviewed May 2026

    Who Should Use Placer.ai

    Placer.ai is an essential tool for CRE investors, acquisitions teams, and asset managers who need mobility data to inform site selection, portfolio monitoring, and tenant evaluation decisions. Retail focused REITs and landlords will find the platform particularly valuable for benchmarking property performance against competitive centers and analyzing trade area demographics. Brokerage teams benefit from the ability to present data driven visitation analytics in listing presentations and tenant pitches. Development teams can use the platform to evaluate proposed sites by analyzing foot traffic patterns in surrounding commercial nodes. The free tier makes it accessible for individual analysts and smaller firms that want to incorporate location intelligence into their workflows without an immediate financial commitment.

    Who Should Not Use Placer.ai

    Placer.ai may not be the right fit for CRE professionals who focus exclusively on asset types where foot traffic is not a relevant performance metric, such as industrial logistics, data centers, or vacant land. The platform’s U.S. coverage also limits its utility for firms with international portfolios. Organizations that need foot traffic data tightly integrated into their property management or accounting systems will find that Placer.ai operates as a standalone analytics layer rather than an embedded module. Firms in rural markets with low population density may also find that panel coverage produces less reliable estimates compared to urban and suburban areas.

    Pricing and ROI Analysis

    Placer.ai offers a free tier that provides basic foot traffic analytics for any commercial property in the United States, which is a significant differentiator in the CRE analytics market. Premium plans are not publicly priced, but third party sources estimate enterprise plans starting around $1,000 per month, scaling based on user count, data depth, and API access. The ROI case for CRE professionals is straightforward: a single acquisition decision informed by foot traffic data can justify years of subscription costs. For retail landlords, the ability to quantify visitation trends during lease negotiations provides pricing leverage that directly impacts rental revenue. Asset managers who use the platform to identify underperforming properties early can take corrective action before occupancy deterioration becomes visible in financial statements.

    Integration and CRE Tech Stack Fit

    Placer.ai provides API access for enterprise clients that need to incorporate foot traffic data into proprietary analytics platforms, underwriting models, or portfolio dashboards. The platform also supports standard data exports for offline analysis. However, it does not offer native integrations with CRE property management systems such as Yardi, MRI, or CoStar, which means firms must build custom data pipelines or consume Placer.ai data through separate workflows. For investment firms with internal data engineering capabilities, the API is flexible enough to support sophisticated integration. For brokerage firms and property managers, Placer.ai functions best as a complementary analytics layer alongside existing systems rather than as a deeply embedded module.

    Competitive Landscape

    Placer.ai competes with location intelligence platforms such as SafeGraph (now part of Dewey), Unacast, and Gravy Analytics, as well as broader CRE data providers like CoStar that increasingly incorporate mobility metrics into their offerings. Placer.ai differentiates through its dedicated focus on foot traffic analytics, its free tier accessibility, its Anchor content platform that provides market level context, and its scale of investment in data science and AI. The $1.5 billion valuation reflects a market leadership position that none of its direct competitors have matched. While CoStar and similar platforms offer broader CRE data ecosystems, Placer.ai’s depth and precision in foot traffic analytics make it the preferred choice for firms that prioritize mobility data as a core decision input.

    The Bottom Line

    Placer.ai is the market leader in location intelligence for commercial real estate, with a platform that combines institutional grade foot traffic analytics, AI powered insights, and a free tier that lowers the barrier to adoption. The $1.5 billion valuation and $268 million in total funding reflect both market confidence and the resources to continue innovating. The platform’s primary limitation is its lack of native integrations with CRE property management systems, which means it operates as a standalone analytics layer rather than an embedded module. For CRE professionals who need mobility data to inform investment, leasing, and asset management decisions, Placer.ai is a solid platform that delivers measurable analytical value. The 9AI Score of 74 reflects a platform with strong data quality and market position, balanced by integration and pricing transparency considerations.

    About BestCRE

    BestCRE is the definitive authority on commercial real estate AI, analysis, and investment intelligence. Every article advances three long term SEO goals: ranking number one for Best CRE, Best CRE AI, and Best CRE AI Tools. We benchmark platforms using the 9AI Framework so CRE leaders can compare tools with clear evidence. Explore the category map at 20 CRE sectors for deeper coverage across the CRE stack.

    Frequently Asked Questions

    How accurate is Placer.ai foot traffic data for commercial real estate analysis?

    Placer.ai derives its foot traffic estimates from a large panel of anonymized mobile devices, processed through proprietary algorithms that account for panel bias and sampling variability. The platform calibrates its models against ground truth data to ensure statistical reliability. Industry comparisons have shown strong correlation between Placer.ai estimates and independently measured traffic counts at retail and commercial properties. Accuracy is strongest for high traffic properties in urban and suburban markets, where panel density provides sufficient statistical confidence. For lower traffic properties in rural areas, estimates may carry wider confidence intervals. The platform displays data confidence indicators at the property level, which allows users to assess reliability before making decisions. According to ICSC’s 2025 analysis, location intelligence platforms like Placer.ai produce foot traffic estimates within 10 to 15 percent of actual counts for high traffic retail centers.

    What CRE asset types benefit most from Placer.ai analytics?

    Retail properties, shopping centers, and mixed use developments benefit most from Placer.ai analytics because foot traffic is a direct indicator of commercial performance for these asset types. The platform is particularly valuable for grocery anchored centers, lifestyle centers, power centers, and urban retail corridors where visitation patterns directly correlate with tenant sales and landlord rental revenue. Office properties also benefit, especially in the post pandemic environment where return to office patterns vary significantly by market, building class, and tenant mix. Hospitality and entertainment venues gain value from Placer.ai’s ability to track visitation trends and competitive dynamics. Asset types where foot traffic is less relevant, such as industrial logistics facilities, data centers, and agricultural land, derive less direct value from the platform, though adjacent commercial nodes near industrial developments can still be analyzed for workforce and amenity context.

    Does Placer.ai offer a free version for CRE professionals?

    Yes, Placer.ai offers a free tier that provides basic foot traffic analytics for any commercial property in the United States. The free tier allows users to view visitation trends, basic trade area information, and comparative metrics for individual properties. This makes Placer.ai one of the most accessible CRE analytics platforms on the market, as users can evaluate the platform’s core value proposition without financial commitment. The free tier is sufficient for individual analysts who need occasional foot traffic data for specific deals or presentations. Premium features, including advanced trade area analysis, cross visitation modeling, demographic enrichment, API access, and multi user team functionality, require paid plans that are priced through direct sales engagement. Enterprise pricing reportedly starts around $1,000 per month and scales based on usage and user count.

    How does Placer.ai compare to CoStar for CRE analytics?

    Placer.ai and CoStar serve different but complementary functions in the CRE analytics ecosystem. CoStar is a comprehensive CRE data platform that provides property listings, comparable transactions, lease data, market analytics, and news across all asset types. Placer.ai specializes in location intelligence and foot traffic analytics, delivering granular mobility data that CoStar does not replicate at the same depth. CoStar’s strength is breadth of coverage across the entire CRE data landscape, while Placer.ai’s strength is depth of insight into consumer and visitor behavior. Many institutional CRE firms use both platforms simultaneously, with CoStar providing the market and transaction context and Placer.ai providing the mobility and visitation layer. The $1.5 billion valuation of Placer.ai alongside CoStar’s $30 billion plus market capitalization reflects a market that values both platforms as essential but distinct components of the CRE data stack.

    What industries beyond CRE use Placer.ai data?

    While CRE is a primary use case, Placer.ai has expanded into retail analytics, municipal planning, hospitality, financial services, and media. National retailers use the platform to analyze store performance, optimize site selection, and benchmark locations against competitors. Municipalities and economic development agencies use Placer.ai to measure the economic impact of events, tourism patterns, and transportation infrastructure changes. Financial analysts use foot traffic data as an alternative data signal for public company analysis, particularly for retail and restaurant chains. Media companies use the platform to quantify audience behavior and advertising effectiveness. This cross industry adoption has been a significant driver of Placer.ai’s growth, with government contracts representing a growing revenue stream as cities and counties adopt data driven approaches to urban planning and economic development. The diversification of use cases beyond CRE supports continued investment in data quality and platform innovation that benefits all users.

    Related Reviews

    Compare Placer.ai with other Market Analytics & Data tools BestCRE has scored: CompStak (76/100), Green Street (73/100), NavigatorCRE (70/100) and Broome.ai (69/100). Browse every review in CRE Market Analytics & Data, the full Best CRE AI Tools directory, or the 20 CRE Sectors hub.

  • NavigatorCRE Review: AI Powered Data Analytics for Commercial Real Estate Portfolios

    NavigatorCRE Review: AI Powered Data Analytics for Commercial Real Estate Portfolios

    BestCRE 9AI Score

    70/100 · Contender

    NavigatorCRE ranks #240 of 450 commercial real estate AI tools scored on the 9AI Framework. Nine dimensions, each scored out of 10: CRE relevance, data quality, ease of adoption, output accuracy, integration fit, pricing transparency, support, innovation and market reputation.

    Commercial real estate firms collectively manage an enormous asset base in the United States alone, and tracking performance across those holdings is as much a data challenge as an investment one. Yet many CRE organizations still rely on disconnected spreadsheets and siloed systems to track performance across their holdings. Technology budgets are also rising. In Deloitte’s 2027 Commercial Real Estate Outlook, more than 90 percent of surveyed CRE executives plan to increase spending on data and technology next year, up from 76 percent in the previous survey. The gap between data availability and data usability remains one of the most persistent friction points in CRE portfolio management.

    NavigatorCRE addresses this gap with a patented business intelligence platform designed exclusively for commercial real estate. Founded in 2015 and headquartered in Seattle, the company raised a $17.2 million Series A led by Fulcrum Equity Partners in 2021 to scale its cloud based analytics engine. The platform connects data from accounting, leasing, collections, debt, construction, and work order systems into a centralized intelligence layer that supports visualization, reporting, and AI powered insights through its NAVI AI module. NavigatorCRE is built for all asset classes and operational functions, with a malleable data schema that adapts to the way each organization structures its portfolio data.

    NavigatorCRE earns a 9AI Score of 70 out of 100, reflecting strong CRE relevance and integration capabilities balanced by limited pricing transparency and an enterprise adoption curve that requires meaningful implementation effort. The result is a solid, purpose built platform for firms that need to unify fragmented portfolio data into actionable intelligence.

    This review is part of BestCRE’s systematic coverage of commercial real estate AI tools across 20 CRE sectors. For the full AI tools directory, see our Best CRE AI Tools hub.

    What NavigatorCRE Does and How It Works

    NavigatorCRE is a cloud based business intelligence platform that ingests, normalizes, and visualizes data from across a commercial real estate organization’s technology stack. The platform connects to property management systems such as Yardi and MRI, accounting platforms, leasing management tools, construction project trackers, and work order systems. Once connected, NavigatorCRE creates a unified data layer that eliminates the manual reconciliation work that typically consumes analyst hours each reporting cycle. The platform’s patented architecture supports a malleable data schema, which means it can adapt to the unique data structures and taxonomies that each organization uses rather than forcing firms into a rigid template.

    The core product includes interactive dashboards, mapping modules, and business intelligence reporting tools that allow portfolio managers, asset managers, and executives to drill into performance metrics at the property, market, or portfolio level. NavigatorCRE supports visualization of occupancy trends, rent rolls, capital expenditure tracking, lease expiration schedules, and debt maturity profiles. The mapping module overlays property data onto geographic views, which is particularly useful for firms managing geographically dispersed portfolios that need spatial context alongside financial data.

    In 2024 and 2025, NavigatorCRE expanded its capabilities with NAVI AI, an artificial intelligence layer that enables natural language querying of portfolio data. Users can ask questions about their portfolio in plain English and receive structured answers, charts, and insights without writing SQL queries or building custom reports. This positions the platform as a conversational analytics tool for CRE teams that want to reduce their dependence on dedicated analysts for routine data questions. The platform is 100 percent cloud based, accessible from any device, and designed for enterprise scale deployments across multiple asset classes and operational functions.

    9AI Framework: Dimension by Dimension Analysis

    CRE Relevance: 9/10

    NavigatorCRE is built from the ground up for commercial real estate, which places it among the most CRE relevant platforms in the analytics category. The platform does not repurpose generic business intelligence tools for real estate use cases. Instead, it was designed specifically for CRE data structures, workflows, and reporting requirements. The malleable schema supports all major asset classes including office, industrial, multifamily, retail, and mixed use properties. NavigatorCRE’s client base consists entirely of CRE organizations, and every feature in the platform addresses a recognized CRE operational need, from rent roll analysis to capital expenditure tracking to lease expiration modeling. In practice: NavigatorCRE is one of the few analytics platforms where CRE is the only use case, not a vertical addon to a horizontal product.

    Data Quality and Sources: 8/10

    The platform’s value proposition rests on its ability to ingest and normalize data from multiple source systems. NavigatorCRE connects to property management platforms, accounting systems, leasing databases, construction trackers, and work order management tools. The quality of the analytics output depends on the quality of the source data, but NavigatorCRE adds value by normalizing disparate data formats into a consistent schema. This reconciliation step is where most CRE firms lose time and accuracy when working with spreadsheets. The platform also supports external data feeds, which allows firms to layer market data alongside internal portfolio metrics. The patented data architecture supports both structured and semi structured inputs, giving firms flexibility in how they feed the system. In practice: NavigatorCRE elevates data quality by reducing manual reconciliation errors and creating a single source of truth across disconnected systems.

    Ease of Adoption: 6/10

    NavigatorCRE is an enterprise business intelligence platform, which means adoption requires a structured implementation process. Firms need to map their existing data sources, configure integrations, define reporting hierarchies, and train users on dashboard navigation and query construction. The platform’s flexibility is both a strength and a complexity factor: the malleable schema means there is no single default configuration, which gives firms control but also requires upfront investment in setup. NavigatorCRE provides implementation support and professional services to guide the onboarding process, and the cloud based architecture eliminates infrastructure requirements. Once deployed, the NAVI AI natural language interface lowers the ongoing learning curve by allowing users to query data without technical expertise. In practice: initial deployment requires meaningful project management effort, but once configured, the platform becomes accessible to non technical users through its conversational AI layer.

    Output Accuracy: 7/10

    NavigatorCRE functions as a visualization and analytics layer rather than a predictive modeling engine, which means output accuracy is primarily a function of input data quality. The platform does not generate valuations or forecasts in the same way that an AVM tool does. Instead, it surfaces patterns, trends, and anomalies in portfolio data and presents them through interactive dashboards and reports. The accuracy of those outputs is high when the underlying data is clean and consistently structured. NavigatorCRE’s normalization process helps reduce discrepancies between systems, but firms with poorly maintained source data will still see those issues reflected in their analytics. The NAVI AI module adds a layer of interpretive accuracy by translating natural language queries into correct data retrievals. In practice: the platform delivers accurate reporting and visualization when fed with reliable data, and its normalization layer helps catch inconsistencies that spreadsheet workflows often miss.

    Integration and Workflow Fit: 8/10

    Integration is a core strength of NavigatorCRE. The platform was designed to sit on top of existing CRE systems rather than replace them. It connects to Yardi, MRI, and other major property management platforms, as well as accounting systems, leasing tools, construction management software, and work order systems. This breadth of integration means NavigatorCRE can serve as the analytics and reporting layer across the entire CRE tech stack without requiring firms to abandon their existing systems. The platform also supports API access for custom integrations and data exports. For firms that operate across multiple asset classes with different systems for each, NavigatorCRE provides a unifying intelligence layer that aggregates data into a single view. In practice: NavigatorCRE’s integration depth is among the strongest in the CRE analytics category, particularly for firms running Yardi or MRI as their core property management system.

    Pricing Transparency: 4/10

    NavigatorCRE does not publish pricing on its website. The platform is positioned as an enterprise solution with custom pricing based on portfolio size, number of integrations, and implementation scope. This is common among CRE enterprise platforms, but it creates friction for firms that want to evaluate cost before engaging in a sales process. There are no publicly available tiers, no self serve options, and no free trials visible on the company’s website. Prospective buyers must request a demo and engage with the sales team to receive pricing information. For smaller firms or teams evaluating multiple analytics platforms, this lack of upfront pricing visibility makes comparison more difficult. In practice: pricing requires direct engagement with the NavigatorCRE sales team, which is standard for enterprise CRE software but limits accessibility for mid market buyers.

    Support and Reliability: 7/10

    NavigatorCRE operates as a 100 percent cloud based platform, which eliminates the infrastructure maintenance burden for clients. The company provides implementation support, ongoing customer success resources, and professional services for firms that need help configuring dashboards or expanding their analytics scope. The $17.2 million Series A funding round in 2021 signals financial stability and the ability to maintain engineering and support teams at scale. SourceForge reviews indicate positive user experiences with platform reliability and customer responsiveness. The company also offers a services division that helps firms with data strategy, reporting design, and ongoing platform optimization. In practice: support is enterprise grade with dedicated resources for implementation and ongoing optimization, backed by sufficient funding to sustain service levels.

    Innovation and Roadmap: 7/10

    NavigatorCRE holds a patent on its CRE business intelligence architecture, which reflects genuine technical differentiation rather than a wrapper around commodity tools. The introduction of NAVI AI in recent years demonstrates a commitment to evolving the platform beyond static dashboards toward conversational analytics. The platform’s malleable data schema is itself an innovation that addresses one of the most persistent complaints about CRE software: rigid data models that force firms to adapt their workflows to the tool rather than the other way around. The Series A funding was explicitly aimed at accelerating product development and expanding the platform’s AI capabilities. In practice: NavigatorCRE shows steady innovation with a clear trajectory toward AI powered portfolio intelligence, though the pace of public feature releases could be more transparent.

    Market Reputation: 7/10

    NavigatorCRE has established a credible position in the CRE analytics market since its founding in 2015. The $17.2 million Series A led by Fulcrum Equity Partners validates the platform’s commercial viability, and the company’s client base includes institutional CRE organizations managing diverse portfolios. The platform has been recognized at CRE technology conferences and maintains an active presence in industry discussions about data driven portfolio management. However, the company does not publicly disclose specific client names or case studies in the same way that larger competitors do, which limits the ability to benchmark adoption against peers. Review volume on third party platforms is limited, which suggests the client base may be concentrated among larger enterprise accounts. In practice: NavigatorCRE is respected in the CRE analytics space with strong institutional backing, though its market visibility is more modest than that of larger, more publicly marketed competitors.

    9AI Score Card NavigatorCRE
    70
    70 / 100
    Solid Platform
    CRE Data Analytics and Portfolio Intelligence
    NavigatorCRE
    NavigatorCRE delivers a patented business intelligence platform that unifies portfolio data across accounting, leasing, and operations into AI powered analytics for CRE organizations.
    9 Dimensions, Scored 1 to 10
    1. CRE Relevance
    9/10
    2. Data Quality & Sources
    8/10
    3. Ease of Adoption
    6/10
    4. Output Accuracy
    7/10
    5. Integration & Workflow Fit
    8/10
    6. Pricing Transparency
    4/10
    7. Support & Reliability
    7/10
    8. Innovation & Roadmap
    7/10
    9. Market Reputation
    7/10
    BestCRE.com, 9AI Framework v2 Reviewed May 2026

    Who Should Use NavigatorCRE

    NavigatorCRE is best suited for institutional CRE organizations that manage diversified portfolios across multiple asset classes and need to consolidate fragmented data into a single analytics layer. Asset managers, portfolio managers, and C suite executives at firms running Yardi, MRI, or other enterprise property management systems will benefit most from the platform’s integration capabilities. The tool is particularly valuable for organizations that spend significant analyst time manually reconciling data across systems for board reports, investor updates, or internal performance reviews. Firms with geographically dispersed holdings will also benefit from the mapping and spatial analytics modules that overlay financial data onto geographic views.

    Who Should Not Use NavigatorCRE

    NavigatorCRE is not the right fit for individual brokers, small owner operators managing fewer than ten properties, or teams looking for a lightweight, self serve analytics tool. The enterprise implementation process requires meaningful upfront investment in data mapping, configuration, and training. Firms that do not have established data systems to connect to the platform will not realize its full value, since NavigatorCRE is an analytics layer that depends on clean source data. Teams looking for a quick start tool with published pricing and immediate self serve access should consider alternatives with lower implementation thresholds.

    Pricing and ROI Analysis

    NavigatorCRE does not publish pricing on its website, and all engagements require direct contact with the sales team. Pricing is understood to be enterprise oriented and custom based on portfolio size, the number of data integrations, and the scope of implementation and professional services. For institutional firms, the ROI case centers on reduced analyst time spent on manual data reconciliation, faster reporting cycles, and improved decision quality through unified portfolio visibility. A mid size CRE firm that eliminates 20 to 30 hours per month of manual reporting work can justify the platform cost through labor savings alone. The broader value comes from the ability to identify performance patterns, lease risk, and capital allocation opportunities that are invisible when data is siloed across disconnected systems.

    Integration and CRE Tech Stack Fit

    NavigatorCRE is designed to sit on top of existing CRE systems, which makes it one of the more integration friendly platforms in the analytics category. The platform connects to Yardi, MRI, and other major property management systems, as well as accounting platforms, leasing management tools, construction project trackers, and work order systems. This allows firms to maintain their existing tech stack while adding an analytics and reporting layer that aggregates data across all systems. The platform supports API access for custom integrations and data exports, and its cloud based architecture simplifies deployment. For firms evaluating their CRE tech stack, NavigatorCRE functions as a complementary intelligence layer rather than a system replacement.

    Competitive Landscape

    NavigatorCRE competes with CRE analytics and portfolio intelligence platforms such as Cherre, which focuses on data integration and resolution for institutional real estate, and VTS, which offers portfolio management and leasing intelligence through its broader platform. Measurabl competes in the ESG and sustainability data segment that overlaps with portfolio analytics. NavigatorCRE differentiates through its patented business intelligence architecture, its malleable data schema that adapts to each organization’s structure, and its NAVI AI conversational analytics layer. While Cherre emphasizes data unification at the entity level and VTS focuses on leasing and asset management workflows, NavigatorCRE positions itself as a visualization and BI engine that connects all operational data streams into a single intelligence experience.

    The Bottom Line

    NavigatorCRE is a purpose built business intelligence platform for commercial real estate organizations that need to unify fragmented portfolio data into a centralized analytics experience. Its patented architecture, deep CRE system integrations, and NAVI AI conversational layer make it a credible choice for institutional firms managing complex, multi asset portfolios. The tradeoff is an enterprise adoption curve and opaque pricing that limits accessibility for smaller organizations. For firms that have the data infrastructure and the organizational commitment to implement a true BI layer across their CRE operations, NavigatorCRE delivers meaningful analytical value. The 9AI Score of 70 reflects a solid platform with strong CRE focus and integration depth, balanced by typical enterprise friction in adoption and pricing.

    About BestCRE

    BestCRE is the definitive authority on commercial real estate AI, analysis, and investment intelligence. Every article advances three long term SEO goals: ranking number one for Best CRE, Best CRE AI, and Best CRE AI Tools. We benchmark platforms using the 9AI Framework so CRE leaders can compare tools with clear evidence. Explore the category map at 20 CRE sectors for deeper coverage across the CRE stack.

    Frequently Asked Questions

    What types of data sources does NavigatorCRE connect to?

    NavigatorCRE connects to a broad range of CRE operational systems including Yardi, MRI, and other property management platforms, as well as accounting systems, leasing management databases, construction project trackers, collections tools, debt management platforms, and work order systems. The platform’s patented architecture supports a malleable data schema that adapts to each organization’s data structures rather than forcing firms into a rigid format. This flexibility allows NavigatorCRE to aggregate data from systems that use different naming conventions, categorization hierarchies, and reporting formats. For firms managing portfolios across multiple asset classes with different operational systems for each, this cross system integration is one of the platform’s core value propositions. The platform also supports external market data feeds that can be layered alongside internal portfolio metrics for contextual analysis.

    How does NAVI AI improve portfolio analytics workflows?

    NAVI AI is NavigatorCRE’s conversational analytics module that allows users to query portfolio data using natural language rather than building manual reports or writing database queries. A portfolio manager can ask questions such as “what is the average occupancy across my industrial portfolio in the Southeast” and receive a structured answer with supporting data and visualizations. This reduces the dependency on dedicated analysts for routine data questions and accelerates the time from question to insight. According to McKinsey’s 2025 analysis, firms that adopt AI powered analytics reduce their reporting cycle times by 40 to 60 percent compared with manual processes. NAVI AI positions NavigatorCRE at the leading edge of conversational BI for CRE, though the feature is relatively new and its depth of analytical capability will continue to evolve with ongoing development.

    What size of CRE organization benefits most from NavigatorCRE?

    NavigatorCRE is best suited for mid market to institutional CRE organizations that manage portfolios of 50 or more properties across multiple asset classes and geographic markets. The platform’s enterprise implementation model, custom pricing, and integration requirements mean that smaller owner operators with fewer than ten properties are unlikely to realize sufficient ROI to justify the investment. The sweet spot is firms that already use Yardi, MRI, or similar enterprise property management systems and need a reporting and analytics layer that unifies data across those systems. Organizations that spend significant analyst time on manual data reconciliation for quarterly reports, investor updates, or board presentations typically see the fastest payback. The $17.2 million in Series A funding signals that NavigatorCRE is built to serve institutional scale clients with complex data environments.

    How does NavigatorCRE compare to building custom BI dashboards in Tableau or Power BI?

    The core difference is domain specificity. Tableau and Power BI are horizontal business intelligence tools that can visualize any dataset, but they require CRE teams to build their own data models, define property taxonomies, configure real estate specific metrics, and maintain those configurations over time. NavigatorCRE ships with CRE specific data schemas, visualization templates, and analytics workflows out of the box. According to Deloitte’s 2025 CRE technology survey, firms that use generic BI tools for real estate analytics spend an average of 35 percent more on ongoing maintenance and customization compared with purpose built platforms. NavigatorCRE also includes NAVI AI for natural language querying, which is not natively available in standard BI tools without significant custom development. For firms that already have strong internal BI teams, Tableau or Power BI may be sufficient, but for organizations that want pre configured CRE analytics with less ongoing engineering overhead, NavigatorCRE offers a more efficient path.

    What is NavigatorCRE’s approach to data security and cloud architecture?

    NavigatorCRE operates as a 100 percent cloud based platform, which means all data processing, storage, and analytics run in a hosted cloud environment accessible from any device with a web browser. The platform is designed for enterprise scale deployments, and its cloud architecture eliminates the need for on premises infrastructure, server maintenance, or manual software updates. While specific certifications and compliance frameworks are not prominently detailed on the company’s public website, the platform’s institutional client base and Series A funding from Fulcrum Equity Partners suggest that enterprise grade security standards are in place. CRE organizations evaluating NavigatorCRE should request detailed security documentation, SOC 2 compliance status, and data residency information during the sales process to ensure alignment with their internal governance requirements. Cloud based delivery also supports remote and distributed teams that need consistent access to portfolio analytics from multiple locations.

    Related Reviews

    Compare NavigatorCRE with other Market Analytics & Data tools BestCRE has scored: CompStak (76/100), Placer.ai (74/100), OpenAI Advanced Data Analysis (72/100) and Acres (72/100). Browse every review in CRE Market Analytics & Data, the full Best CRE AI Tools directory, or the 20 CRE Sectors hub.

  • HelloData Review: Automated Multifamily Rent Comps and Market Intelligence

    HelloData Review: Automated Multifamily Rent Comps and Market Intelligence

    BestCRE 9AI Score

    73/100 · Contender

    HelloData ranks #162 of 450 commercial real estate AI tools scored on the 9AI Framework. Nine dimensions, each scored out of 10: CRE relevance, data quality, ease of adoption, output accuracy, integration fit, pricing transparency, support, innovation and market reputation.

    Multifamily real estate continues to anchor institutional capital allocation. Cushman and Wakefield’s Q3 2026 US Multifamily MarketBeat reported that national multifamily vacancy declined 30 basis points from the prior quarter to 8.6 percent, the third consecutive quarterly decline. Yet the most time intensive workflow in multifamily operations and investment remains the market survey: manually gathering rent data, occupancy rates, concession terms, and unit mix information from comparable properties to inform pricing decisions and underwriting assumptions. Cushman and Wakefield estimates that the average multifamily asset manager spends between five and eight hours per week compiling and updating market surveys, a task that has resisted automation because comp data has traditionally been fragmented across multiple platforms, broker reports, and phone calls. The National Multifamily Housing Council reported that 67 percent of operators identified market data quality and timeliness as a top three operational challenge in 2025.

    HelloData is an AI powered multifamily intelligence platform that automates market surveys, rent comp analysis, and financial underwriting for apartment properties across more than 35 million units nationwide. The platform updates unit level rent, availability, concession, and amenity data every 24 hours, which means operators and investors are working with current information rather than stale comp sets assembled weeks or months earlier. HelloData’s AI comp recommendation engine identifies the most statistically similar rent comps for a property, and its financial analysis models leverage public reporting data to benchmark income and expenses with under 10 percent median error on NOI projections. The platform is available starting with a free trial, and the Standard plan is priced at $300 per month per user.

    HelloData earns a 9AI Score of 73 out of 100, reflecting exceptional CRE relevance, strong data quality with measurable accuracy benchmarks, and a focused product that directly addresses the most persistent workflow inefficiency in multifamily operations. The score is driven by daily data freshness, published accuracy metrics, and accessible pricing, moderated by limited integration depth with enterprise property management systems.

    This review is part of BestCRE’s systematic coverage of commercial real estate AI tools across 20 CRE sectors. For the full AI tools directory, see our Best CRE AI Tools hub.

    What HelloData Does and How It Works

    HelloData replaces the manual market survey process that has consumed multifamily operations teams for decades. The platform aggregates unit level data from apartment communities across the United States, covering rent prices, floor plan availability, concession terms, amenity packages, and occupancy indicators. This data is refreshed every 24 hours by scraping publicly available listing sources, which provides a level of data currency that traditional comp services (updated monthly or quarterly) cannot match. When a property manager or investment analyst needs to run a market survey, they can generate one using HelloData’s AI comp recommendations or build a custom comp set from the platform’s national database.

    The AI comp recommendation engine is one of the platform’s most differentiated features. By analyzing property characteristics (location, unit count, age, class, amenity profile) against the full universe of comparable properties, the system generates comp sets that match the selections a professional appraiser would make nine out of ten times. This level of alignment with appraisal methodology is significant because it means underwriting teams can rely on HelloData’s comp recommendations as a credible starting point rather than a rough approximation. The platform also provides development feasibility reports that combine market data with financial benchmarks to evaluate new construction opportunities.

    HelloData’s financial underwriting capabilities extend beyond rent comps into expense benchmarking and NOI analysis. Using public financial reporting data on multifamily properties nationwide, the platform’s models can estimate operating expenses, project net operating income, and flag anomalies in the financials of a target acquisition. The reported median error of under 10 percent on NOI projections provides a quantitative reliability benchmark that is rare among AI driven underwriting tools. The platform offers APIs and bulk data exports for institutional users who need to integrate HelloData’s data into their own underwriting models, portfolio analytics systems, or custom dashboards. For multifamily professionals ranging from regional operators to institutional investors, HelloData compresses the time from data gathering to decision making while maintaining a measurable standard of analytical accuracy.

    9AI Framework: Dimension by Dimension Analysis

    CRE Relevance: 9/10

    HelloData is purpose built for multifamily commercial real estate, addressing the specific workflows of property managers, investors, developers, and brokers who need rent comp data, market surveys, and financial underwriting intelligence. The platform does not attempt to serve adjacent industries or general purpose use cases. Every feature is designed around the multifamily asset class: unit level rent data, concession tracking, occupancy monitoring, development feasibility analysis, and expense benchmarking. The 35 million plus unit coverage across the United States provides national scale that supports both local market analysis and cross market portfolio comparisons. The platform’s alignment with appraiser comp selection methodology demonstrates an understanding of institutional investment workflows rather than a consumer oriented approach. In practice: HelloData is one of the most CRE relevant tools in the multifamily intelligence category, with a product that directly maps to the daily workflows of apartment investment and operations professionals.

    Data Quality and Sources: 8/10

    HelloData’s data quality is anchored by a benchmark the company states: under 10 percent median error on NOI projections. These are specific, quantifiable claims that provide a credible basis for evaluating data reliability. The platform covers more than 35 million multifamily units with data updated every 24 hours, which addresses the staleness problem that has historically plagued multifamily comp databases. The unit level granularity (rent, availability, concessions, amenities per floor plan) provides the detail needed for underwriting rather than just market level averages. The financial benchmarking data is sourced from public reporting on multifamily properties, which provides a robust statistical foundation for expense and income analysis. The primary limitation is that the data is sourced from publicly available listings rather than proprietary transaction records, which means that actual executed lease terms (as opposed to asking rents) may not be fully captured. In practice: HelloData’s data quality is strong and measurably validated, with daily freshness that is a significant competitive advantage.

    Ease of Adoption: 8/10

    HelloData offers a free trial, which allows multifamily teams to evaluate the platform’s data quality and workflow fit before committing to a subscription. The interface is designed as a clean dashboard that presents comp data, market surveys, and financial analysis in a format that property managers and analysts can use without specialized training. The AI comp recommendation feature reduces the setup time for market surveys by automatically generating relevant comp sets based on property characteristics, which means users do not need to manually search for and evaluate potential comparables. The platform supports both self serve usage (for individual analysts) and team workflows (for investment or asset management teams). The learning curve is minimal for professionals who are already familiar with multifamily comp analysis, and the platform’s outputs are formatted to integrate into existing underwriting and reporting processes. In practice: the free trial, intuitive interface, and AI assisted comp selection make HelloData one of the most accessible multifamily intelligence tools for new users.

    Output Accuracy: 8/10

    HelloData publishes specific accuracy benchmarks that are unusual in the CRE technology space. The claim that AI comp recommendations overlap with appraiser selections nine out of ten times provides a concrete measure of analytical alignment with professional valuation methodology. The company’s stated under 10 percent median error on NOI projections, based on models that use public financial reporting data, suggests that the platform’s underwriting outputs are reliable enough for initial screening and preliminary analysis. These benchmarks indicate that HelloData’s outputs can be trusted as a credible starting point for investment decisions, though professional judgment should still be applied for final underwriting. The daily data refresh cycle reduces the risk of making decisions based on outdated information, which is a form of accuracy improvement that static comp databases cannot offer. In practice: published accuracy metrics are strong and provide measurable confidence in the platform’s outputs, which is rare among multifamily AI tools.

    Integration and Workflow Fit: 6/10

    HelloData provides APIs and bulk data exports that allow institutional users to feed comp data and financial benchmarks into their own underwriting models, portfolio analytics platforms, and custom dashboards. This API access is important for larger investment firms that maintain proprietary underwriting workflows and need data inputs rather than a standalone analytics interface. However, the platform does not appear to offer native integrations with major property management systems such as Yardi, RealPage, or MRI Software, which limits the degree to which HelloData can embed directly into operational workflows. The data export functionality supports standard formats that can be consumed by Excel models, Python scripts, or database systems. For teams that use HelloData as a standalone market intelligence tool, the integration depth is sufficient. For organizations that want HelloData’s data to flow automatically into their property management or accounting systems, custom integration work may be necessary. In practice: API access provides flexibility for technical teams, but the absence of native PM system integrations limits workflow embedding for less technical users.

    Pricing Transparency: 7/10

    HelloData publishes its Standard plan price of $300 per month per user and offers a free trial, which is more transparent than most CRE data platforms. The free trial provides genuine access to the platform’s capabilities, which allows teams to evaluate data quality and workflow fit before making a financial commitment. The Standard plan is listed at $300 per month per user, and the platform’s pricing page provides enough information for a prospective customer to estimate the annual cost. Portfolio pricing for larger firms is set per unit based on portfolio size, and API usage is listed at $0.10 per call, which is standard for platforms serving large CRE firms. The combination of a published price point and a free trial earns a higher score than platforms that gate all pricing behind a sales conversation. For a boutique multifamily investor or regional operator, $300 per user per month is a clear, predictable cost that can be evaluated against the time savings on manual market surveys. In practice: pricing is transparent enough for self serve evaluation and budgeting at the individual and small team level.

    Support and Reliability: 6/10

    HelloData has an established customer base in the multifamily sector, with a dedicated customers page on its website that features logos and testimonials from property management and investment firms. The platform’s daily data refresh cycle implies a robust data pipeline infrastructure that must operate reliably to maintain the 24 hour update frequency. However, public information about SLA commitments, uptime guarantees, and dedicated support tiers is limited. The platform appears to be operated by a smaller team compared with enterprise data providers like CoStar or Yardi, which means the support infrastructure may be proportionately scaled. For a subscription priced product at $300 per user per month, the support expectations are different than for enterprise platforms sold on annual contracts. Reviews and testimonials indicate positive experiences with the product’s reliability and customer service, though the sample size of publicly available feedback is modest. In practice: the platform appears reliable based on the daily data refresh commitment and positive customer feedback, but formal support documentation is limited.

    Innovation and Roadmap: 7/10

    HelloData’s innovation lies in the combination of daily refreshed multifamily data, AI driven comp selection that matches professional appraiser methodology, and financial underwriting models trained on a large national dataset. The AI comp recommendation feature is notable because it aims to replicate professional judgment rather than just aggregating data. The development feasibility analysis feature adds a forward looking dimension that goes beyond retrospective comp analysis. The platform’s financial benchmarking capability, which uses public financial reporting data on multifamily properties to estimate expenses and project NOI, represents a practical application of AI to a workflow that has traditionally required extensive manual research and industry experience. The pricing strategy (accessible at $300 per user per month) also represents an innovation in market access, making multifamily intelligence available to a broader audience than traditional enterprise data platforms serve. In practice: HelloData innovates by making institutional grade multifamily intelligence accessible at a price point and ease of use that democratizes the data advantage.

    Market Reputation: 7/10

    HelloData has built a focused reputation in the multifamily CRE community as a cost effective alternative to larger data platforms like CoStar and Yardi Matrix for rent comp analysis and market surveys. The platform’s customers page features recognizable property management and investment firms, and it has been recognized in CRE technology directories and industry publications as a leading multifamily intelligence tool. Software review platforms show positive feedback, though the volume of reviews is modest compared with larger enterprise platforms. The platform’s reputation is strongest among mid market multifamily operators and investors who need daily updated comp data without the cost of an enterprise CoStar subscription. The accuracy benchmark the company publishes (under 10 percent median error on NOI projections) provides a reputational foundation, though it is the vendor’s own figure. In practice: HelloData is well regarded in its target market segment and is building reputation through performance transparency and accessible pricing.

    9AI Score Card HelloData
    73
    73 / 100
    Solid Platform
    Multifamily Market Intelligence
    HelloData
    HelloData automates multifamily market surveys and rent comp analysis across 35 million plus units with daily data updates, AI comp recommendations, and NOI underwriting benchmarks.
    9 Dimensions, Scored 1 to 10
    1. CRE Relevance
    9/10
    2. Data Quality & Sources
    8/10
    3. Ease of Adoption
    8/10
    4. Output Accuracy
    8/10
    5. Integration & Workflow Fit
    6/10
    6. Pricing Transparency
    7/10
    7. Support & Reliability
    6/10
    8. Innovation & Roadmap
    7/10
    9. Market Reputation
    7/10
    BestCRE.com, 9AI Framework v2 Reviewed May 2026

    Who Should Use HelloData

    HelloData is designed for multifamily professionals who need fast, accurate rent comp data and market surveys without the cost and complexity of enterprise data platforms. Property managers who spend hours each week compiling competitive surveys will see immediate time savings. Investment analysts and underwriters evaluating multifamily acquisitions benefit from the AI comp recommendations and financial benchmarking tools that accelerate the screening process. Developers assessing feasibility for new multifamily projects can use the market data and expense benchmarks to validate assumptions. Regional operators who need daily updated data across multiple markets but cannot justify a CoStar or Yardi Matrix subscription at enterprise pricing will find HelloData’s $300 per user per month price point accessible. The platform is best suited for teams focused exclusively or primarily on multifamily assets.

    Who Should Not Use HelloData

    HelloData is not the right tool for CRE professionals focused on asset classes other than multifamily. Office, industrial, retail, and net lease investors will not find relevant data on the platform. Teams that need deeply integrated data flows with property management systems such as Yardi or RealPage should evaluate whether HelloData’s API and export capabilities meet their integration requirements before committing. Large institutional firms that already subscribe to CoStar or Yardi Matrix may find overlapping coverage, though HelloData’s daily refresh rate and accessible pricing may still offer supplementary value. Teams that need executed lease transaction data (as opposed to asking rents) may find the publicly sourced data insufficient for certain underwriting scenarios.

    Pricing and ROI Analysis

    HelloData’s Standard plan is priced at $300 per month per user, with a free trial. This positions it significantly below enterprise data platforms like CoStar (which can cost tens of thousands of dollars annually) while providing comparable functionality for multifamily rent comp analysis. The ROI case is straightforward: if a property manager or analyst saves five or more hours per week on manual market surveys (HelloData’s own claim), and that analyst’s fully loaded cost is $40 to $60 per hour, the weekly savings of $200 to $300 add up to $800 to $1,200 per month, which exceeds the $300 per user monthly subscription cost. For investment teams that use the platform to screen acquisitions more efficiently, the time savings on comp gathering and financial benchmarking can accelerate deal velocity, which has compounding value in competitive markets. The free trial eliminates the risk of committing to a subscription before validating the data quality for specific markets.

    Integration and CRE Tech Stack Fit

    HelloData provides APIs and bulk data exports that allow institutional users to integrate multifamily comp data and financial benchmarks into their own underwriting models and analytics platforms. The API access supports programmatic data consumption for firms that build custom pipelines or use business intelligence tools. Data can be exported to Excel and standard formats for manual integration into existing workflows. However, the platform does not appear to offer native integrations with enterprise property management systems such as Yardi, RealPage, or MRI Software. For teams that use HelloData primarily as a research and screening tool, the standalone interface is sufficient. For organizations that want automated data flows between their comp database and operational systems, custom integration development may be required. The platform functions effectively as a market intelligence layer that sits alongside the core property management tech stack.

    Competitive Landscape

    HelloData competes most directly with CoStar’s multifamily analytics products and Yardi Matrix, both of which offer comprehensive apartment data with broader coverage but at significantly higher price points. The platform also competes with ALN Apartment Data and RealPage’s market analytics offerings. HelloData differentiates through daily data updates (compared with monthly or quarterly refreshes from some competitors), AI powered comp recommendations with published accuracy benchmarks, accessible pricing that opens the market to mid size operators, and a focused product that does one thing exceptionally well rather than bundling multifamily data into a larger platform. For multifamily teams that need fast, affordable, and accurate rent comp data, HelloData provides a compelling alternative to enterprise subscriptions that include capabilities they may never use.

    The Bottom Line

    HelloData is a standout multifamily intelligence platform that combines daily updated data, measurable accuracy benchmarks, and accessible pricing into a focused product that directly addresses the most time consuming workflow in apartment operations and investment. The 9AI Score of 73 reflects the platform’s exceptional CRE relevance, strong data quality, and innovative approach to democratizing multifamily market intelligence. The limitations are narrowly scoped: the platform serves only multifamily, lacks native enterprise system integrations, and has a smaller market footprint than incumbent data providers. For multifamily professionals who recognize that data freshness and analytical accuracy matter more than brand name recognition, HelloData delivers measurable value at a fraction of enterprise data platform pricing.

    About BestCRE

    BestCRE is the definitive authority on commercial real estate AI, analysis, and investment intelligence. Every article advances three long term SEO goals: ranking number one for Best CRE, Best CRE AI, and Best CRE AI Tools. Content is institutional in quality, independent in voice, and practitioner oriented in perspective. Explore the full category map at 20 CRE sectors for deeper coverage across the CRE technology stack.

    Frequently Asked Questions

    How accurate are HelloData’s rent comp recommendations compared with professional appraisals?

    HelloData reports that its AI comp recommendation engine matches appraiser rent comp selections nine out of ten times. This means that when the platform suggests comparable properties for a market survey or valuation exercise, the comp set is intended to align with what a credentialed appraiser would independently select. This level of agreement is significant because it validates the platform’s analytical methodology against the professional standard used in institutional lending and investment decisions. The AI analyzes property characteristics including location, unit count, age, class, and amenity profile to generate comp recommendations, which replicates the judgment process that human appraisers apply using their market knowledge. For underwriting teams, this accuracy benchmark means HelloData’s comp suggestions can serve as a credible starting point that requires less manual adjustment than generic proximity based comp selection tools.

    How does HelloData’s data compare with CoStar for multifamily analysis?

    HelloData and CoStar serve overlapping but distinct segments of the multifamily data market. CoStar provides the broadest commercial real estate data platform, covering all property types with lease comps, sale comps, market forecasts, and property listings. HelloData focuses exclusively on multifamily with a narrower but deeper product: unit level rent data updated every 24 hours, AI driven comp recommendations, and financial underwriting benchmarks. The key differences are data freshness (HelloData updates daily versus CoStar’s periodic refresh cycles for some data), pricing ($300 per user per month versus CoStar’s enterprise pricing), and scope (multifamily only versus all CRE). For multifamily professionals who primarily need rent comp data and market surveys, HelloData provides comparable or superior functionality at a fraction of the cost. For teams that need cross asset class data, sale comps, or broker network tools, CoStar offers broader capabilities.

    Can HelloData be used for multifamily development feasibility analysis?

    HelloData includes development feasibility reports that combine market data with financial benchmarks to evaluate new multifamily construction opportunities. The platform’s rent comp data provides current asking rents and concession terms for comparable properties in the target market, which informs the revenue assumptions for a pro forma. The expense benchmarking feature, built on public financial reporting data for multifamily properties, provides realistic operating expense estimates for different markets and property types. Together, these data points allow development teams to assess whether a proposed project’s economics are viable based on current market conditions rather than stale assumptions. The platform’s daily data refresh means that feasibility analysis reflects the most current market pricing, which is particularly important in rapidly changing markets where rent growth or concession trends can shift meaningfully within a quarter. Development teams should use HelloData’s data as one input alongside site specific factors such as construction costs, entitlement timelines, and financing terms.

    What data does HelloData update daily and how is it sourced?

    HelloData updates unit level rent prices, floor plan availability, concession terms, and amenity information every 24 hours across more than 35 million multifamily units nationwide. The data is sourced from publicly available apartment listing platforms, property websites, and other accessible online sources. This public data scraping approach allows HelloData to maintain daily freshness at a cost structure that supports accessible pricing, but it means the data reflects asking rents rather than executed lease transactions. For most market survey and comp analysis purposes, asking rents are the relevant benchmark because they represent the current competitive pricing environment. For underwriting scenarios where executed lease terms are critical (such as validating actual contract rents on an existing portfolio), users may need to supplement HelloData’s data with proprietary lease records. The daily refresh cycle is a meaningful advantage over platforms that update monthly or quarterly, as it captures rent adjustments, concession changes, and availability shifts in near real time.

    What is the ROI of switching from manual market surveys to HelloData?

    The ROI calculation for HelloData is driven primarily by time savings on market survey preparation. The platform estimates that property managers save five or more hours per week by automating the manual process of gathering rent data, occupancy information, and concession terms from comparable properties. At a fully loaded analyst cost of $40 to $60 per hour, five hours of weekly savings translates to $200 to $300 per week, or $800 to $1,200 per month, which significantly exceeds the $300 per user monthly subscription cost. For investment teams, additional ROI comes from faster deal screening (the ability to run comp analysis in minutes rather than hours), improved accuracy (reducing the risk of underwriting errors based on stale data), and competitive advantage (accessing daily updated market intelligence that competitors using quarterly reports do not have). A multifamily operator managing five or more properties will typically generate positive ROI within the first month of deployment based on time savings alone.

    Related Reviews

    Compare HelloData with other Market Analytics & Data tools BestCRE has scored: CompStak (76/100), Placer.ai (74/100), CenterCheck (74/100) and Radix (70/100). Browse every review in CRE Market Analytics & Data, the full Best CRE AI Tools directory, or the 20 CRE Sectors hub.

  • Cotality Review: The Rebranded CoreLogic and Its Property Data Empire

    Cotality Review: The Rebranded CoreLogic and Its Property Data Empire

    BestCRE 9AI Score

    73/100 · Contender

    Cotality ranks #162 of 450 commercial real estate AI tools scored on the 9AI Framework. Nine dimensions, each scored out of 10: CRE relevance, data quality, ease of adoption, output accuracy, integration fit, pricing transparency, support, innovation and market reputation.

    Property data is the foundational infrastructure of every commercial real estate transaction, and the quality of that data directly determines the speed and accuracy of underwriting, risk assessment, and portfolio management decisions. For institutional investors, data quality is among the most important factors in accelerating transaction timelines, alongside relationship networks and market timing. The typical institutional CRE acquisition requires cross referencing property records, tax assessments, ownership histories, and environmental risk profiles from several different sources, creating a reconciliation burden that consumes meaningful analyst time on every deal. Commercial transactions routinely rely on at least one third party data provider for property level intelligence, making the infrastructure layer of property data as critical to CRE as Bloomberg terminals are to fixed income trading.

    Cotality, formerly CoreLogic, is the largest property data and analytics company in the United States, and the company says it covers 99.9 percent of U.S. properties with a dataset that includes ownership records, tax assessments, mortgage histories, structural characteristics, hazard risk profiles, and geospatial overlays. The company rebranded from CoreLogic to Cotality in March 2025, signaling an evolution from a mortgage industry data provider to a broader property intelligence platform. Taken private in 2021 by Stone Point Capital and Insight Partners in a $6 billion transaction, Cotality serves clients across lending, insurance, real estate, and government. The platform’s AI capabilities include CoreAI powered Climate Coupled Catastrophe Models (C3 Models) and automated valuation models that underpin a significant share of U.S. residential and commercial property transactions.

    Cotality earns a 9AI Score of 73 out of 100, reflecting its position as the foundational data infrastructure provider for the U.S. property market. The score is anchored by unmatched data coverage, institutional client adoption, and mature analytics capabilities, moderated by enterprise pricing opacity and the complexity of onboarding for smaller CRE firms that may not need the full platform.

    This review is part of BestCRE’s systematic coverage of commercial real estate AI tools across 20 CRE sectors. For the full AI tools directory, see our Best CRE AI Tools hub.

    What Cotality Does and How It Works

    Cotality operates as the property data backbone of the U.S. real estate and financial services industries. The company maintains the nation’s largest property data repository, aggregating information from county assessors, recorders, mortgage servicers, MLS systems, and proprietary collection networks into a unified platform that covers virtually every parcel in the country. The 360 Property Data product provides comprehensive profiles for individual properties, including structural characteristics, ownership history, tax assessment records, mortgage information, hazard risk scores, and geospatial overlays that map environmental and climate exposures.

    The platform’s analytics layer transforms raw property data into decision ready intelligence. Automated valuation models generate property value estimates that are used by lenders for loan origination and servicing, by investors for portfolio monitoring, and by government agencies for tax assessment validation. Market Intelligence Reports provide national and regional trend analysis covering occupancy rates, price movements, and hazard mapping. The Climate Risk Analytics product, powered by the company’s C3 Models, quantifies how climate change is affecting property risk profiles across flood, wildfire, wind, and earthquake exposures, which is increasingly relevant for institutional CRE investors and insurers pricing long term asset risk.

    Cotality also serves the transaction infrastructure layer through products that support title and closing workflows, property tax management, and fraud detection. The company’s data feeds power a significant portion of the U.S. mortgage origination process, and its analytics are embedded in the decision engines of major banks, insurance carriers, and government sponsored enterprises. For CRE professionals, the platform provides the foundational data layer that supports underwriting, due diligence, portfolio risk management, and market analysis. The company operates globally with regional sites for the United States, Canada, the United Kingdom, Australia, and New Zealand, serving clients across the property lifecycle from acquisition through disposition. The rebrand to Cotality reflects the company’s expansion beyond mortgage centric services into a comprehensive property intelligence platform that addresses the full spectrum of real estate decision making.

    9AI Framework: Dimension by Dimension Analysis

    CRE Relevance: 8/10

    Cotality’s data is foundational to virtually every segment of commercial real estate, from acquisition underwriting and portfolio management to insurance risk assessment and tax appeals. The company says the platform covers 99.9 percent of U.S. properties, which means CRE professionals can access ownership, tax, mortgage, and structural data for essentially any parcel in the country. The company’s roots in mortgage and residential property data are well established, and the rebrand to Cotality signals a deliberate expansion into broader commercial real estate and property intelligence applications. The Climate Risk Analytics product is directly relevant to institutional CRE investors who need to quantify environmental exposure across portfolios. The platform’s CRE relevance is highest for investors, lenders, and risk management teams that require comprehensive property level data, and somewhat less differentiated for brokerage or leasing teams that need transaction specific market intelligence. In practice: Cotality is a tier one data provider for any CRE firm that relies on property level data for investment or risk decisions.

    Data Quality and Sources: 9/10

    Data quality is Cotality’s defining strength. The company maintains the largest property data repository in the United States, aggregating records from county assessors and recorders and, by its own account, covering 99.9 percent of properties nationwide. The data includes ownership records, tax assessments, mortgage information, structural characteristics, transaction histories, and environmental risk profiles. This breadth of coverage is unmatched by any competitor, and the depth of historical data (spanning decades of property records) provides a longitudinal dimension that is critical for trend analysis and risk modeling. The company’s data collection infrastructure includes direct relationships with county assessors and recorders, proprietary data aggregation technology, and quality assurance processes that have been refined over more than 50 years of operation. The C3 Models for climate risk analytics add a forward looking data layer that combines historical catastrophe data with climate science projections. In practice: Cotality’s data quality is the industry benchmark against which other property data providers are measured.

    Ease of Adoption: 6/10

    Cotality is an enterprise platform designed for large scale institutional deployment, which means the adoption process involves sales engagement, contract negotiation, technical integration, and often custom configuration. This is not a self serve platform where a CRE analyst can sign up and start querying data in minutes. The complexity of the product suite, which includes dozens of data products, analytics modules, and integration options, creates a steep evaluation curve for organizations that are new to the platform. For firms that are already CoreLogic (now Cotality) clients, the transition to new products and the Cotality brand is straightforward because the underlying data and systems remain consistent. For new clients, the adoption timeline depends on the scope of data access required, the integration with existing systems, and the level of custom analytics needed. Smaller CRE firms may find the enterprise sales process and contract structure disproportionate to their needs. In practice: Cotality is easy to adopt for enterprise organizations with dedicated data teams, but the onboarding process is not designed for small or mid size CRE firms seeking quick access.

    Output Accuracy: 8/10

    Cotality’s output accuracy benefits from more than five decades of data collection, validation, and refinement. The company’s automated valuation models are among the most widely used in the U.S. mortgage industry, with accuracy levels that meet the standards of government sponsored enterprises, major banks, and insurance carriers. The C3 Models for climate risk analytics are calibrated against historical catastrophe data and validated using peer reviewed climate science, which provides a credible foundation for forward looking risk assessment. Tax assessment data is sourced directly from county assessors, which ensures accuracy at the parcel level. Ownership and mortgage records are updated through direct feeds from county recorders and mortgage servicers, minimizing the lag between real world events and data availability. The accuracy of market intelligence reports depends on the timeliness and completeness of the underlying data feeds, which Cotality manages through a dedicated data operations team. In practice: Cotality’s outputs are trusted by the largest financial institutions in the world, which is the strongest available signal of accuracy for a property data platform.

    Integration and Workflow Fit: 7/10

    Cotality’s data products are designed to integrate into enterprise workflows through APIs, data feeds, and embedded analytics modules. The company’s data powers a significant portion of the U.S. mortgage origination infrastructure, which demonstrates deep integration capability with financial services systems. For CRE teams, the integration points include data feeds for underwriting platforms, API access for custom analytics applications, and embedded modules for property tax management and risk assessment. The platform integrates with major financial services technology stacks and has established data partnerships across the lending, insurance, and real estate industries. However, the integration architecture is oriented toward large scale enterprise deployment rather than lightweight, plug and play connectivity. CRE teams that use Argus, Yardi, or other property management systems may need custom integration work to connect Cotality data to their existing workflows. In practice: integration capabilities are enterprise grade and battle tested in financial services, but CRE specific system connectivity may require additional configuration.

    Pricing Transparency: 4/10

    Cotality operates on an enterprise pricing model with no publicly available pricing tiers, rate cards, or self serve options. The company’s products are sold through direct sales engagement, with pricing determined by the scope of data access, the number of users, the specific analytics modules required, and the volume of API calls or data pulls. This is standard practice for enterprise data providers of Cotality’s scale, but it creates a significant barrier for smaller CRE firms that want to evaluate cost effectiveness before committing to a sales process. The $6 billion take private valuation and the breadth of the product suite suggest that pricing is positioned at the institutional level, which may be disproportionate for boutique investment firms or regional brokerages with limited data budgets. For large lenders, REITs, and insurance carriers that consume property data at scale, the pricing is likely competitive relative to the value of the data infrastructure. In practice: pricing requires direct engagement with sales and is not transparent enough for self serve evaluation or quick comparison against alternatives.

    Support and Reliability: 8/10

    Cotality serves clients globally, including many of the largest banks, insurance carriers, and government agencies in the United States. This scale of deployment demands and demonstrates enterprise grade reliability, with infrastructure that supports continuous data delivery, high availability APIs, and robust disaster recovery. The company has been operating for more than 55 years, which provides a track record of institutional stability that few property technology companies can match. The take private transaction by Stone Point Capital and Insight Partners in 2021 provided additional capital for infrastructure investment and product development. Support is delivered through dedicated account teams for enterprise clients, with technical support for API integration and data quality issues. The global operations across six countries require a distributed support infrastructure that operates across time zones. In practice: Cotality’s support and reliability are at the institutional standard expected by the largest financial services organizations in the world.

    Innovation and Roadmap: 7/10

    Cotality’s innovation is evident in its expansion from a traditional property data provider to an AI powered analytics platform. The CoreAI technology layer powers the C3 Models for climate risk assessment, which combine historical catastrophe data with climate science projections to quantify forward looking property risk. This is a genuinely innovative application of AI in property intelligence because it moves beyond historical data reporting into predictive risk modeling that has direct implications for investment decisions, insurance pricing, and portfolio management. The rebrand to Cotality in March 2025 signals a strategic commitment to evolving beyond the mortgage centric identity of CoreLogic and positioning the company as a comprehensive property intelligence platform. The company’s R and D investment is supported by the financial resources of its private equity owners, and the product roadmap appears to be expanding into broader commercial real estate applications. In practice: Cotality is innovating at the intersection of property data and AI, particularly in climate risk and predictive analytics, though the pace of innovation is measured relative to the company’s enterprise scale.

    Market Reputation: 9/10

    Cotality (as CoreLogic) has been the dominant property data provider in the United States for decades. The company’s data is embedded in the decision infrastructure of major banks, insurance carriers, government sponsored enterprises, and real estate investment firms. The $6 billion take private transaction in 2021 by Stone Point Capital and Insight Partners reflects the market’s valuation of the company’s data assets and strategic position. The rebrand to Cotality has been covered by major industry publications and reflects confidence in the company’s ability to expand beyond its mortgage industry base. The client base across lending, insurance, real estate, and government provides the broadest market adoption of any property data platform. Independent industry analysts consistently rank Cotality among the top tier of real estate data and analytics providers. In practice: Cotality’s market reputation is the strongest of any property data provider, with institutional credibility that has been built over more than half a century of operation.

    9AI Score Card Cotality
    73
    73 / 100
    Solid Platform
    Property Data and Analytics
    Cotality
    Cotality (formerly CoreLogic) provides the largest U.S. property data repository covering 99.9 percent of properties, with AI powered analytics for valuation, climate risk, and market intelligence.
    9 Dimensions, Scored 1 to 10
    1. CRE Relevance
    8/10
    2. Data Quality & Sources
    9/10
    3. Ease of Adoption
    6/10
    4. Output Accuracy
    8/10
    5. Integration & Workflow Fit
    7/10
    6. Pricing Transparency
    4/10
    7. Support & Reliability
    8/10
    8. Innovation & Roadmap
    7/10
    9. Market Reputation
    9/10
    BestCRE.com, 9AI Framework v2 Reviewed May 2026

    Who Should Use Cotality

    Cotality is essential for institutional CRE investors, lenders, and risk management teams that require comprehensive property level data across the United States. REITs, private equity real estate funds, and family offices that underwrite acquisitions need the 360 Property Data profiles for due diligence and portfolio monitoring. Lenders that originate or service commercial and residential mortgage loans rely on Cotality’s automated valuation models and title data infrastructure. Insurance carriers and risk managers benefit from the Climate Risk Analytics and C3 Models for quantifying environmental exposure across property portfolios. Government agencies use the platform for tax assessment validation and housing policy analysis. Any CRE organization that makes decisions based on property level data and needs the broadest possible coverage should consider Cotality as a foundational data layer.

    Who Should Not Use Cotality

    Cotality is not designed for small CRE firms, individual brokers, or teams with limited data budgets that need lightweight, self serve access to property information. The enterprise sales process and custom pricing create a barrier that is disproportionate for organizations that only need occasional property lookups or basic market data. Teams that primarily need lease comparable data, tenant credit analysis, or deal pipeline management will find that Cotality’s strengths lie in property level data rather than transaction specific intelligence. CRE professionals focused on niche markets outside the United States may find the coverage less comprehensive, despite the company’s international operations. For teams that need quick, affordable access to property data, platforms like Reonomy or PropStream may be more appropriate entry points.

    Pricing and ROI Analysis

    Cotality operates exclusively on enterprise pricing with no publicly available rate cards or self serve tiers. Pricing is determined by the scope of data access, the specific analytics modules deployed, the number of users, and the volume of API calls. For institutional clients that consume property data at scale (lenders processing thousands of loans, REITs monitoring portfolios across hundreds of assets, insurance carriers pricing risk across millions of properties), the ROI is driven by the accuracy and comprehensiveness of the data relative to the cost of assembling equivalent information from alternative sources. A single underwriting error caused by incomplete property data can cost more than a year of Cotality subscription fees, which is the fundamental ROI argument for enterprise data platforms. For smaller organizations, the cost benefit analysis depends on whether the incremental accuracy and coverage over more affordable alternatives justifies the premium pricing. The company’s long running enterprise client base suggests that the value proposition has been validated at scale.

    Integration and CRE Tech Stack Fit

    Cotality’s data products are designed to integrate into enterprise technology stacks through APIs, bulk data feeds, and embedded analytics modules. The company’s data powers a significant portion of the U.S. mortgage origination infrastructure, which means integration with lending platforms, loan origination systems, and servicing technology is deeply established. For CRE teams, integration typically involves connecting Cotality data feeds to underwriting platforms, risk management dashboards, or custom analytics applications. The platform supports high volume data delivery for organizations that need to ingest property data into internal data warehouses or business intelligence systems. Integration with CRE specific platforms such as Yardi, Argus, or MRI may require custom data engineering depending on the specific data products being consumed. The breadth of Cotality’s API offerings provides flexibility for technical teams, but the enterprise integration model is not plug and play.

    Competitive Landscape

    Cotality’s primary competitors in the property data space include CoStar Group (which dominates CRE specific market data and analytics), ATTOM Data (which provides property data and analytics with more accessible pricing), and Black Knight (now part of ICE, focused on mortgage technology). Reonomy competes in the commercial property intelligence segment with a more accessible self serve model. Cotality’s competitive advantage is the unmatched breadth of its property data repository, which the company says covers 99.9 percent of U.S. properties across ownership, tax, mortgage, structural, and risk dimensions. CoStar offers deeper CRE specific market intelligence (lease comps, sales comps, market forecasts) but does not match Cotality’s coverage of property level records across the full real estate spectrum. The Climate Risk Analytics and C3 Models provide differentiation in the growing market for climate and environmental risk data. For institutional clients that need comprehensive property data infrastructure, Cotality remains the default choice.

    The Bottom Line

    Cotality is the foundational data infrastructure of the U.S. property market, and the rebrand from CoreLogic signals an ambition to expand that position into broader commercial real estate and property intelligence applications. The 9AI Score of 73 reflects the platform’s unmatched data coverage, institutional adoption, and analytical depth, balanced by enterprise pricing opacity and adoption complexity for smaller firms. For institutional CRE investors, lenders, and risk managers, Cotality is not optional; it is the data layer that underpins credible property level decision making. The challenge for the company is extending its relevance to mid market CRE firms and transaction focused professionals who need more accessible entry points. As the property industry increasingly demands AI powered analytics for climate risk, valuation, and portfolio management, Cotality’s data assets position it to remain at the center of the infrastructure layer for decades to come.

    About BestCRE

    BestCRE is the definitive authority on commercial real estate AI, analysis, and investment intelligence. Every article advances three long term SEO goals: ranking number one for Best CRE, Best CRE AI, and Best CRE AI Tools. Content is institutional in quality, independent in voice, and practitioner oriented in perspective. Explore the full category map at 20 CRE sectors for deeper coverage across the CRE technology stack.

    Frequently Asked Questions

    Why did CoreLogic rebrand to Cotality?

    CoreLogic rebranded to Cotality in March 2025 to reflect the company’s evolution from a mortgage industry data provider to a comprehensive property intelligence platform. The name Cotality is intended to represent the convergence of data and humanity in property decision making. The rebrand was a strategic move to signal that the company’s capabilities extend beyond mortgage analytics into broader commercial real estate, insurance, and government applications. The new brand identity includes a refreshed visual design and a repositioned value proposition centered on “intelligence beyond bounds.” The underlying data assets, analytics capabilities, and client relationships remain the same. For existing clients, the transition is primarily cosmetic, with the same products, APIs, and support infrastructure operating under the new brand. The timing of the rebrand, nearly four years after the $6 billion take private transaction, suggests that the private equity owners have completed the operational transformation phase and are now positioning the company for the next growth chapter.

    How does Cotality’s climate risk analytics work for CRE portfolios?

    Cotality’s Climate Risk Analytics product uses the CoreAI powered Climate Coupled Catastrophe Models (C3 Models) to quantify property level exposure to flood, wildfire, wind, and earthquake risks under current and projected climate conditions. The models combine historical catastrophe data with climate science projections to generate forward looking risk scores that reflect how climate change is likely to alter property risk profiles over time. For CRE portfolio managers, this means being able to assess not just current hazard exposure but also how that exposure may change over the hold period of an investment. The analytics are delivered at the individual property level, which allows portfolio managers to identify concentration risk across geographies and hazard types. Insurance carriers use the same models to price property coverage, which creates a shared analytical framework between property owners and their insurers. The practical application for CRE investors is in acquisition screening (avoiding properties with deteriorating risk profiles), portfolio rebalancing (reducing concentration in high risk geographies), and sustainability reporting (quantifying climate exposure for ESG disclosures).

    How does Cotality compare to CoStar for commercial real estate data?

    Cotality and CoStar serve different segments of the CRE data ecosystem with limited overlap. CoStar dominates CRE market intelligence, providing lease and sale comparable data, market forecasts, property listings, and tenant information that brokerage and investment teams use for deal sourcing and underwriting. Cotality provides foundational property data, including ownership records, tax assessments, mortgage histories, structural characteristics, and environmental risk profiles at the parcel level. CoStar’s strength is in transaction specific market intelligence; Cotality’s strength is in property level data infrastructure. A CRE investment firm might use CoStar for market analysis and deal sourcing while using Cotality for property due diligence, risk assessment, and portfolio monitoring. The two platforms are complementary rather than directly competitive for most CRE use cases. Where they overlap is in automated valuation models and market analytics, where both companies offer products with different methodological approaches and data inputs.

    Is Cotality accessible to mid size CRE firms or only enterprise clients?

    Cotality’s primary client base consists of large institutional organizations including major banks, insurance carriers, government agencies, and enterprise real estate firms. The company does not offer self serve pricing tiers or lightweight access options on its public website, which creates a barrier for mid size CRE firms that want to evaluate the platform without a full enterprise sales engagement. However, some Cotality data products are available through third party platforms and data resellers that provide more accessible entry points. Several CRE technology platforms embed Cotality data within their own products, which allows mid size firms to access the underlying data without a direct Cotality subscription. For firms that need comprehensive, direct access to the full Cotality data repository, the enterprise sales process is the primary path. For firms that need specific data elements (such as property characteristics, ownership records, or AVM outputs), reseller channels and embedded partnerships may provide a more proportionate access model. The rebrand to Cotality may signal future efforts to broaden market accessibility, though no specific mid market products have been announced.

    What data does Cotality’s 360 Property Data product include?

    Cotality’s 360 Property Data product provides comprehensive profiles for individual properties across multiple data dimensions. Structural characteristics include building age, square footage, lot size, number of units or rooms, construction type, and building condition indicators. Ownership data includes current and historical owners, transfer dates, and transaction prices. Tax assessment data includes assessed values, tax rates, exemptions, and assessment appeal histories. Mortgage information covers active and historical loans, lender names, loan amounts, interest rates, and lien positions. Hazard risk data includes flood zone designations, wildfire risk scores, earthquake exposure, and wind hazard assessments. Geospatial overlays provide location context including proximity to infrastructure, environmental features, and demographic characteristics. The company says the product covers 99.9 percent of U.S. properties, which means users can access this comprehensive profile for virtually any parcel in the country. The data is updated on varying frequencies depending on the source, with transaction and mortgage data typically reflecting changes within days to weeks of the underlying event.

    Related Reviews

    Compare Cotality with other Market Analytics & Data tools BestCRE has scored: CompStak (76/100), Placer.ai (74/100), NIC MAP Vision (70/100) and Alphastream.ai (67/100). Browse every review in CRE Market Analytics & Data, the full Best CRE AI Tools directory, or the 20 CRE Sectors hub.
  • RETS AI Review: Intelligent Operating System for CRE Deal Workflows

    RETS AI Review: Intelligent Operating System for CRE Deal Workflows

    BestCRE 9AI Score

    64/100 · Niche

    RETS AI ranks #337 of 450 commercial real estate AI tools scored on the 9AI Framework. Nine dimensions, each scored out of 10: CRE relevance, data quality, ease of adoption, output accuracy, integration fit, pricing transparency, support, innovation and market reputation.

    Commercial real estate deal execution remains fragmented across disconnected systems that force teams to manually bridge underwriting models, legal documents, lease files, and market data. Institutional CRE firms use many separate software platforms during a single acquisition cycle, with analysts spending a considerable share of the deal timeline on data reconciliation between systems. The typical CRE acquisition produces a large volume of discrete documents requiring review, extraction, and cross-referencing against financial models. The same fragmentation shows up in brokerage. Buildout’s 2026 DNA of CRE Broker Report found that 53 percent of brokers still do not use a dedicated deal management system. The demand for unified platforms that can ingest, structure, and connect CRE deal documents into a coherent analytical layer has emerged as one of the industry’s most pressing technology needs.

    RETS AI is an AI-powered operating system purpose-built for commercial real estate that unifies underwriting models, legal documents, leases, and proprietary datasets into a single intelligent platform. The company transforms static files into structured knowledge, automates critical deal workflows, and compresses weeks of manual work into seconds. Founded by Lucas Dahl and Manas Nair, RETS AI is headquartered in Silicon Valley and partners across the CRE ecosystem including brokerage, development, investment, lending, management, and REIT clients. The platform delivers fully custom operating systems tailored to each organization’s specific workflows, documents, and data models, enabling faster execution, cleaner diligence, and institutional-grade outputs at scale.

    RETS AI earns a 9AI Score of 64 out of 100, reflecting exceptional CRE relevance as a purpose-built real estate operating system, strong innovation in document-to-knowledge transformation, and a compelling value proposition for institutional deal workflows, balanced by custom pricing opacity, early-stage market presence, and the implementation complexity inherent in fully custom deployments. The result is a deeply specialized CRE platform that addresses the core fragmentation challenge in deal execution.

    This review is part of BestCRE’s systematic coverage of commercial real estate AI tools across 20 CRE sectors. For the full AI tools directory, see our Best CRE AI Tools hub.

    What RETS AI Does and How It Works

    RETS AI operates as a unified intelligence layer that sits across a CRE organization’s entire document and data ecosystem. Rather than functioning as a single-purpose tool for one workflow, the platform ingests and structures the full range of documents and data that CRE firms produce and consume during deal execution: underwriting models, lease abstracts, legal agreements, operating statements, rent rolls, offering memoranda, environmental reports, title documents, and market analytics. The AI transforms these static files into structured, queryable knowledge that can be cross-referenced, validated, and analyzed across the entire document corpus.

    The platform’s approach to customization distinguishes it from standardized SaaS tools. RETS AI builds each deployment as a custom operating system tailored to the specific workflows, document types, data models, and analytical frameworks used by the client organization. A multifamily investment firm’s RETS deployment would be configured around rent roll analysis, unit mix optimization, and tenant income qualification workflows, while a net lease REIT’s deployment would emphasize lease abstraction, tenant credit analysis, and portfolio-level cap rate monitoring. This bespoke approach ensures that the platform aligns precisely with how each organization operates rather than forcing teams to adapt their workflows to a generic platform.

    The workflow automation capabilities compress manual deal processes into automated sequences. Due diligence document review that traditionally requires teams of analysts to read, extract, and cross-reference hundreds of documents can be processed by RETS AI’s extraction engine, which identifies key terms, financial figures, dates, and obligations across document sets and surfaces discrepancies, risks, or missing information. Underwriting model population can be automated by extracting operating data from T-12 statements and rent rolls directly into financial models, reducing the manual data entry that introduces errors and delays. Legal document analysis can identify non-standard provisions, compare terms against institutional standards, and flag items requiring attorney review.

    The platform’s partnership model spans the full CRE ecosystem. Brokerage firms use RETS AI to accelerate listing preparation and comp analysis. Development companies use it to manage entitlement documents and construction budget tracking. Investment managers use it for deal screening, underwriting automation, and portfolio monitoring. Lenders use it for loan document review and covenant tracking. Property management companies use it for lease administration and tenant correspondence analysis. This breadth of application reflects the platform’s adaptability as a customizable operating system rather than a fixed-function tool.

    9AI Framework: Dimension by Dimension Analysis

    CRE Relevance: 9/10

    RETS AI is built exclusively for commercial real estate and understands the industry’s document types, financial conventions, legal structures, and workflow patterns at an institutional level. The platform processes CRE-specific documents including underwriting models, offering memoranda, lease agreements, operating statements, rent rolls, title reports, and environmental assessments. The custom deployment model ensures each implementation aligns with the specific deal types, asset classes, and analytical frameworks used by the client organization. The company’s partnerships across brokerage, development, investment, lending, management, and REIT clients demonstrate broad applicability within the CRE ecosystem. In practice: RETS AI is among the most CRE-relevant platforms in the AI tools landscape, with purpose-built capabilities that address the specific document management and workflow challenges unique to commercial real estate deal execution.

    Data Quality and Sources: 7/10

    RETS AI’s data quality proposition centers on transforming unstructured CRE documents into structured, validated data. The platform extracts financial figures, dates, terms, and obligations from documents like operating statements, rent rolls, and leases, then structures this data for analysis and cross-referencing. The extraction accuracy determines the data quality of the structured output. The platform’s ability to identify discrepancies between documents (for example, lease terms that conflict with operating statement line items) adds a validation layer that improves overall data quality. The platform works with the client’s proprietary data and documents rather than providing external market data. For CRE firms, the value lies in converting their existing document corpus into a structured, searchable knowledge base rather than supplementing with external data sources. In practice: data quality is strong for document extraction and cross-referencing within the client’s proprietary data ecosystem, providing significant improvement over manual document review processes.

    Ease of Adoption: 5/10

    RETS AI’s custom deployment model means adoption involves a structured implementation process rather than self-service onboarding. Each deployment requires configuration of document types, workflow definitions, extraction rules, and integration points specific to the client organization. This implementation process typically involves collaboration between the RETS team and the client’s deal operations staff to map existing workflows and configure the platform accordingly. The result is a highly optimized system, but the initial setup requires significant time and organizational engagement. Once configured, ongoing use is designed to be intuitive for CRE professionals who interact with the platform through familiar document and workflow interfaces. The custom nature of each deployment means the platform adapts to the organization rather than requiring the organization to learn a standardized interface. In practice: initial adoption requires meaningful implementation effort, but the custom configuration ensures the platform aligns with existing workflows rather than imposing new processes on the team.

    Output Accuracy: 7/10

    RETS AI’s output accuracy depends on the extraction engine’s ability to correctly identify and structure information from CRE documents. For standardized document types like operating statements and rent rolls with consistent formatting, extraction accuracy is typically high. For complex legal documents with varied language and non-standard provisions, accuracy may require human validation. The platform’s cross-referencing capability helps identify errors by flagging discrepancies between documents, which actually improves overall accuracy compared with manual processes that review documents in isolation. The custom deployment model allows accuracy to improve over time as the platform learns the specific document formats and conventions used by each client. For underwriting model population, accuracy is critical as errors in extracted financial data can propagate through investment decisions. In practice: output accuracy is strong for well-structured documents and improves through customization, though complex legal documents and non-standard formats benefit from human review of extracted outputs.

    Integration and Workflow Fit: 7/10

    RETS AI’s custom operating system approach inherently addresses integration by building the platform around the client’s existing systems and workflows. The platform can be configured to ingest documents from existing storage systems, feed extracted data into existing financial models, and integrate with existing deal management or property management platforms. The custom deployment model means integration depth is negotiated and built during implementation rather than limited to pre-built connectors. For CRE firms using Yardi, MRI, Argus, or proprietary systems, the integration can be tailored to specific data flows and workflow requirements. The breadth of integration depends on the scope of the implementation engagement and the accessibility of the client’s existing systems. In practice: integration is a strength of the custom deployment model, as the platform is built around the client’s existing technology stack rather than requiring the client to adapt to pre-built connector limitations.

    Pricing Transparency: 4/10

    RETS AI uses custom pricing based on deployment scope, document volume, and organizational complexity. No published pricing tiers are available on the website, and cost information requires direct engagement with the RETS sales team. The custom deployment model means pricing varies significantly based on the number of document types, workflow automations, integration points, and users included in each implementation. For institutional CRE firms accustomed to enterprise software procurement, custom pricing is standard, but it reduces the ability for organizations to benchmark costs or forecast budgets before sales engagement. The total cost includes implementation services, ongoing platform access, and potentially usage-based components for document processing volume. In practice: pricing requires direct engagement and is fully custom, which aligns with enterprise procurement patterns but limits pre-engagement cost assessment for CRE firms evaluating the platform.

    Support and Reliability: 6/10

    RETS AI’s custom deployment model suggests a high-touch support relationship with each client. The implementation process involves direct collaboration with the RETS team, and ongoing support likely includes dedicated account management and technical assistance. As a younger company, the support infrastructure is necessarily smaller than established CRE technology vendors, which may limit response time capacity and documentation depth. The platform’s reliability for document processing and workflow automation depends on the maturity of the specific deployment and the volume of documents processed. Custom deployments benefit from targeted support but may also experience configuration-specific issues that require vendor involvement to resolve. The company’s growing client base across multiple CRE verticals provides some validation of operational reliability. In practice: support is likely high-touch and responsive for current clients given the custom deployment model, but the company’s scale limits the breadth of support infrastructure compared with established vendors.

    Innovation and Roadmap: 8/10

    RETS AI demonstrates strong innovation by approaching CRE technology as an operating system problem rather than a point-solution problem. The platform’s ability to unify underwriting models, legal documents, leases, and proprietary data into a single structured knowledge base represents a fundamentally different approach from tools that address individual workflow components. The document-to-knowledge transformation engine, which converts static files into queryable structured data, addresses the root cause of CRE deal fragmentation rather than patching individual symptoms. The custom deployment model, while limiting scalability, ensures deep innovation within each client’s specific workflow context. The company’s young founders and Silicon Valley positioning suggest a technology-first approach to CRE operations. In practice: RETS AI innovates at the architectural level by reimagining how CRE firms interact with their deal data, rather than incrementally improving existing workflow patterns.

    Market Reputation: 5/10

    RETS AI has an emerging market presence with growing visibility in the CRE technology landscape. The company has been featured in CRE technology publications and industry guides, and its partnerships across multiple CRE verticals (brokerage, development, investment, lending, management, REITs) suggest meaningful market engagement. However, public documentation of specific client names, portfolio sizes, and quantified outcomes is limited. The company’s relatively young founding team and newer market entry mean institutional credibility is still developing. For enterprise CRE firms with formal vendor evaluation processes, RETS AI’s market track record may require additional validation through direct reference checks and pilot deployments. The platform’s positioning as a custom operating system rather than a standardized product makes market reputation harder to establish through traditional channels. In practice: RETS AI has growing industry visibility and meaningful CRE ecosystem partnerships, but the institutional market track record that enterprise firms require for procurement decisions is still developing.

    9AI Score Card RETS AI
    64
    64 / 100
    Emerging Tool
    CRE Operating System
    RETS AI
    RETS AI unifies underwriting models, legal documents, leases, and proprietary data into a single intelligent operating system for CRE deal execution.
    9 Dimensions, Scored 1 to 10
    1. CRE Relevance
    9/10
    2. Data Quality & Sources
    7/10
    3. Ease of Adoption
    5/10
    4. Output Accuracy
    7/10
    5. Integration & Workflow Fit
    7/10
    6. Pricing Transparency
    4/10
    7. Support & Reliability
    6/10
    8. Innovation & Roadmap
    8/10
    9. Market Reputation
    5/10
    BestCRE.com, 9AI Framework v2 Reviewed April 2026

    Who Should Use RETS AI

    RETS AI is designed for institutional CRE firms that process high volumes of deal documents and need to accelerate due diligence, underwriting, and portfolio management workflows. Investment managers handling 20 or more acquisitions per year with complex due diligence requirements will benefit most from the platform’s document-to-knowledge transformation. Net lease REITs processing hundreds of leases annually can leverage automated lease abstraction and tenant credit analysis. Development firms managing entitlement, construction, and financing documents across multiple concurrent projects will find value in unified document intelligence. Lenders processing commercial loan applications with extensive documentation requirements can automate review and covenant tracking. The platform is best suited for firms willing to invest in a custom implementation that delivers long-term operational efficiency.

    Who Should Not Use RETS AI

    RETS AI may not suit small CRE firms with limited deal volume that cannot justify the implementation investment of a custom operating system. Organizations seeking a standardized, self-service SaaS tool with published pricing and instant onboarding should evaluate point-solution alternatives for specific workflow needs. CRE teams that primarily need market data, comp analysis, or portfolio analytics rather than document processing automation should evaluate platforms like CoStar, CompStak, or HouseCanary instead. Firms with minimal document processing requirements or those that outsource due diligence to third-party firms will find limited value in an in-house document intelligence platform.

    Pricing and ROI Analysis

    RETS AI uses custom pricing based on deployment scope, making it difficult to provide specific cost ranges without direct engagement. For institutional CRE firms, the ROI calculation centers on the analyst hours recovered from automated document processing. A firm processing 50 acquisitions per year, each generating 300 documents requiring review, currently dedicates approximately 5,000 to 7,500 analyst hours annually to document-related tasks. At a blended analyst cost of $60 to $90 per hour, this represents $300,000 to $675,000 in annual document processing expense. If RETS AI automates 50 to 70 percent of this work, the annual savings of $150,000 to $472,500 provide significant room for platform subscription and implementation costs. The error reduction value adds additional ROI: preventing a single material due diligence oversight that could affect a $50 million acquisition justifies substantial technology investment.

    Integration and CRE Tech Stack Fit

    RETS AI’s custom deployment model means integration is tailored to each client’s existing technology stack. The platform can be configured to ingest documents from existing storage systems (Box, Google Drive, SharePoint), feed structured data into existing financial models (Excel, Argus), and integrate with existing deal management or property management platforms (Yardi, MRI, Dealpath). The depth of integration depends on the scope of the implementation engagement and the API accessibility of the client’s existing systems. For firms with proprietary internal tools, custom integration development may be required. The platform’s positioning as an operating system rather than a point solution means it is designed to sit across the existing technology stack rather than alongside it.

    Competitive Landscape

    RETS AI competes with document intelligence platforms like Docsumo and QuickData.ai for extraction capabilities, deal management platforms like Dealpath for workflow orchestration, and lease abstraction tools for document processing. The primary differentiation is scope: while competitors address individual workflow components (extraction, deal tracking, lease abstraction), RETS AI positions itself as a unified operating system that connects these components into a coherent platform. Against Dealpath, RETS AI offers deeper AI-powered document processing. Against extraction tools, RETS AI provides broader workflow coverage. The custom deployment model creates a higher barrier to adoption but delivers deeper integration than standardized tools. For institutional CRE firms, the choice between RETS AI and point solutions depends on whether the firm values unified, custom infrastructure or prefers best-of-breed tools connected through integration platforms.

    The Bottom Line

    RETS AI represents an ambitious and architecturally distinctive approach to CRE technology: building a custom intelligent operating system around each organization’s specific deal workflows, documents, and data models. Its 9AI Score of 64 reflects exceptional CRE relevance, strong innovation in document-to-knowledge transformation, and meaningful integration flexibility through custom deployments, balanced by early-stage market presence, custom pricing opacity, and the implementation complexity inherent in bespoke platforms. For institutional CRE firms processing high volumes of deal documents and seeking to compress due diligence timelines, RETS AI offers a compelling alternative to the fragmented point-solution approach that dominates the current CRE technology landscape.

    About BestCRE

    BestCRE.com is the definitive authority on commercial real estate AI, analysis, and investment intelligence. Every article advances the mission of helping CRE professionals identify, evaluate, and deploy the best technology tools for their operations. We benchmark platforms using the 9AI Framework so CRE leaders can compare tools with clear, evidence-based scoring. Explore the full category map at 20 CRE sectors for deeper coverage across the CRE technology stack.

    Frequently Asked Questions

    What types of CRE documents can RETS AI process?

    RETS AI is designed to process the full range of documents generated during CRE deal execution. This includes financial documents (operating statements, T-12s, rent rolls, pro formas, budgets), legal documents (purchase and sale agreements, loan documents, partnership agreements, easements), lease documents (commercial leases, lease abstracts, amendments, tenant correspondence), due diligence documents (environmental reports, property condition assessments, title commitments, surveys), and market documents (offering memoranda, broker opinions of value, market reports). The platform’s custom deployment model means document types are configured during implementation to match the specific document workflows of each client organization. The AI extraction engine is trained to understand the format conventions and terminology specific to each document type, improving accuracy compared with general-purpose document extraction tools.

    How does RETS AI differ from standard lease abstraction tools?

    Standard lease abstraction tools focus specifically on extracting key terms from lease documents into structured formats. RETS AI includes lease abstraction capabilities but extends far beyond by connecting extracted lease data with underwriting models, legal documents, operating statements, and market analytics into a unified knowledge base. This means a lease abstraction in RETS AI is not an isolated document output but part of an integrated data environment where lease terms automatically inform underwriting assumptions, legal review checklists, and portfolio-level analytics. For example, a lease renewal option extracted by RETS AI could automatically trigger analysis of the option’s impact on property valuation, comparison against market lease rates, and flagging of the renewal date in the asset management calendar. Standard abstraction tools produce isolated outputs that must be manually connected to other systems.

    What is the typical implementation timeline for RETS AI?

    Implementation timelines for RETS AI’s custom deployments are not publicly documented and likely vary based on the scope of the engagement, the complexity of the client’s document ecosystem, and the number of workflow automations included. Based on typical enterprise CRE technology implementation patterns, a reasonable estimate would be 4 to 12 weeks for initial deployment, including document type configuration, workflow mapping, integration development, and user training. Simpler deployments focused on a single workflow (like CAM reconciliation or lease abstraction) could be completed faster, while comprehensive operating system implementations covering the full deal lifecycle would require longer timelines. CRE firms should discuss implementation timelines during initial sales conversations and build buffer time for the iterative refinement that custom deployments typically require during the first few months of production use.

    Can RETS AI integrate with Argus for underwriting workflows?

    RETS AI’s custom deployment model can theoretically support integration with Argus and other CRE financial modeling tools, though the specific depth of current Argus integration is not publicly documented. The platform’s ability to extract operating data from documents and populate financial models suggests a pathway for automated data flow into Argus models. At minimum, RETS AI could export structured data in formats compatible with Argus import capabilities. At the deeper end, custom integration could enable direct population of Argus assumptions from extracted document data, automated comparison of RETS-extracted actuals against Argus projections, and flagging of variances that require underwriting attention. CRE firms using Argus as their primary underwriting tool should discuss specific integration capabilities and data flow requirements during the RETS AI evaluation process.

    Is RETS AI suitable for CRE firms outside the United States?

    RETS AI’s custom deployment model is technically adaptable to CRE markets outside the United States, but the platform’s current market focus and document training data appear primarily oriented toward US commercial real estate conventions. CRE document formats, legal structures, lease terminology, and accounting standards vary significantly across international markets. A European CRE firm’s operating statements, lease agreements, and regulatory documents follow different conventions than US counterparts. International CRE firms evaluating RETS AI should discuss the platform’s experience with non-US document types, legal frameworks, and currency handling. The custom deployment model provides the flexibility to configure for international markets, but the implementation effort may be greater if the platform’s core extraction models need adaptation for unfamiliar document formats. Firms operating across multiple countries should evaluate whether the platform can handle multi-jurisdiction document processing within a single deployment.

    Related Reviews

    Compare RETS AI with other Workflow & Automation tools BestCRE has scored: Yardi Virtuoso (79/100), Cherre (74/100), n8n (69/100) and Lovable (68/100). Browse every review in CRE Workflow & Automation, the full Best CRE AI Tools directory, or the 20 CRE Sectors hub.

  • TripleZip Review: AI Powered Accounting Automation for CRE Firms

    TripleZip Review: AI Powered Accounting Automation for CRE Firms

    BestCRE 9AI Score

    61/100 · Niche

    TripleZip ranks #393 of 450 commercial real estate AI tools scored on the 9AI Framework. Nine dimensions, each scored out of 10: CRE relevance, data quality, ease of adoption, output accuracy, integration fit, pricing transparency, support, innovation and market reputation.

    Commercial real estate accounting remains one of the most labor-intensive and error-prone operational functions in the industry. CAM (common area maintenance) reconciliation alone consumes a large number of hours per property each year for large commercial portfolios, and manual reconciliation processes remain error prone. Accounting and reconciliation services add meaningfully to per-property operating costs, with triple-net lease accounting taking up a substantial portion of total property accounting effort. Technology budgets are rising. In Deloitte’s 2027 Commercial Real Estate Outlook, more than 90 percent of surveyed CRE executives plan to increase spending on data and technology next year, up from 76 percent in the previous survey. The complexity of NNN lease accounting, with its pass-through calculations, true-up adjustments, and multi-tenant allocation formulas, creates a persistent demand for purpose-built automation that understands CRE financial workflows.

    TripleZip is an AI-powered accounting automation platform purpose-built for commercial real estate firms. The platform automates the most labor-intensive CRE accounting processes including CAM reconciliation, lease and expense tracking, budgeting, and financial projections. Founded in 2025 by Yash Sahota and Grayson Pike, TripleZip emerged from Y Combinator’s Winter 2025 batch with $500,000 in seed funding from 468 Capital and Y Combinator. The company claims that CRE firms using the platform can save up to 95 percent on accounting costs compared with hiring outside firms for complex tasks like CAM reconciliation and budgeting. For CRE property managers and asset managers, TripleZip addresses the specific pain point of triple-net lease accounting that has historically required either expensive external accounting firms or large internal teams with specialized CRE knowledge.

    TripleZip earns a 9AI Score of 61 out of 100, reflecting strong CRE relevance as a purpose-built real estate accounting platform, meaningful innovation in automating NNN reconciliation workflows, and clear value proposition for property management firms, balanced by early-stage maturity, limited market track record, and the scaling challenges inherent in a seed-funded startup. The result is a promising CRE-native tool that addresses one of the industry’s most persistent operational bottlenecks.

    This review is part of BestCRE’s systematic coverage of commercial real estate AI tools across 20 CRE sectors. For the full AI tools directory, see our Best CRE AI Tools hub.

    What TripleZip Does and How It Works

    TripleZip targets the specific accounting workflows that make CRE financial management uniquely complex. At the center of its value proposition is CAM reconciliation automation, which is the process of calculating, allocating, and reconciling common area maintenance expenses across tenants in a multi-tenant commercial property. This process requires tracking actual expenses against budgeted amounts, applying tenant-specific allocation methodologies based on lease terms, generating true-up calculations at year end, and producing reconciliation statements for each tenant. In traditional workflows, this process involves extensive manual spreadsheet work, cross-referencing of lease terms, and verification against general ledger entries, creating opportunities for errors at each step.

    The platform automates this workflow by ingesting lease data, expense records, and allocation rules, then executing the reconciliation calculations automatically. The AI component handles the interpretation of lease language that defines allocation methodologies, cap structures, and exclusion categories, reducing the need for accountants to manually parse lease provisions for each tenant. For CRE firms managing portfolios with dozens or hundreds of tenants across multiple properties, this automation can compress what traditionally takes weeks of manual work into hours of automated processing with human review.

    Beyond CAM reconciliation, TripleZip provides automation for ongoing lease and expense tracking, operating budget preparation, and financial projections. The lease tracking component monitors key dates, escalation triggers, and renewal options, ensuring that accounting entries align with current lease terms. The budgeting module uses historical expense data and lease-driven revenue projections to generate operating budgets that reflect actual portfolio performance. Financial projections incorporate trend analysis and lease-level assumptions to forecast cash flows, NOI, and operating expense ratios.

    The platform’s CRE-native design means it understands the terminology, data structures, and calculation methodologies specific to commercial real estate accounting. Unlike general-purpose accounting tools that require extensive customization for CRE workflows, TripleZip is built from the ground up around concepts like tenant pro-rata shares, expense pools, capital versus operating expense classification, and base year versus net lease structures. This domain specificity reduces the configuration overhead and error risk that occur when adapting horizontal accounting platforms for CRE use.

    9AI Framework: Dimension by Dimension Analysis

    CRE Relevance: 9/10

    TripleZip is built exclusively for commercial real estate accounting workflows. The platform’s core functionality targets CAM reconciliation, NNN lease accounting, CRE budgeting, and property-level financial management, which are workflows unique to commercial real estate operations. The platform understands CRE-specific concepts including tenant pro-rata share calculations, expense pool allocation, capital versus operating expense classification, base year adjustments, and gross-up provisions. This domain specificity eliminates the configuration and customization overhead required when adapting general-purpose accounting tools for CRE use. The Y Combinator pedigree and CRE-focused founding team demonstrate institutional understanding of the target market. In practice: TripleZip is among the most CRE-relevant tools in the automation category, directly addressing accounting workflows that are unique to commercial real estate operations and poorly served by horizontal platforms.

    Data Quality and Sources: 6/10

    TripleZip processes CRE financial data including lease terms, expense records, and allocation schedules. The platform’s data quality depends on the accuracy of inputs provided by the CRE firm, but its automated reconciliation logic reduces the calculation errors that typically occur during manual processing. The AI-powered lease interpretation capability adds a data quality layer by standardizing how lease provisions are translated into allocation rules, reducing inconsistency across properties and accountants. The platform does not provide external market data or benchmark information, focusing instead on processing the firm’s internal financial records. Data validation checks within the reconciliation process can identify discrepancies between lease terms and accounting entries, flagging potential errors for review. In practice: TripleZip improves data quality through automated calculation accuracy and standardized lease interpretation, though it depends on clean input data from the CRE firm’s existing systems.

    Ease of Adoption: 6/10

    TripleZip adoption requires initial configuration including lease data ingestion, expense category mapping, and allocation rule setup. As an early-stage platform, the onboarding process likely involves direct support from the TripleZip team rather than self-service setup. CRE firms need to provide lease abstracts, chart of accounts mapping, and historical expense data to configure the system for their specific portfolio. Once configured, ongoing use should be more straightforward as the platform processes recurring accounting tasks within established parameters. The specialized nature of the platform means users need CRE accounting knowledge to validate outputs and configure rules correctly. The Y Combinator backing suggests the company provides hands-on implementation support during the current growth phase. In practice: initial adoption requires meaningful setup effort and CRE accounting expertise, but ongoing use becomes increasingly efficient as the platform learns the firm’s portfolio and accounting patterns.

    Output Accuracy: 7/10

    TripleZip’s output accuracy for accounting calculations should be high given the deterministic nature of reconciliation math, once allocation rules and lease terms are correctly configured. The AI component that interprets lease provisions introduces some variability, as natural language lease terms can be ambiguous and require judgment calls about allocation methodology. The platform’s value proposition of reducing the 8 to 12 percent error rate in manual CAM reconciliation suggests confidence in automated accuracy. For CRE firms, the critical accuracy requirement is that tenant-facing reconciliation statements must be legally compliant and mathematically precise, as errors can result in tenant disputes, audit findings, and legal liability. Outputs should be reviewed by qualified CRE accountants, particularly during the initial deployment period when the platform is learning the firm’s lease interpretation conventions. In practice: calculation accuracy is likely strong for well-configured accounts, but lease interpretation accuracy should be validated carefully during initial deployment.

    Integration and Workflow Fit: 5/10

    As an early-stage platform, TripleZip’s integration ecosystem is not fully documented publicly. The platform needs to connect with property management systems (Yardi, MRI, AppFolio), general ledger systems, and potentially document management platforms to access lease files and expense records. The depth of these integrations at the current stage is unclear. For CRE firms, seamless integration with existing property management platforms is critical for adoption, as manual data transfer between systems would undermine the efficiency gains from automated reconciliation. The platform’s ability to import lease abstracts and expense data likely supports standard file formats (CSV, Excel) as a minimum, with API integrations to major CRE platforms as a development priority. In practice: integration capabilities are currently limited by the platform’s early-stage maturity, and CRE firms should evaluate integration depth with their specific property management systems before committing.

    Pricing Transparency: 5/10

    TripleZip’s pricing is described as custom, which is typical for early-stage B2B CRE platforms that price based on portfolio size, property count, or transaction volume. The company’s claim of 95 percent cost savings compared with outside accounting firms provides a value framework, but specific pricing tiers are not published publicly. For CRE firms spending $3,000 to $8,000 per property on accounting services, even a substantial TripleZip subscription would represent significant savings if the platform delivers on its automation promise. The custom pricing approach allows the company to align costs with the value delivered for each client’s specific portfolio, but it reduces the ability for CRE firms to forecast costs before engaging with sales. In practice: pricing transparency is limited by the custom model, and CRE firms should request detailed pricing proposals based on their specific portfolio characteristics and accounting service cost benchmarks.

    Support and Reliability: 5/10

    As a seed-stage startup with $500,000 in funding, TripleZip’s support infrastructure is necessarily limited compared with established CRE technology vendors. The Y Combinator backing and focused founding team suggest commitment to customer success, and early-stage companies typically provide high-touch support to initial customers. However, the small team size limits the breadth of support coverage, documentation depth, and response time guarantees that enterprise CRE firms expect. The platform’s reliability track record is too short to evaluate comprehensively. For CRE accounting tasks where accuracy has legal and financial implications, the platform’s maturity is a consideration. CRE firms adopting TripleZip at this stage should expect a partnership-oriented relationship with high access to the founding team but limited formal support infrastructure. In practice: support quality is likely high-touch but resource-constrained, and CRE firms should evaluate their risk tolerance for adopting early-stage accounting technology.

    Innovation and Roadmap: 8/10

    TripleZip demonstrates strong innovation by applying AI specifically to the CRE accounting workflows that have been most resistant to automation. CAM reconciliation and NNN lease accounting represent genuinely complex processes that general-purpose accounting tools have failed to automate effectively, making TripleZip’s focused approach technically ambitious and commercially valuable. The AI-powered lease interpretation capability, which translates natural language lease provisions into calculation rules, is a meaningful technical contribution that addresses a real bottleneck in CRE accounting automation. The Y Combinator validation, which accepts approximately 1.5 percent of applicants, provides independent confirmation of the company’s innovation potential. The platform’s roadmap likely includes expanded property type support, deeper PM system integrations, and enhanced reporting capabilities. In practice: TripleZip innovates in a genuinely underserved area of CRE technology, with AI-powered lease interpretation representing a novel approach to a historically manual and error-prone process.

    Market Reputation: 4/10

    TripleZip is an early-stage startup with limited market presence. The Y Combinator W25 batch selection provides strong startup credibility, and the $500,000 seed funding from 468 Capital and YC validates the business model. However, the company’s client base, revenue metrics, and enterprise adoption are not publicly documented. The CRE accounting automation market is relatively uncrowded, which provides TripleZip with a clear positioning opportunity, but the company’s track record is too short to establish the institutional credibility that enterprise CRE firms typically require for accounting technology procurement. Early adopters will be taking a calculated risk on an innovative but unproven platform. In practice: TripleZip has startup credibility through Y Combinator but lacks the market track record and enterprise adoption that institutional CRE firms use to evaluate accounting technology vendors.

    9AI Score Card TripleZip
    61
    61 / 100
    Emerging Tool
    CRE Accounting Automation
    TripleZip
    TripleZip automates CRE accounting including CAM reconciliation, NNN lease tracking, and budgeting, claiming up to 95 percent cost savings versus outside firms.
    9 Dimensions, Scored 1 to 10
    1. CRE Relevance
    9/10
    2. Data Quality & Sources
    6/10
    3. Ease of Adoption
    6/10
    4. Output Accuracy
    7/10
    5. Integration & Workflow Fit
    5/10
    6. Pricing Transparency
    5/10
    7. Support & Reliability
    5/10
    8. Innovation & Roadmap
    8/10
    9. Market Reputation
    4/10
    BestCRE.com, 9AI Framework v2 Reviewed April 2026

    Who Should Use TripleZip

    TripleZip is designed for CRE property management firms and asset managers who manage commercial portfolios with triple-net or modified gross leases that require CAM reconciliation. Firms spending $3,000 to $8,000 per property annually on accounting services will find the strongest ROI case. Property managers handling portfolios of 10 or more commercial properties with multi-tenant NNN structures represent the platform’s ideal customer profile. Accounting teams that currently perform CAM reconciliation manually in spreadsheets or through general-purpose accounting software will benefit from the purpose-built automation. CRE firms willing to adopt early-stage technology in exchange for potential cost savings and innovation access should evaluate TripleZip as a strategic accounting technology investment.

    Who Should Not Use TripleZip

    TripleZip may not suit institutional CRE firms with strict vendor evaluation requirements that demand established market track records, SOC 2 compliance, and comprehensive SLA guarantees. Firms with existing, well-functioning accounting workflows in Yardi or MRI may find the switching costs and integration challenges outweigh near-term automation benefits. Residential property managers or CRE firms focused exclusively on gross lease structures where CAM reconciliation is not required will find limited value. Organizations that need the accounting platform to also handle AP, AR, and general ledger functions should evaluate comprehensive property management platforms rather than a specialized reconciliation tool.

    Pricing and ROI Analysis

    TripleZip uses custom pricing based on portfolio characteristics. The company claims up to 95 percent cost savings compared with outside accounting firms for complex tasks like CAM reconciliation. For a CRE firm currently spending $5,000 per property per year on reconciliation services across a 20-property portfolio ($100,000 annually), a 95 percent reduction would represent $95,000 in annual savings. Even at a more conservative 50 percent cost reduction, the savings of $50,000 annually would provide strong ROI against a typical SaaS subscription. The custom pricing model means actual costs depend on negotiation and portfolio specifics. CRE firms should request detailed pricing proposals that include implementation costs, ongoing subscription fees, and support charges to build accurate ROI projections against their current accounting expenditures.

    Integration and CRE Tech Stack Fit

    TripleZip’s integration capabilities with major CRE property management systems (Yardi, MRI, AppFolio) are not fully documented at this stage. The platform likely supports standard data import formats for lease abstracts, expense records, and chart of accounts information. For CRE firms, the integration question is critical: seamless connection with existing property management systems determines whether TripleZip adds value as an integrated accounting layer or creates additional data management overhead. Early-stage CRE technology companies typically prioritize integration with Yardi and MRI first, as these platforms dominate the institutional property management market. CRE firms evaluating TripleZip should verify current integration capabilities with their specific property management platform before committing.

    Competitive Landscape

    TripleZip competes with the accounting modules built into property management platforms (Yardi, MRI, AppFolio), specialized CRE accounting service firms, and general-purpose AI accounting tools adapted for real estate. Against Yardi and MRI’s built-in accounting, TripleZip differentiates through AI-powered automation that promises higher efficiency than traditional software workflows. Against accounting service firms, TripleZip offers dramatically lower costs through automation. Against general-purpose AI accounting tools, TripleZip provides CRE-specific domain knowledge that eliminates the customization overhead. The primary competitive challenge is persuading CRE firms to adopt a standalone accounting automation tool alongside their existing property management platform, rather than waiting for Yardi or MRI to add equivalent AI capabilities to their accounting modules.

    The Bottom Line

    TripleZip addresses one of the most labor-intensive and error-prone processes in CRE operations: triple-net lease accounting and CAM reconciliation. Its 9AI Score of 61 reflects exceptional CRE relevance, strong innovation in automating NNN accounting workflows, and a compelling cost savings proposition, balanced by early-stage maturity, limited integration documentation, and the market reputation challenges inherent in a seed-funded startup. For CRE firms willing to adopt emerging technology and contribute to product development through early adoption, TripleZip represents a potentially transformative accounting automation investment. Risk-averse firms should monitor the company’s growth and integration development before committing.

    About BestCRE

    BestCRE.com is the definitive authority on commercial real estate AI, analysis, and investment intelligence. Every article advances the mission of helping CRE professionals identify, evaluate, and deploy the best technology tools for their operations. We benchmark platforms using the 9AI Framework so CRE leaders can compare tools with clear, evidence-based scoring. Explore the full category map at 20 CRE sectors for deeper coverage across the CRE technology stack.

    Frequently Asked Questions

    What is CAM reconciliation and why is it difficult to automate?

    CAM (common area maintenance) reconciliation is the annual process of calculating actual common area expenses for a commercial property, allocating those expenses to tenants based on their lease-defined share, comparing actual allocations against estimated payments collected during the year, and generating true-up statements for each tenant. The process is difficult to automate because each tenant’s allocation methodology can differ based on their specific lease terms, including caps, floors, exclusions, base year adjustments, and gross-up provisions. A single 50-tenant office building might have 30 different allocation formulas across its tenant base. Traditional accounting software requires manual configuration of each allocation rule, and changes in tenant mix require ongoing maintenance. TripleZip addresses this complexity through AI-powered lease interpretation that automatically translates lease language into calculation rules, reducing the manual configuration burden that has historically made CAM reconciliation resistant to automation.

    How does TripleZip’s AI interpret lease provisions for accounting?

    TripleZip’s AI analyzes lease documents to identify and extract accounting-relevant provisions including expense pass-through methodologies, cap structures, base year definitions, expense exclusion categories, and tenant pro-rata share calculations. The AI translates natural language lease terms into structured allocation rules that the platform can execute automatically. For example, a lease provision stating “Tenant shall pay its proportionate share of Operating Expenses exceeding the Base Year Amount, excluding capital improvements with a useful life exceeding 10 years” would be parsed into a calculation rule defining the base year reference, the pro-rata share percentage, and the capital expense exclusion threshold. This interpretation is validated against the CRE firm’s accounting standards and can be reviewed by accountants before being applied. The AI’s ability to handle lease language variability across different attorneys, markets, and lease structures reduces the manual effort of lease abstraction for accounting purposes.

    Is TripleZip a replacement for Yardi or MRI accounting modules?

    TripleZip is designed to complement rather than replace comprehensive property management platforms like Yardi or MRI. While Yardi and MRI include accounting modules, their CAM reconciliation and NNN accounting workflows still require significant manual configuration and processing. TripleZip aims to automate the most labor-intensive components of CRE accounting (CAM reconciliation, true-up calculations, tenant billing statements) that exist within or alongside these platforms. The ideal deployment would integrate TripleZip with Yardi or MRI, using the property management platform as the system of record while TripleZip handles automated reconciliation processing. However, the depth of integration between TripleZip and these platforms is still developing, and CRE firms should verify current integration capabilities before assuming seamless interoperability.

    What are the risks of adopting an early-stage CRE accounting platform?

    Adopting TripleZip at its current stage involves several risks that CRE firms should evaluate. The company’s $500,000 seed funding provides limited runway compared with established CRE technology vendors, creating uncertainty about long-term viability. The platform’s integration with major property management systems is still developing, meaning data flows may require manual processes during the integration development period. The small team size limits support capacity, documentation depth, and feature development speed. Accounting errors in CRE have legal and financial implications (tenant disputes, audit findings), so relying on an unproven platform for financial-critical processes requires careful validation. Early adopters should run TripleZip in parallel with existing accounting processes during an initial validation period, comparing automated outputs against manually produced reconciliations to verify accuracy before transitioning fully.

    How much can a CRE firm realistically save with TripleZip?

    Realistic savings depend on portfolio size, lease complexity, and current accounting costs. TripleZip claims up to 95 percent savings compared with outside accounting firms, but a conservative estimate of 40 to 60 percent savings may be more appropriate for initial deployments. For a CRE firm managing 20 commercial properties with an average accounting cost of $5,000 per property annually ($100,000 total), a 50 percent reduction would save $50,000 per year. For larger portfolios of 50 or more properties, annual savings could reach $125,000 to $250,000. The savings come from reduced staff hours on manual reconciliation, lower outsourced accounting fees, and fewer error-related rework cycles. CRE firms should calculate their current per-property accounting costs, estimate the percentage of those costs attributable to CAM reconciliation and NNN accounting, and apply a conservative automation rate to project realistic savings before negotiating TripleZip pricing.

    Related Reviews

    Compare TripleZip with other Workflow & Automation tools BestCRE has scored: Yardi Virtuoso (79/100), Cherre (74/100), QuickData.ai (72/100) and Beam AI (40/100). Browse every review in CRE Workflow & Automation, the full Best CRE AI Tools directory, or the 20 CRE Sectors hub.
  • Shortcut AI Review: Automated Spreadsheet Intelligence for CRE Analytics

    Shortcut AI Review: Automated Spreadsheet Intelligence for CRE Analytics

    BestCRE 9AI Score

    61/100 · Niche

    Shortcut AI ranks #393 of 450 commercial real estate AI tools scored on the 9AI Framework. Nine dimensions, each scored out of 10: CRE relevance, data quality, ease of adoption, output accuracy, integration fit, pricing transparency, support, innovation and market reputation.

    Spreadsheets remain the most widely used analytical tool in commercial real estate operations, yet the time spent on manual data cleaning, formula construction, and report formatting represents one of the industry’s largest productivity drains. CRE analysts spend a large part of every week on spreadsheet-related tasks, with data cleaning and formatting consuming much of that time. Excel-based models that require manual data entry and formula validation still sit underneath a large share of CRE underwriting workflows. Spreadsheet errors accumulate with every manually entered cell in CRE financial models, and the risk grows significantly for complex multi-tab models. The demand for AI-powered spreadsheet automation that can reduce manual effort while improving data quality has become a pressing operational priority across the CRE sector.

    Shortcut AI is an AI-powered spreadsheet automation platform that deploys intelligent agents to handle data cleaning, analysis, transformation, and reporting tasks within spreadsheet workflows. Rather than requiring users to write formulas or VBA macros, Shortcut AI accepts natural language instructions and executes spreadsheet operations autonomously. Users can describe tasks like “clean this rent roll data, standardize the date formats, remove duplicate rows, and calculate the weighted average rent per unit” and the platform executes the operations across the spreadsheet. The platform supports both Google Sheets and Excel integration, enabling CRE teams to apply AI automation to their existing spreadsheet workflows without migrating to new platforms.

    Shortcut AI earns a 9AI Score of 61 out of 100, reflecting strong ease of adoption for spreadsheet-dependent CRE teams, solid output accuracy for common data operations, and clear pricing, balanced by limited CRE-specific features and a narrower scope compared with full-stack automation platforms. The result is a focused tool that addresses one of the most time-consuming aspects of CRE operations: spreadsheet work.

    This review is part of BestCRE’s systematic coverage of commercial real estate AI tools across 20 CRE sectors. For the full AI tools directory, see our Best CRE AI Tools hub.

    What Shortcut AI Does and How It Works

    Shortcut AI operates as an AI layer on top of existing spreadsheet environments, accepting natural language instructions to perform data operations that would otherwise require manual formula writing, pivot table construction, or VBA scripting. The platform’s AI agents interpret user requests, determine the appropriate spreadsheet operations, and execute them across the specified data ranges. Operations include data cleaning (deduplication, format standardization, null handling), analysis (statistical calculations, trend identification, outlier detection), transformation (pivot operations, data reshaping, column derivation), and reporting (summary generation, chart creation, formatted output).

    For CRE analysts, the practical applications are immediately relevant. A rent roll received from a property manager often arrives with inconsistent date formats, mixed unit labeling conventions, and missing data fields. Shortcut AI can standardize these inconsistencies through a single natural language command, replacing what typically requires 30 to 60 minutes of manual data cleaning. Financial modeling tasks like calculating cap rates across a portfolio, comparing NOI growth rates by property type, or generating lease expiration schedules can be described in plain English and executed automatically. The platform can also generate summary reports with formatted headers, conditional formatting, and calculated totals that would otherwise require manual construction.

    The platform integrates with Google Sheets and Microsoft Excel, working within the spreadsheet environments that CRE teams already use. This integration approach means teams do not need to migrate data to a new platform or learn a new interface for most tasks. The AI agents access and modify spreadsheet data in place, preserving existing formulas, formatting, and data relationships. For teams with established spreadsheet-based underwriting templates or portfolio tracking systems, Shortcut AI adds AI automation without disrupting existing workflows or requiring template reconstruction.

    The platform offers both free and paid tiers, with paid plans providing higher usage limits and access to advanced features. The natural language interface eliminates the learning curve associated with traditional spreadsheet automation approaches like macros, scripts, or formula-heavy solutions, making advanced data operations accessible to CRE professionals regardless of their technical skill level.

    9AI Framework: Dimension by Dimension Analysis

    CRE Relevance: 5/10

    Shortcut AI targets spreadsheet automation, which is directly relevant to CRE operations where spreadsheets dominate analytical workflows. However, the platform does not include CRE-specific features, terminology, or pre-built templates for common real estate operations like rent roll analysis, DCF modeling, or lease abstraction. The platform’s value to CRE teams comes from the universal applicability of spreadsheet automation to CRE workflows rather than purpose-built real estate capabilities. The natural language interface can interpret CRE-specific requests when the user describes them clearly, but the AI does not inherently understand real estate financial concepts, property types, or market conventions. In practice: Shortcut AI’s relevance to CRE is higher than most horizontal automation tools because it operates in the spreadsheet environment where most CRE analysis happens, but it lacks the domain knowledge to automate CRE-specific analytical logic without explicit user guidance.

    Data Quality and Sources: 5/10

    Shortcut AI processes data within existing spreadsheets, meaning it works with whatever data the CRE team already has. The platform’s data cleaning capabilities (deduplication, format standardization, null handling, outlier detection) directly improve data quality, which is a significant value proposition for CRE teams dealing with messy rent rolls, inconsistent property records, or manually entered financial data. The AI agents can identify and flag data quality issues that manual review might miss, such as unit count discrepancies, impossible date ranges, or statistically anomalous values. However, the platform does not provide or connect to external data sources for validation or enrichment. CRE teams cannot use Shortcut AI to pull market data, comp information, or property records from external databases. In practice: Shortcut AI improves the quality of existing data through automated cleaning and validation, which addresses a genuine pain point in CRE data management, but does not provide external data sources for enrichment.

    Ease of Adoption: 8/10

    Shortcut AI provides an intuitive natural language interface that requires no spreadsheet formula knowledge, macro programming, or technical training. CRE analysts can describe desired operations in plain English and the platform executes them. The integration with Google Sheets and Excel means teams continue working in familiar environments without learning a new platform. The free tier provides genuine testing capacity. The learning curve is minimal: users with no prior AI tool experience can execute their first automated spreadsheet operation within minutes. The platform handles the translation from business language to spreadsheet operations automatically, eliminating the need to understand VLOOKUP syntax, pivot table configuration, or data transformation formulas. In practice: adoption is exceptionally fast for CRE teams because it enhances their existing spreadsheet workflow rather than replacing it, and the natural language interface requires no technical training.

    Output Accuracy: 7/10

    Shortcut AI’s output accuracy is strong for common data operations including cleaning, sorting, filtering, and basic calculations. Format standardization, deduplication, and statistical calculations execute with high reliability. More complex operations involving multi-step transformations, conditional logic, or domain-specific calculations may require iterative refinement through additional prompts. The platform preserves existing spreadsheet formulas and data relationships when executing operations, reducing the risk of breaking established models. For CRE-specific calculations like cap rate derivation, NOI computation, or debt service coverage ratios, the accuracy depends on how clearly the user describes the calculation methodology, as the platform does not inherently understand CRE financial conventions. Users should validate results for critical financial calculations against known benchmarks. In practice: accuracy is reliable for data cleaning and standard operations, with financial calculation accuracy depending on the precision of user instructions.

    Integration and Workflow Fit: 6/10

    Shortcut AI integrates with Google Sheets and Microsoft Excel, covering the two most common spreadsheet environments in CRE operations. The platform operates within these environments rather than requiring data export or platform migration. For CRE teams, this means existing underwriting templates, portfolio trackers, and financial models remain in place while gaining AI automation capabilities. The integration does not extend to CRE-specific platforms like Yardi, CoStar, or Argus, so data must be in spreadsheet format before Shortcut AI can process it. The platform does not connect to database systems, CRM platforms, or other business applications directly, limiting its utility in broader automation workflows. For teams that need end-to-end workflow automation spanning multiple systems, Shortcut AI serves as a spreadsheet-specific tool within a broader automation strategy. In practice: the Google Sheets and Excel integration covers the primary CRE analytical environment, but the narrow scope limits utility for multi-system workflow automation.

    Pricing Transparency: 7/10

    Shortcut AI offers a free tier with usage limits and paid plans with expanded capabilities. Published pricing is available on the website, providing clear cost expectations for CRE teams. The free tier allows genuine testing and evaluation, enabling teams to assess the platform’s value before committing to a paid subscription. The paid tiers scale based on usage volume, which aligns with the variable spreadsheet processing demands of CRE operations that intensify during underwriting cycles, quarterly reporting, and portfolio reviews. The pricing is competitive relative to other AI-powered spreadsheet tools. In practice: pricing is transparent and accessible, with the free tier providing meaningful testing capacity and paid plans offering predictable costs for CRE teams with regular spreadsheet automation needs.

    Support and Reliability: 6/10

    Shortcut AI provides documentation and support for users navigating the platform’s capabilities. As a focused spreadsheet automation tool, the support scope is narrower than enterprise platforms, with fewer community resources, third-party tutorials, and implementation partners available. The platform’s reliability for spreadsheet operations is solid, with operations executing consistently for standard data tasks. The primary reliability consideration is ensuring that AI-executed operations produce correct results for CRE-specific calculations, which requires user validation for critical financial outputs. The platform’s smaller market presence means fewer peer resources and community knowledge bases compared with established tools like Zapier or Pipedream. In practice: support is adequate for the platform’s focused scope, and CRE teams should plan for internal validation of outputs for financial-critical spreadsheet operations.

    Innovation and Roadmap: 6/10

    Shortcut AI demonstrates meaningful innovation in making spreadsheet automation accessible through natural language. The platform addresses a genuine productivity gap for spreadsheet-dependent professionals who lack formula expertise or macro programming skills. The AI agent approach to spreadsheet operations is technically sound and provides immediate practical value. However, the competitive landscape for AI-powered spreadsheet tools is active, with Google Sheets’ built-in AI features, Microsoft Copilot for Excel, and specialized tools like Formula Bot all competing in the same space. Shortcut AI’s focused scope limits the breadth of innovation compared with platforms that span the full automation landscape. In practice: the platform innovates effectively within its spreadsheet automation niche, but faces increasing competition from AI features being built directly into Google Sheets and Microsoft Excel by their respective platform owners.

    Market Reputation: 5/10

    Shortcut AI has a growing but limited market presence compared with established spreadsheet and automation tools. The platform has received positive coverage in AI tool directories and productivity tool comparison guides, with users highlighting the time savings for data cleaning and analysis tasks. However, the platform’s brand recognition, enterprise adoption metrics, and funding information are less publicly documented than larger competitors. The focused positioning on spreadsheet automation provides clear differentiation, but the narrower scope limits the addressable audience compared with broader platforms. For CRE teams, the smaller market presence may require additional evaluation effort during procurement processes. In practice: Shortcut AI has positive user feedback within its niche but limited broader market visibility, requiring CRE teams to evaluate the platform based on hands-on testing rather than established market reputation.

    9AI Score Card Shortcut AI
    61
    61 / 100
    Emerging Tool
    Spreadsheet Automation
    Shortcut AI
    Shortcut AI automates spreadsheet tasks through natural language, eliminating manual data cleaning and formula work for CRE analysts and underwriters.
    9 Dimensions, Scored 1 to 10
    1. CRE Relevance
    5/10
    2. Data Quality & Sources
    5/10
    3. Ease of Adoption
    8/10
    4. Output Accuracy
    7/10
    5. Integration & Workflow Fit
    6/10
    6. Pricing Transparency
    7/10
    7. Support & Reliability
    6/10
    8. Innovation & Roadmap
    6/10
    9. Market Reputation
    5/10
    BestCRE.com, 9AI Framework v2 Reviewed April 2026

    Who Should Use Shortcut AI

    Shortcut AI is ideal for CRE analysts, underwriters, and operations staff who spend significant time on spreadsheet-based data cleaning, analysis, and reporting. Teams processing incoming rent rolls, operating statements, or property data from multiple sources will benefit from automated data standardization. Underwriting teams that build financial models in Excel can use Shortcut AI to accelerate data preparation and validation steps. Asset managers producing quarterly portfolio reports can automate the data aggregation and formatting that precedes analytical work. The platform is particularly valuable for CRE professionals who understand their data and analytical requirements but lack formula expertise or macro programming skills.

    Who Should Not Use Shortcut AI

    Shortcut AI may not suit CRE teams that need automation spanning multiple systems beyond spreadsheets, as the platform’s scope is limited to Google Sheets and Excel operations. Teams with advanced formula expertise and established macro libraries may find limited incremental value from AI-powered alternatives. Organizations seeking enterprise-grade spreadsheet automation with comprehensive audit trails, compliance certifications, and dedicated support should evaluate more established enterprise tools. CRE firms that primarily need AI for non-spreadsheet tasks like document analysis, market research, or workflow automation should evaluate broader AI platforms instead.

    Pricing and ROI Analysis

    Shortcut AI offers a free tier with usage limits and paid plans with expanded capabilities. The pricing is competitive for spreadsheet-specific AI tools. For CRE teams, the ROI centers on analyst time recovered from manual spreadsheet operations. A CRE analyst spending 12 hours per week on spreadsheet tasks could save 4 to 6 hours through AI-powered automation, representing $200 to $450 in weekly value at analyst compensation rates of $50 to $75 per hour. Monthly savings of $800 to $1,800 against a subscription cost of $15 to $50 per month deliver strong returns. The error prevention value adds additional ROI: reducing the 3 to 5 percent manual entry error rate in financial models prevents costly mistakes that can affect underwriting decisions and investor reporting accuracy.

    Integration and CRE Tech Stack Fit

    Shortcut AI integrates with Google Sheets and Microsoft Excel, the two dominant spreadsheet platforms in CRE operations. The platform operates within these environments, meaning CRE teams continue using their existing spreadsheet templates, models, and data structures. Integration does not extend to CRE-specific platforms, databases, or automation tools directly. For teams that need to connect spreadsheet operations to broader workflows, Shortcut AI can be combined with automation platforms like Zapier or Pipedream that trigger spreadsheet operations based on events in other systems. The platform’s focused scope means it serves as a specialized tool within the CRE technology stack rather than a comprehensive automation platform.

    Competitive Landscape

    Shortcut AI competes with Formula Bot, Google Sheets’ built-in AI features, Microsoft Copilot for Excel, and general-purpose AI assistants used for spreadsheet tasks. Against Formula Bot, Shortcut AI offers broader data operations beyond formula generation. Against Google’s built-in AI and Microsoft Copilot, Shortcut AI provides a focused, cross-platform experience rather than being locked to a single spreadsheet ecosystem. The primary competitive risk is from Google and Microsoft building increasingly capable AI features directly into their spreadsheet products, which could reduce the need for third-party tools. For CRE teams using both Google Sheets and Excel, Shortcut AI’s cross-platform compatibility provides an advantage over platform-specific AI features.

    The Bottom Line

    Shortcut AI addresses one of the most time-consuming aspects of CRE operations: manual spreadsheet work. Its 9AI Score of 61 reflects strong ease of adoption, solid output accuracy for data operations, and direct relevance to spreadsheet-dependent CRE workflows, balanced by limited scope beyond spreadsheet automation and a smaller market presence. For CRE analysts, underwriters, and operations teams who spend hours on data cleaning, formula construction, and report formatting, Shortcut AI provides immediate, measurable time savings within their existing spreadsheet environments.

    About BestCRE

    BestCRE.com is the definitive authority on commercial real estate AI, analysis, and investment intelligence. Every article advances the mission of helping CRE professionals identify, evaluate, and deploy the best technology tools for their operations. We benchmark platforms using the 9AI Framework so CRE leaders can compare tools with clear, evidence-based scoring. Explore the full category map at 20 CRE sectors for deeper coverage across the CRE technology stack.

    Frequently Asked Questions

    Can Shortcut AI clean and standardize CRE rent roll data?

    Shortcut AI can automate common rent roll cleaning tasks including date format standardization, unit type normalization, duplicate row removal, missing value identification, and numeric formatting consistency. A CRE analyst receiving a rent roll with mixed date formats (MM/DD/YYYY, DD-MMM-YY), inconsistent unit labels (1BR, 1-Bed, One Bedroom), and blank cells can describe the cleaning requirements in natural language and have the platform standardize the entire dataset. The tool can also calculate derived fields like rent per square foot, total monthly revenue, and occupancy rates from clean base data. For large rent rolls with hundreds of units across multiple properties, the time savings compared with manual cleaning can be 30 to 60 minutes per file. Users should validate results against source documents for critical financial reporting to ensure accuracy of automated transformations.

    Does Shortcut AI work with Excel-based CRE underwriting models?

    Shortcut AI integrates with Microsoft Excel and can assist with data preparation, analysis, and formatting tasks within Excel-based underwriting models. The platform can populate data fields, calculate intermediate values, generate summary tables, and format output sheets through natural language instructions. However, users should be cautious about applying AI automation to established underwriting models with complex formula interdependencies, as automated modifications could inadvertently affect formula chains or cell references. The recommended approach is to use Shortcut AI for data preparation tasks that feed into the model (cleaning raw data, standardizing inputs, calculating derived values) rather than directly modifying the model’s core formula structure. For new model creation, Shortcut AI can accelerate the construction of data tables, assumption inputs, and output formatting while the user validates the financial logic.

    How does Shortcut AI compare with Microsoft Copilot for Excel?

    Microsoft Copilot for Excel provides AI-powered assistance within the Excel environment, offering formula suggestions, data analysis, and chart generation. Shortcut AI provides similar capabilities but with two key differences. First, Shortcut AI works across both Google Sheets and Excel, providing a consistent experience for CRE teams that use both platforms. Second, Shortcut AI focuses specifically on data operations and automation tasks rather than the broader productivity features that Copilot covers (document drafting, email composition, presentation creation). For CRE teams exclusively using Excel with Microsoft 365, Copilot provides a more integrated experience. For teams using both Google Sheets and Excel, or those wanting a dedicated spreadsheet automation tool with focused capabilities, Shortcut AI provides a cross-platform alternative. Copilot requires a Microsoft 365 subscription ($30 per user per month), while Shortcut AI offers more accessible entry pricing.

    What are the limitations of AI-powered spreadsheet automation for CRE?

    AI-powered spreadsheet automation has several limitations that CRE teams should understand. The AI does not inherently understand CRE financial conventions, meaning calculations like cap rate, DSCR, or IRR need to be described explicitly rather than assumed. Complex multi-tab models with circular references or iterative calculations may confuse AI agents that process data linearly. Formatting preferences that involve CRE-specific conventions (dollar amounts in thousands, percentage formatting, fiscal year alignment) require explicit instructions. The AI may make assumptions about data types, date formats, or calculation methods that differ from the user’s intent, requiring validation of outputs for financial-critical operations. Privacy considerations also apply: CRE teams handling sensitive tenant data or confidential deal information should evaluate the AI platform’s data handling policies before processing such data through external services.

    Can Shortcut AI generate CRE portfolio reports from spreadsheet data?

    Shortcut AI can assist with generating formatted portfolio reports from spreadsheet data, including summary statistics, property-level breakdowns, trend analysis, and formatted output tables. A CRE asset manager could describe requirements like “create a portfolio summary showing total AUM, average occupancy, weighted average cap rate, and NOI by property type, with each property listed below its category with key metrics” and receive a formatted report structure within the spreadsheet. The platform can apply conditional formatting, calculate weighted averages, generate totals and subtotals, and organize data into presentation-ready layouts. For regular quarterly reporting, the same instructions can be reused with updated data, creating a repeatable reporting process. The reports remain within the spreadsheet environment, meaning they can be exported to PDF, shared through Google Sheets links, or copied into presentation decks.

    Related Reviews

    Compare Shortcut AI with other Workflow & Automation tools BestCRE has scored: Yardi Virtuoso (79/100), Cherre (74/100), Lindy AI (58/100) and ReadyAI (56/100). Browse every review in CRE Workflow & Automation, the full Best CRE AI Tools directory, or the 20 CRE Sectors hub.

  • Keyway Review: AI Rent Comps and Underwriting for Multifamily CRE

    Keyway Review: AI Rent Comps and Underwriting for Multifamily CRE

    BestCRE 9AI Score

    72/100 · Contender

    Keyway ranks #189 of 450 commercial real estate AI tools scored on the 9AI Framework. Nine dimensions, each scored out of 10: CRE relevance, data quality, ease of adoption, output accuracy, integration fit, pricing transparency, support, innovation and market reputation.

    Revenue management in multifamily commercial real estate has entered a period of unprecedented complexity. Pricing reflects that complexity. MSCI’s RCA CPPI US report showed apartment prices falling 1.7 percent in June 2026 from a year earlier, the tenth consecutive month of annual declines. Asking rents and net effective rents have diverged in markets with elevated new supply, which means that surface-level rent data increasingly misrepresents actual revenue performance. The National Multifamily Housing Council estimated that the average institutional multifamily operator adjusts rents across 15,000 to 50,000 units monthly, each decision informed by competitive rent comps, concession analysis, and market demand signals that arrive in inconsistent formats from dozens of sources. Unreliable or stale rent comp data remains a persistent frustration for multifamily asset managers, creating a market opportunity for platforms that can deliver real-time, source-verified rental intelligence.

    Keyway is an AI-powered platform designed for multifamily commercial real estate that delivers real-time rent comps, automated T12 and rent roll analysis, and revenue management intelligence. The platform continuously ingests public listings, property websites, and MLS/ILS data, then normalizes rent, unit mix, and concession language using domain-specific models built specifically for the multifamily sector. Keyway has attracted institutional adoption from firms including Blackstone, Brookfield, and Goldman Sachs, positioning it as a serious contender in the CRE AI landscape. The platform’s core products, the T12 Analyzer and Rent Roll Analyzer, use machine learning to transform unstructured financial documents into standardized, enriched data suitable for underwriting and asset management workflows.

    Under BestCRE’s 9AI evaluation framework, Keyway earns a score of 72 out of 100, placing it in the “Solid Platform” category. The tool’s real-time rent comp engine, institutional client roster, and multifamily-specific AI models demonstrate genuine CRE value, while limited pricing transparency and integration breadth constrain its overall score.

    This review is part of BestCRE’s systematic coverage of commercial real estate AI tools across 20 CRE sectors. For the full AI tools directory, see our Best CRE AI Tools hub.

    What Keyway Does and How It Works

    Keyway addresses the multifamily sector’s most persistent data challenge: the gap between the volume of rental market data available across disparate sources and the ability of acquisitions and asset management teams to synthesize that data into actionable intelligence. The platform operates across three primary workflow areas: real-time rent comp generation, financial document analysis, and revenue management support.

    The rent comps engine forms Keyway’s most distinctive capability. The platform continuously monitors public listing sources, property websites, and MLS/ILS feeds, ingesting rental data as it appears and normalizing it using domain-specific machine learning models. This normalization process is critical because raw listing data is notoriously inconsistent: one property advertises “1BR from $1,450” while a competitor lists “1BR/1BA 650sf $1,525 with 6 weeks free.” Keyway’s models parse these variations, calculate net effective rents, standardize unit type classifications, and produce comparable datasets that acquisitions teams can use directly in underwriting models. The platform also tracks concession activity, identifying trends in free rent offers, reduced security deposits, and other incentives that affect actual revenue performance but rarely appear in traditional comp databases.

    The T12 Analyzer and Rent Roll Analyzer constitute Keyway’s document intelligence capabilities. These tools accept PDF uploads of trailing 12-month operating statements and rent rolls, applying AI extraction to identify and structure the data within each document. The T12 Analyzer maps revenue and expense line items to standardized categories, reconciles figures across different presentation formats, and flags anomalies that may warrant further investigation during underwriting. The Rent Roll Analyzer extracts unit-level detail including current rents, market rents, lease dates, occupancy status, and tenant information, normalizing the output regardless of the property management system that generated the source document.

    KeyBrain, the platform’s AI intelligence layer, synthesizes data from rent comps, document analysis, and market signals to provide strategic insights for revenue management and acquisitions decisions. This capability moves Keyway beyond pure data extraction into analytical intelligence, offering recommendations on rental pricing, market positioning, and investment timing based on the platform’s aggregated view of multifamily market conditions. For institutional operators managing thousands of units across multiple markets, this analytical layer transforms scattered data into a coherent revenue strategy.

    9AI Framework: Dimension-by-Dimension Analysis

    CRE Relevance: 9/10

    Keyway is built exclusively for commercial real estate, with a specific focus on multifamily that gives it exceptional depth in the sector’s most active asset class. The platform’s rent comp engine, document analyzers, and revenue management capabilities address the core workflows of multifamily acquisitions, underwriting, and asset management. Keyway’s AI models are trained on real estate data exclusively, understanding the nuances of concession structures, unit mix analysis, and the relationship between asking rents and net effective rents that define multifamily revenue performance. The company’s go-to-market strategy, conference presence, and content marketing are entirely oriented toward CRE professionals. The only reason this dimension does not score a perfect 10 is the platform’s current limitation to multifamily, which excludes office, industrial, retail, and specialty property types from its coverage. In practice: Keyway is deeply CRE-relevant within multifamily, with domain understanding that reflects genuine expertise rather than superficial market positioning.

    Data Quality and Sources: 8/10

    Keyway’s rent comp data quality benefits from its continuous ingestion of public listings, property websites, and MLS/ILS feeds, creating a real-time view of rental market conditions that traditional quarterly survey-based approaches cannot match. The platform’s domain-specific normalization models resolve the inconsistencies that make raw listing data unreliable: standardizing unit types, calculating net effective rents from gross rents and concession packages, and mapping listings to a consistent geographic and unit-type taxonomy. This normalization process is where Keyway’s CRE-specific AI training shows its value, as generic data tools would struggle with the variability and implicit assumptions in multifamily listing language. The T12 and Rent Roll Analyzer products deliver reliable extraction from financial documents, though accuracy depends on document quality and format complexity. The primary data quality limitation is source dependency: Keyway’s rent comps are only as current and complete as the public listing data available in each market. In practice: Keyway’s rent comp data quality exceeds what most acquisitions teams can produce through manual research, with real-time updates providing a meaningful advantage in fast-moving markets.

    Ease of Adoption: 7/10

    Keyway operates as a cloud-based SaaS platform accessible through a web interface, eliminating infrastructure requirements and reducing technical barriers to adoption. The document analysis tools accept standard PDF uploads, and the rent comp engine provides results through an intuitive search and comparison interface. For multifamily acquisitions teams and asset managers, the workflow is straightforward: upload a rent roll or T12, receive structured data; search for rent comps by market and unit type, receive normalized comparisons. The platform’s focus on multifamily means that users encounter real estate-specific terminology and workflows throughout the interface, reducing the translation effort required with generic tools. Onboarding typically involves platform orientation and configuration of market and portfolio preferences. The primary adoption friction is the custom pricing model, which requires sales engagement before teams can evaluate the platform, and the learning curve associated with understanding how Keyway’s rent comp methodology differs from traditional approaches. In practice: multifamily teams can achieve value quickly once subscribed, but the evaluation phase requires more effort than self-service tools.

    Output Accuracy: 8/10

    Keyway’s output accuracy is strong across its core capabilities. The rent comp engine benefits from its domain-specific normalization models, which produce more reliable net effective rent calculations than manual research by consistently accounting for concessions, free rent periods, and other adjustments that human researchers may miss or calculate inconsistently. The T12 and Rent Roll Analyzer products achieve high extraction accuracy for standard multifamily financial documents, with the platform’s models trained to recognize the formatting conventions of major property management systems. The institutional client roster (Blackstone, Brookfield, Goldman Sachs) provides indirect validation of output quality, as these firms’ underwriting standards demand reliable data inputs. The primary accuracy consideration is that rent comp data reflects publicly available listing information, which may not capture privately negotiated deals or insider concession structures. In practice: Keyway’s outputs are accurate enough for institutional underwriting and asset management workflows, with the rent comp normalization providing particular value over manual alternatives.

    Integration and Workflow Fit: 6/10

    Keyway provides data export capabilities and API access for integrating rent comp data and document analysis outputs into downstream workflows. The platform’s structured outputs can feed into Excel-based underwriting models, deal management platforms, and portfolio analytics systems. However, Keyway does not offer native connectors to the CRE technology stack’s core platforms: Yardi Voyager, MRI Software, RealPage, Argus Enterprise, or popular deal management tools like Dealpath and Juniper Square. Building automated data pipelines between Keyway and these platforms requires custom API development. The platform’s position as a specialized data and analytics layer means it complements rather than replaces existing property management and underwriting tools, but the integration work required to connect Keyway’s outputs to operational systems falls on the adopting firm. In practice: Keyway’s data is valuable but requires manual or custom integration work to flow into the broader CRE technology stack, limiting its efficiency for firms seeking fully automated workflows.

    Pricing Transparency: 4/10

    Keyway does not publish pricing on its website, and subscription costs are determined through direct sales engagement. The platform’s enterprise focus and institutional client base suggest pricing in the thousands to tens of thousands of dollars per month range, though specific figures are not publicly available. The custom pricing model is common among CRE-specific platforms but creates evaluation friction for potential buyers who cannot assess cost-effectiveness before engaging with the sales process. For acquisitions teams considering Keyway alongside alternatives like CoStar, CompStak, or Reonomy, the inability to compare pricing without multiple sales conversations adds time and complexity to the procurement process. The platform does not offer a freemium tier or self-service trial, which means teams must commit to the evaluation process before experiencing the product’s capabilities firsthand. In practice: Keyway’s pricing is fully opaque, requiring formal sales engagement before any cost information is disclosed.

    Support and Reliability: 7/10

    Keyway provides customer support commensurate with its enterprise positioning, including onboarding assistance, account management, and technical support. The company’s team includes CRE professionals who understand multifamily workflows, which means support interactions are domain-relevant and productive. The platform’s cloud infrastructure delivers consistent availability, and data refresh cycles for rent comps are frequent enough to maintain the real-time positioning that differentiates the platform. The institutional client roster suggests that Keyway’s support meets the requirements of sophisticated CRE operators, though specific SLA guarantees, uptime metrics, and support tier details are not publicly documented. The company’s relatively early stage (compared to established platforms like CoStar or Yardi) means that the support organization is smaller, which could affect response times during high-demand periods. In practice: support is CRE-knowledgeable and responsive, with the institutional client base providing indirect validation of service quality.

    Innovation and Roadmap: 8/10

    Keyway demonstrates strong innovation in its approach to multifamily data intelligence. The real-time rent comp engine represents a meaningful departure from the traditional quarterly survey model, providing acquisitions and asset management teams with current market data rather than lagged snapshots. The domain-specific normalization models that parse listing language, calculate net effective rents, and standardize concession data reflect significant AI development investment tailored to multifamily’s specific data challenges. KeyBrain’s analytical layer moves the platform beyond data processing into strategic intelligence, an evolution that few CRE AI tools have achieved. The company’s presence in Commercial Observer and CRE trade publications indicates active thought leadership and industry engagement. The platform’s expansion potential into adjacent CRE sectors (office, industrial, retail) represents a clear growth pathway, though executing this expansion while maintaining the multifamily depth that attracted institutional clients will require careful prioritization. In practice: Keyway’s innovation is well-directed and differentiated, with the real-time rent comp capability representing a genuine competitive moat in multifamily data intelligence.

    Market Reputation: 8/10

    Keyway has established credibility with some of the largest institutional names in commercial real estate. The company’s client roster, which includes Blackstone, Brookfield, and Goldman Sachs, represents the highest tier of institutional validation available in the CRE market. These firms’ adoption signals that Keyway’s data quality and analytical capabilities meet the standards of the industry’s most sophisticated operators. The company’s CEO has been featured in Commercial Observer and other CRE trade publications, building brand awareness among the institutional investor and operator communities. However, Keyway remains a relatively young company compared to established platforms like CoStar or CompStak, and its brand recognition among mid-market CRE firms is more limited. The company has not disclosed specific funding details or user metrics that would provide broader market context. In practice: Keyway’s institutional client roster provides powerful credibility, but the platform’s broader market awareness is still developing beyond the top tier of institutional CRE.

    9AI Score Card KEYWAY
    72
    72 / 100
    Solid Platform
    Rent Comps & Underwriting
    Keyway
    AI-powered real-time rent comps, T12 analysis, and revenue management intelligence for multifamily CRE, trusted by Blackstone, Brookfield, and Goldman Sachs.
    9 Dimensions, Scored 1 to 10
    1. CRE Relevance
    9/10
    2. Data Quality & Sources
    8/10
    3. Ease of Adoption
    7/10
    4. Output Accuracy
    8/10
    5. Integration & Workflow Fit
    6/10
    6. Pricing Transparency
    4/10
    7. Support & Reliability
    7/10
    8. Innovation & Roadmap
    8/10
    9. Market Reputation
    8/10
    BestCRE.com, 9AI Framework v2 Reviewed April 2026

    Who Should Use Keyway

    Keyway is best suited for institutional multifamily investors, acquisitions teams, and asset managers who need real-time rent comp data and automated document analysis at scale. Firms evaluating 20 or more multifamily deals per month will benefit most from the T12 and Rent Roll Analyzer tools, which eliminate hours of manual data extraction per deal. Asset management teams responsible for revenue optimization across large multifamily portfolios will find the real-time rent comp engine particularly valuable for monitoring competitive positioning and identifying pricing opportunities. Private equity real estate funds, multifamily REITs, and institutional operators seeking to differentiate their underwriting speed and analytical depth represent Keyway’s core customer profile. The platform’s institutional client roster (Blackstone, Brookfield, Goldman Sachs) signals that it meets the data quality and analytical standards required by the industry’s most demanding operators.

    Who Should Not Use Keyway

    CRE firms focused primarily on property types other than multifamily will find Keyway’s current capabilities less relevant. Small multifamily operators managing portfolios of fewer than 200 units may not generate sufficient deal flow or revenue management complexity to justify the enterprise subscription cost. Firms seeking a comprehensive CRE data platform that covers all property types, markets, and analytical needs should consider CoStar or CompStak as broader alternatives. Teams that need a simple, self-service document extraction tool without revenue management analytics may find specialized extractors like QuickData.ai or Docsumo more appropriate and cost-effective for their specific use case.

    Pricing and ROI Analysis

    Keyway does not publish pricing, and subscription costs require direct sales engagement. The platform’s institutional positioning and client roster suggest enterprise pricing in the range common for specialized CRE data tools. The ROI case for Keyway spans two value streams. First, document automation: if the T12 and Rent Roll Analyzers save 30 minutes per deal and a firm evaluates 40 deals monthly, the annual time savings is approximately 240 hours, valued at $12,000 to $18,000 at typical analyst costs. Second, revenue optimization: if the rent comp engine helps an asset management team identify pricing opportunities that improve effective rents by even 0.5% across a 5,000-unit portfolio with average monthly rents of $1,500, the annual revenue impact is $450,000. The combination of operational efficiency gains and revenue optimization potential creates a compelling ROI case for institutional operators, though the lack of published pricing makes it impossible to calculate specific payback periods without entering the sales process.

    Integration and CRE Tech Stack Fit

    Keyway provides API access and data export capabilities for connecting its rent comp data and document analysis outputs to downstream systems. The platform’s structured outputs can feed into Excel-based underwriting models, revenue management dashboards, and portfolio analytics tools. However, native integrations with CRE-specific platforms (Yardi, MRI, RealPage, Argus, Dealpath) are not prominently featured, and connecting Keyway to these systems requires custom API development. For firms using Excel as their primary underwriting environment, Keyway’s data exports integrate naturally into existing workflows. The platform complements rather than replaces existing property management and market data tools, serving as a specialized layer for real-time rent intelligence and document automation that enhances the broader technology stack.

    Competitive Landscape

    Keyway competes in the multifamily data intelligence space against several established and emerging platforms. CoStar provides broader market coverage but with less multifamily-specific depth in real-time rent comp analysis. CompStak offers exchange-based lease comp data with strong granularity in specific markets. RealPage’s Market Analytics (formerly MPF Research) provides multifamily-specific analytics from a different methodological approach. For document extraction specifically, Docsumo and QuickData.ai offer competing capabilities without the revenue management analytics. Keyway’s differentiators are the real-time rent comp engine with domain-specific normalization, the combination of data extraction and analytical intelligence in a single platform, and the institutional credibility conferred by its client roster. The platform occupies a distinctive position as a multifamily-focused alternative to broader CRE data platforms.

    The Bottom Line

    Keyway earns a 9AI score of 72 out of 100, reflecting its strong multifamily-specific capabilities and institutional validation. The platform’s real-time rent comp engine addresses a genuine market need, its document analyzers compete effectively with dedicated extraction tools, and the institutional client roster (Blackstone, Brookfield, Goldman Sachs) provides credibility that few CRE AI startups can match. The score is moderated by pricing opacity, limited integration breadth, and the current restriction to multifamily as the primary asset class. For multifamily acquisitions teams and asset managers seeking AI-powered rent intelligence that goes beyond traditional comp databases, Keyway represents a compelling platform that combines data processing with analytical insight in ways that the broader CRE data landscape has not yet replicated.

    About BestCRE

    BestCRE.com is the definitive authority on commercial real estate AI, analysis, and investment intelligence. Our coverage spans 20 CRE sectors with institutional-quality research designed for practitioners, investors, and operators navigating the intersection of technology and commercial real estate. Every review, analysis, and market report is built on primary data, independent evaluation, and a commitment to advancing the CRE industry’s understanding of where AI creates genuine value and where it falls short.

    Frequently Asked Questions

    How does Keyway’s rent comp data differ from CoStar or CompStak?

    Keyway’s rent comp data differs from CoStar and CompStak in methodology, timeliness, and scope. CoStar relies primarily on a research team of 2,000+ analysts who verify property data through direct outreach, producing highly accurate but periodically updated information. CompStak operates on a broker exchange model where professionals contribute verified lease comp data in exchange for access to the broader database. Keyway takes a different approach: continuously ingesting public listing data, property websites, and MLS/ILS feeds in real time, then normalizing this data using AI models trained specifically on multifamily rental language. This methodology provides more current data (updated as listings change rather than on survey cycles) but covers a different data layer (asking rents and publicly available information rather than executed lease terms). For multifamily asset managers tracking competitive positioning and market pricing trends, Keyway’s real-time approach provides faster market intelligence than quarterly surveys, though it may not capture privately negotiated terms that CompStak’s exchange model does.

    What institutional clients use Keyway?

    Keyway has disclosed working relationships with Blackstone, Brookfield, and Goldman Sachs, three of the largest institutional investors in commercial real estate globally. These firms collectively manage hundreds of billions of dollars in real estate assets and represent the highest tier of institutional validation available in the CRE market. Blackstone is the world’s largest owner of commercial real estate with approximately $300 billion in real estate assets under management. Brookfield Asset Management manages over $100 billion in real estate assets globally. Goldman Sachs’ real estate division manages institutional capital across multiple strategies. The adoption of Keyway by these firms signals that the platform’s data quality, analytical capabilities, and security standards meet the requirements of the industry’s most sophisticated operators. Additional client details beyond these named relationships have not been publicly disclosed.

    Can Keyway analyze T12 operating statements from any property management system?

    Keyway’s T12 Analyzer is designed to handle operating statements from a wide range of property management systems and presentation formats. The AI extraction models are trained on multifamily financial documents generated by Yardi, RealPage, AppFolio, Entrata, and other property management platforms, as well as manually prepared spreadsheets and custom accounting system outputs. The analyzer handles variations in line item terminology (one property manager’s “Repairs and Maintenance” versus another’s “Building Maintenance”), presentation structure (monthly columns versus quarterly summaries, actual versus budget comparisons), and formatting (native PDFs, scanned documents, Excel exports). The platform standardizes extracted data into a consistent category structure regardless of the source format, which is particularly valuable when comparing T12s across multiple properties that use different management companies. Accuracy may vary for highly unusual or non-standard T12 formats, but the core models cover the presentation styles encountered in the vast majority of institutional multifamily transactions.

    Does Keyway cover property types beyond multifamily?

    Keyway currently focuses primarily on the multifamily sector, which the company has identified as the vertical best positioned to benefit from AI-driven underwriting and revenue management due to the sector’s scale, data intensity, and margin sensitivity. The platform’s rent comp engine, document analyzers, and revenue management capabilities are all optimized for multifamily-specific workflows and data patterns. As of this review, Keyway has not announced expansion into office, industrial, retail, or specialty property types. The company’s leadership has discussed the potential for broader CRE coverage in industry publications, suggesting that multi-sector expansion is on the roadmap, but no specific timeline or product announcements have been made. For firms seeking AI-powered data intelligence across multiple property types, broader platforms like CoStar, Cherre, or Reonomy provide multi-sector coverage, though without Keyway’s depth of multifamily-specific analytical capabilities.

    How quickly does Keyway update its rent comp data?

    Keyway’s rent comp engine updates continuously, ingesting new listing data from public sources, property websites, and MLS/ILS feeds as it appears. This real-time approach contrasts with traditional rent comp methodologies that rely on quarterly surveys, broker submissions, or periodic research team updates. For multifamily markets with high listing turnover, such as growing sunbelt metros where new supply is being absorbed, the real-time data provides a more current view of competitive pricing, concession trends, and market positioning than periodic survey-based approaches. The frequency of updates varies by market and data source: major markets with active listing environments receive near-continuous data refresh, while smaller markets with less listing activity may update less frequently simply because new data points appear less often. The platform’s normalization models process new data as it arrives, recalculating net effective rents and concession analyses to reflect the most current market conditions available from public sources.

    Related Reviews

    Compare Keyway with other Workflow & Automation tools BestCRE has scored: Yardi Virtuoso (79/100), Cherre (74/100), Relay.app (61/100) and Shortcut AI (61/100). Browse every review in CRE Workflow & Automation, the full Best CRE AI Tools directory, or the 20 CRE Sectors hub.

PRIME 7.00%FED FUNDS 3.88%5-YR UST 4.64% ▲10-YR UST 4.86% ▲SOFR 30D 3.91%Updated Nov 10, 2026
Talk to a CRE Capital Advisor
Sizing a deal? | Curated capital network Tell Us About Your Deal (307) 439-0410