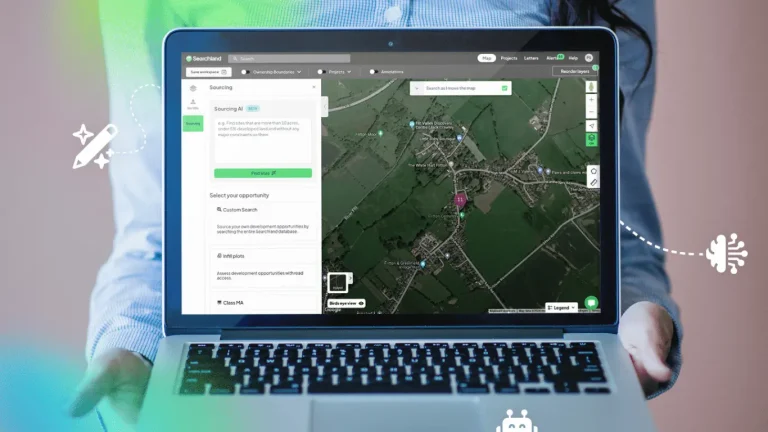
LandVision is a map-based commercial real estate application owned by LightBox, categorized in the BestCRE Master Database as a Tier 2 CRE-Native tool specifically built for CRE Acquisitions. The primary use case centers on aggregating parcel boundaries, zoning records, sales comps, flood zone maps, and aerial imagery into a single interface for site selection. For a commercial real estate principal or acquisitions analyst, the platform functions as a spatial aggregator. Instead of pulling tax records from a county assessor, flood data from FEMA, and ownership details from a separate public records provider, users query this data geographically. Our analysis indicates that the platform’s core utility lies in its ability to visually represent disparate property datasets, allowing acquisition teams to identify off-market parcels that fit specific development or investment criteria.
Evaluating LandVision requires understanding its position within the broader property data ecosystem. As of August 2026, the software serves as a foundational research layer rather than an automated deal-finding algorithm. The interface relies heavily on the user’s ability to manipulate map layers and filter criteria effectively. While it excels at visualizing spatial constraints like wetlands or complex zoning overlays, it demands a competent operator to extract meaningful insights. The tool does not underwrite the deal or predict seller motivation; rather, it provides the factual groundwork required to initiate a targeted outreach campaign. Buyers expecting a proactive recommendation engine will be disappointed, but those seeking a comprehensive, map-first property database will find the consolidated layers highly practical for daily site selection workflows.
What LandVision does and how it works
At its core, LandVision operates as a geographic information system tailored specifically for commercial real estate professionals. The primary interface is a highly interactive map where users toggle various data layers on and off. When an analyst logs in, they begin by defining a target geography—ranging from a broad metropolitan statistical area down to a specific street corner. From there, they activate layers such as parcel boundaries, current zoning designations, historical sales comps, and environmental hazards like flood zones. The software overlays these datasets onto high-resolution aerial imagery, allowing the user to visually inspect the physical characteristics of a site alongside its legal and transactional history.
The filtering mechanics represent the engine driving the site selection process. An acquisitions team can execute complex queries, such as isolating all commercially zoned parcels between two and five acres, located outside of the flood plain, that have not transacted in the last ten years. Once the software returns the matching parcels, users can click into individual records to view detailed property cards. These cards display ownership information, assessed values, building characteristics, and tax history. Our analysis shows that this capability significantly reduces the time spent cross-referencing municipal databases.
Finally, the platform includes tools for annotation, routing, and exporting. Users can draw custom polygons to measure usable acreage, calculate setbacks, or define custom trade areas. The resulting data can be exported into standard formats for integration into external underwriting models or CRM systems. Additionally, the software generates standardized site profile reports that summarize the layered data into a printable format for investment committee memos. The mechanics are strictly utilitarian, focusing on data retrieval and spatial analysis rather than predictive modeling.
9AI Framework: the score, dimension by dimension
CRE Relevance: 9/10
LandVision is fundamentally designed for the commercial real estate sector, earning its classification as a Tier 2 CRE-Native application. Every feature, from zoning overlays to sales comps and parcel boundaries, directly serves the daily workflows of acquisitions teams and site selectors. The platform does not attempt to serve residential agents or general enterprise sales teams; its architecture is strictly aligned with commercial property research. The inclusion of specialized layers like flood zones and detailed ownership records demonstrates a deep understanding of what a CRE principal requires before committing capital to a site. Our analysis confirms that the tool’s focus remains tightly bound to commercial asset classes and land development. In practice: Acquisitions analysts use this platform daily to map out specific trade areas and identify off-market commercial parcels that meet strict zoning and environmental criteria.
Data Quality and Sources: 8/10
The integrity of a mapping tool relies entirely on its underlying datasets, and LandVision performs strongly in this category. By aggregating information from municipal tax assessors, environmental agencies, and proprietary LightBox databases, the software provides a highly reliable picture of property characteristics. The parcel boundaries are generally precise, and the sales comps and ownership records are updated with sufficient frequency for standard acquisitions work. However, our analysis notes that because the platform relies on county-level reporting, data latency can occur in slower-moving or rural municipalities. Zoning data, while extensive, occasionally requires manual verification with the local city planner for complex overlay districts. In practice: Users can confidently rely on the platform for initial site screening and ownership lookups, but must still perform municipal verification during the formal due diligence period.
Ease of Adoption: 7/10
Deploying a GIS-based application inherently introduces a learning curve for teams accustomed to simple tabular databases. LandVision requires users to understand how to manipulate map layers, apply complex spatial filters, and navigate a dense interface. While the menu structures are logical, new analysts often require dedicated training sessions to master the more advanced drawing and querying tools. The platform does not offer a consumer-grade, plug-and-play experience; it is a professional-grade analytical instrument. Fortunately, the standard workflows for pulling comps or checking flood zones are straightforward enough that most users can execute basic tasks within their first week. In practice: Principals should expect to allocate several days of guided training for new analysts to ensure they can independently execute complex, multi-variable site selection queries.
Output Accuracy: 8/10
When generating site reports or exporting parcel lists, the software consistently delivers precise and correctly formatted data. The calculations for acreage, building square footage, and spatial measurements drawn directly on the map are highly dependable. Our analysis indicates that the geocoding engine accurately places property pins, which is critical when evaluating tight urban infill locations. The platform rarely suffers from the formatting errors or misaligned data fields that plague lower-tier property aggregators. If an analyst exports a list of fifty parcels with their associated ownership entities and tax histories, the resulting spreadsheet requires minimal data cleaning. In practice: Analysts can pull site profile reports and drop them directly into investment committee memos without having to manually recalculate lot dimensions or reformat the ownership tables.
Integration and Workflow Fit: 7/10
As a product within the LightBox ecosystem, LandVision benefits from shared infrastructure with other LightBox assets, but its external integration capabilities are functional rather than exceptional. The platform allows users to export data via CSV or shapefiles, which can then be uploaded into a CRM, underwriting model, or external GIS software like ArcGIS. However, native, two-way API connections to common commercial real estate CRMs are limited. Users typically operate the software as a standalone research environment rather than a deeply embedded component of their tech stack. Our analysis shows that while the export functions are reliable, the lack of automated data syncing requires manual data transfer protocols. In practice: Acquisitions teams will need to manually export target parcel lists from the map and upload them into their outreach platforms to initiate contact campaigns.
Pricing Transparency: 3/10
Following the BestCRE 9AI Framework guidelines, tools that do not publish their pricing publicly are heavily penalized in this dimension. LandVision operates on a strictly paid model, but the specific costs, tier structures, and user license fees are not published on their public-facing website. Prospective buyers are required to submit their contact information and engage with a sales representative to receive a custom quote. Our analysis indicates that pricing likely scales based on the geographic coverage required—such as a single state versus national access—and the number of active seats. This opaque approach prevents principals from qualifying the software against their budget prior to a sales call. In practice: Evaluating analysts must schedule a demonstration and undergo a formal sales process simply to determine if the platform aligns with their annual technology budget.
Support and Reliability: 8/10
Backed by LightBox, a major corporate entity in the commercial real estate data sector, the software benefits from an established and highly reliable support infrastructure. Users have access to comprehensive documentation, video tutorials, and a dedicated customer success team. Our analysis confirms that the platform experiences minimal downtime, and the map rendering speeds remain consistent even when loading dense datasets across large metropolitan areas. Support tickets are generally addressed within standard business hours, and enterprise clients often receive dedicated account management. The institutional backing ensures that the product is maintained securely and that critical bugs are patched promptly. In practice: When an analyst encounters a mapping error or requires assistance building a complex spatial filter, they can depend on responsive technical support to resolve the issue quickly.
Innovation and Roadmap: 7/10
The development trajectory for LandVision focuses on incremental enhancements to its data layers and user interface rather than radical shifts in functionality. As part of LightBox, the platform benefits from the parent company’s ongoing acquisitions of specialized data providers, which periodically results in new environmental or demographic layers being added to the map. However, our analysis suggests that the core user experience has remained relatively static, prioritizing stability and data depth over experimental features. While the roadmap includes steady improvements to mobile accessibility and reporting templates, buyers should not expect rapid deployments of experimental generative artificial intelligence tools. In practice: Users are investing in a stable, proven mapping environment that will slowly expand its data coverage rather than a rapidly pivoting software platform.
Market Reputation: 9/10
Within the commercial real estate acquisitions and development community, LandVision holds a highly respected position. It is widely recognized as a standard-bearer for parcel mapping and site selection, frequently utilized by institutional brokerages, regional developers, and national retailers. Our analysis shows that the platform is often a prerequisite skill listed in job descriptions for GIS analysts and acquisitions associates. The LightBox brand carries significant weight, and the software is trusted to deliver the foundational data required for high-stakes land purchases. It competes effectively against established peers, maintaining a loyal user base that values its specific focus on spatial property data. In practice: Principals view the software as a safe, institutional-grade investment that brings immediate credibility to their internal site selection and off-market deal sourcing operations.
Who should use LandVision
The platform is optimized for professionals who rely heavily on spatial data and geographic constraints to source opportunities.
- Acquisitions analysts at development firms who need to identify off-market land parcels based on specific zoning and acreage requirements.
- Retail site selectors evaluating new locations by analyzing trade areas, traffic patterns, and competitor proximity on a map.
- Commercial brokers specializing in land sales who require accurate parcel boundaries, ownership data, and flood zone maps to pitch properties.
- Investment principals conducting high-level market research to understand the density and development potential of a new target MSA.
Who should look elsewhere
Users seeking automated deal flow or simple tabular databases will find the map-heavy interface unnecessary and overly complex.
- Leasing brokers focused solely on tenant representation within existing office buildings, as parcel boundaries offer little utility.
- Passive investors looking for a marketplace of actively listed properties to purchase, rather than a research tool for off-market outreach.
- Small residential investors who do not require complex commercial zoning overlays or environmental hazard maps.
Pricing and ROI
Pricing details for LandVision are not published on the vendor’s website. The platform operates on a paid subscription model, requiring prospective buyers to engage directly with the LightBox sales team to obtain a customized quote. Based on our analysis of similar Tier 2 CRE-Native platforms in the market, pricing typically scales according to the geographic footprint required—ranging from single-county or state-level access up to full national coverage—as well as the total number of user licenses. Buyers should anticipate an annual contract structure rather than a month-to-month arrangement.
To justify the unlisted cost, principals must evaluate the return on investment through the lens of time saved and deals sourced. If an acquisitions analyst currently spends fifteen hours a week manually cross-referencing county tax assessor websites, municipal zoning maps, and FEMA flood portals, consolidating these tasks into a single interface yields immediate labor savings. Assuming an analyst’s fully burdened cost is $60 per hour, saving ten hours a week generates $31,200 in annual productivity gains. Furthermore, the ROI is ultimately realized when the spatial filtering capabilities uncover a single off-market parcel that leads to a successful acquisition. A single closed transaction sourced through the platform’s ownership data will typically cover the cost of a multi-year enterprise subscription.
Integration and CRE tech stack fit
Integrating LandVision into an existing commercial real estate technology stack requires a deliberate approach, as the platform primarily functions as an independent research environment. The software allows users to export their queried data, including parcel lists, ownership details, and property characteristics, into standard CSV files or GIS shapefiles. Our analysis indicates that this manual export process is the standard method for moving data from the map into an external underwriting model or a customer relationship management system.
For teams utilizing platforms like Salesforce or specialized CRE outreach tools, analysts must build a workflow where target properties are identified geographically, exported in bulk, and then uploaded to initiate direct mail or cold-calling campaigns. While it resides within the LightBox suite, its connections to third-party applications lack the automated, two-way API syncing found in some modern proptech tools. Consequently, buyers must ensure their analysts are disciplined in maintaining data hygiene when transferring ownership records from the mapping interface into their primary deal-tracking software. The fit is functional, but it relies on manual data pipelines rather than automated integrations.
Competitive landscape
The landscape for CRE Acquisitions software is highly competitive, and LandVision sits within a crowded field of property data aggregators. When comparing map-based off-market research tools, PropertyRadar (scored 79) serves as a direct alternative, offering strong public records and ownership data with highly transparent pricing, though LandVision generally provides deeper commercial zoning and environmental layers. ProspectNow (scored 80) is another frequent comparison; while ProspectNow excels in predictive analytics and identifying properties likely to sell or refinance, LandVision maintains a superior spatial interface for complex site selection constraints.
For teams focused on active listings rather than off-market research, platforms like Crexi (scored 84) and LoopNet (scored 76) provide traditional marketplaces. However, these tools serve a fundamentally different purpose, acting as disposition platforms rather than the foundational parcel research environments that LightBox provides. CityBldr (scored 79) targets a similar acquisitions audience but applies algorithmic modeling to identify highest-and-best-use development opportunities, whereas LandVision relies on the user to manually interpret the map layers. Finally, REIS (scored 77) offers deep macroeconomic and submarket rent data, which complements rather than replaces the parcel-level granularity found here. Ultimately, our analysis shows that LandVision remains the premier choice for buyers who require a strict, map-first approach to analyzing physical site constraints, zoning, and ownership.
The bottom line
LandVision is a mandatory evaluation for any commercial real estate acquisitions team that relies on spatial data to source off-market deals. If your primary workflow involves identifying vacant land, analyzing complex zoning overlays, or avoiding environmental hazards, this platform provides the necessary infrastructure. It is not an automated deal-finding engine, nor is it a marketplace for active listings; it is a professional-grade geographic information system built specifically for commercial property research. Principals should authorize the purchase if their analysts are currently losing hours each week navigating disjointed county assessor websites and municipal maps. However, firms seeking predictive analytics to gauge seller motivation, or those requiring transparent, self-serve pricing, should look toward competing platforms. For dedicated site selection and parcel-level due diligence, the software delivers highly reliable data and remains a foundational tool for institutional deal sourcing.
Frequently asked questions
Does LandVision provide contact information for property owners?
Yes, the platform provides ownership records tied to parcel data, often including the mailing addresses for the owning entities. However, identifying the actual decision-maker behind an LLC usually requires cross-referencing the provided entity name with state corporate registry databases or utilizing a specialized skip-tracing tool.
Can I view active commercial real estate listings on the map?
The software is primarily designed for researching off-market properties, parcel boundaries, and public records. While it may display some transaction data and comps, buyers seeking a comprehensive marketplace of active commercial listings should utilize dedicated disposition platforms like Crexi or LoopNet.
How often are the sales comps and ownership records updated?
Data refresh rates depend heavily on the specific municipality, as the platform aggregates public records from county assessors and local governments. In major metropolitan statistical areas, updates occur frequently, but users researching rural or slower-moving counties may experience latency in recent transaction data.
Is there a mobile application available for site visits?
Yes, the platform includes mobile capabilities that allow users to access property data, view parcel boundaries, and capture photos or notes while physically touring a site. This mobile access is particularly useful for retail site selectors and developers conducting preliminary field research.
Does the software integrate directly with Salesforce?
The platform does not natively feature a plug-and-play, two-way API sync with Salesforce. Users typically build their target lists within the mapping interface and manually export the data as a CSV file, which is then uploaded into Salesforce or other CRM systems for outreach campaigns.
Can I draw custom trade areas to analyze demographics?
Yes, the interface includes drawing tools that allow analysts to create custom polygons, radius rings, or drive-time boundaries. Once a custom trade area is defined on the map, users can generate demographic and site profile reports specific to that exact geographic footprint.