Category: CRE Market Analytics & Data

  • ReportAll USA Review: Nationwide parcel data for maps and applications

    ReportAll USA Review: Nationwide parcel data for maps and applications

    BestCRE 9AI Score

    69/100 · Niche

    ReportAll USA ranks #321 of 528 commercial real estate AI tools scored on the 9AI Framework. Nine dimensions, each scored out of 10: CRE relevance, data quality, ease of adoption, output accuracy, integration fit, pricing transparency, support, innovation and market reputation.

    ReportAll USA is a property data provider built primarily for software teams, GIS departments, analysts, and other users that need parcel boundaries and associated records across the United States. Within a commercial real estate workflow, it changes how teams acquire, standardize, map, and distribute parcel information. Instead of assembling county files individually, a buyer can obtain a national layer or connect an application directly to ReportAll’s data services. That makes the product most relevant before underwriting, during site identification, and anywhere parcel geometry must be displayed alongside other property intelligence.

    The company is CRE adjacent rather than a complete CRE analytics platform. Parcel boundaries are foundational to acquisition screening, development analysis, ownership research, portfolio mapping, and site selection, but they do not answer the full investment question. ReportAll does not replace rent comparables, sales comparables, debt data, tenant intelligence, operating statements, or valuation models. Its role is narrower and more infrastructural: supplying a standardized parcel layer that another application, map, or analytical process can use as its geographic base.

    ReportAll offers several delivery methods rather than forcing every customer into the same interface. Its National Parcel Layer serves enterprise licensing requirements, its Feature Service supports Esri environments, and its API is intended for incorporation into third party technology. Buyers can also use ReportAll Online, purchase county or state files from the Data Store, or display parcel information through PARLAY 2.0 in Google Earth and ArcGIS Earth. LandGlide addresses mobile property lookup, extending the same general data proposition to field users.

    BestCRE’s analysis is that ReportAll is strongest when parcel coverage is a required input rather than the final output. Its national scope and multiple delivery formats can remove substantial data collection work for a technology team. The tradeoff is that procurement requires careful validation of attributes, refresh behavior, licensing rights, and local exceptions. Buyers should request a representative sample and test it against counties that matter to their portfolios. ReportAll is credible infrastructure for parcel dependent workflows, but a principal or broker seeking finished market conclusions will need additional systems.

    What ReportAll USA Does and How It Works

    ReportAll aggregates parcel information from local sources and converts it into a national dataset with standardized fields and geometry. The company says its coverage represents the entire United States population and includes 3,230 counties. It also says the information is sourced and standardized daily. That processing matters because assessor and recorder systems vary widely in schemas, naming conventions, identifiers, geometry formats, and publication schedules. ReportAll’s practical function is to reduce those differences enough that customers can query or display parcels through a consistent technical structure. Daily processing should not be interpreted as proof that every county publishes new source records each day, since local update timing remains outside the vendor’s control.

    The API is the central option for technology companies and internal development teams. It allows parcel information to be incorporated into a customer facing product, internal map, search workflow, or analytical application without hosting every interaction inside ReportAll’s own interface. The Esri compatible Feature Service provides another route for organizations already working in ArcGIS environments. Enterprise users can license the National Parcel Layer, while teams with bounded geographic needs can download county or state files from the online store. These choices support both hosted access and local data management, although the exact endpoints, fields, request limits, and licensing conditions should be confirmed during technical evaluation.

    The surrounding products address users who need parcel access without developing an integration. ReportAll Online supports searching, browsing, and exporting property information in a web browser. PARLAY 2.0 places nationwide parcel overlays in Google Earth and ArcGIS Earth, which can suit preliminary site review or visual context. LandGlide supplies mobile access for field oriented property lookup. In analysis, the breadth of delivery methods is valuable because CRE organizations rarely have one uniform GIS workflow. However, buyers should separate interface convenience from analytical depth. ReportAll provides parcel geometry and property attributes, not a complete decision engine for investment underwriting, market forecasting, lease analysis, or comparable selection.

    9AI Framework: Dimension by Dimension Analysis

    CRE Relevance: 7/10

    A score of 7 reflects strong relevance to parcel dependent CRE work and limited relevance to the rest of the investment process. Developers, land teams, site selectors, GIS analysts, brokers, and property technology companies routinely need parcel boundaries, identifiers, and assessor attributes. ReportAll can make those inputs easier to obtain nationally. It is less directly useful for professionals focused on leasing, asset management, capital markets, or property level financial modeling. The platform does not appear to supply the transaction, tenancy, operating, or forecast data expected from a full CRE intelligence system. BestCRE’s analysis is that ReportAll should be treated as a geographic data component within a broader workflow. It earns more than a general mapping tool because parcels are fundamental property units, but it stops short of the CRE specificity demonstrated by purpose built underwriting and market platforms.

    Data Quality and Sources: 8/10

    A score of 8 recognizes ReportAll’s emphasis on national coverage, standardization, and recurring source processing. Consolidating parcel records from thousands of county jurisdictions is difficult because local schemas and update practices differ substantially. A normalized national layer can therefore save a buyer considerable engineering and quality control work. The remaining limitation is inherent to public record aggregation: a standardized delivery pipeline cannot make a source jurisdiction more current or complete than the information it publishes. Field availability, ownership formatting, assessed values, mailing addresses, and geometry precision can vary by locality. Buyers should not equate daily processing with daily county updates. BestCRE’s analysis is that the data proposition is strong, but quality must be measured in the exact markets and fields a customer will use. A sample test should include rural, fast growth, and recently subdivided areas, not merely prominent metropolitan counties.

    Ease of Adoption: 7/10

    A score of 7 reflects several accessible ways to begin, balanced against the work required for serious enterprise deployment. Nontechnical users can search through a browser, obtain regional downloads, use a mobile product, or view parcel overlays in familiar mapping software. GIS teams can connect through an Esri compatible service, while developers can work with the API. This range reduces the risk that every user must adopt an unfamiliar application. The harder portion begins when an organization embeds parcel data into production systems. Teams must map fields, manage identifiers, define refresh routines, test county variations, and understand display and redistribution rights. The vendor offers support channels and samples, but public implementation detail is not sufficient to estimate a typical deployment effort. BestCRE’s analysis is that adoption is straightforward for evaluation and visualization, while an embedded national implementation still requires competent GIS or data engineering resources.

    Output Accuracy: 7/10

    A score of 7 reflects useful standardized output with unavoidable dependence on local public records. Parcel polygons and associated attributes can support mapping, property lookup, site screening, and spatial joins, but they should not automatically be treated as survey grade boundaries or definitive legal ownership evidence. County data can contain timing differences, geometry gaps, naming inconsistencies, and records that lag recent transfers or subdivisions. Standardization makes those records easier to use, but it cannot independently establish legal accuracy. ReportAll publicly emphasizes reliable national information, yet it does not publish a universal accuracy rate that would apply across every jurisdiction and field. BestCRE’s analysis is that output is appropriate for research, visualization, product features, and early stage decisions when accompanied by reasonable validation. High consequence acquisition, title, entitlement, or construction decisions should still be checked against authoritative county documents, title materials, surveys, and legal descriptions.

    Integration and Workflow Fit: 9/10

    A score of 9 is the strongest rating in this review because integration is central to ReportAll’s product design. The company provides an API for application development, an Esri compatible Feature Service, an enterprise parcel layer, downloadable files, browser access, and overlays for Google Earth and ArcGIS Earth. That gives buyers multiple choices across hosted services, desktop GIS, internal data environments, and customer facing software. ReportAll is especially well positioned for a property technology vendor that wants parcel information inside its own experience rather than sending users to an unrelated portal. The remaining diligence concerns are commercial and architectural. Buyers need to confirm request limits, authentication, permitted caching, bulk use, refresh behavior, field definitions, uptime commitments, and redistribution rights. BestCRE’s analysis is that few parcel providers can be judged solely on endpoint availability. The decisive question is whether the contract and data model support the buyer’s intended production use.

    Pricing Transparency: 4/10

    A score of 4 reflects limited public pricing visibility across the product family. The vendor operates an online data store, but consistent enterprise pricing for the API, National Parcel Layer, Feature Service, and broader licensing arrangements is not published. Public pages invite buyers to contact sales, request samples, or compare products rather than presenting a complete rate structure. That is understandable for national data licensing because cost may depend on geography, delivery method, usage volume, attributes, storage, and redistribution rights. It still makes budgeting and vendor comparison harder for a CRE buyer. BestCRE’s analysis is that pricing diligence should focus on total permitted use, not merely the subscription or license fee. A low initial quote can become restrictive if it excludes caching, derived products, external display, bulk export, or customer access. Buyers should request a written scenario based quote before investing engineering time in a proof of concept.

    Support and Reliability: 6/10

    A score of 6 reflects visible support and sales contact routes but limited public evidence about service depth. ReportAll directs users to a support site and publishes an email channel for prospective customers. Product samples and multiple access methods should also help teams identify the appropriate delivery model before contracting. However, the vendor does not publicly provide enough detail to judge standard response times, implementation staffing, escalation procedures, onboarding scope, service commitments, or premium support tiers across every product. Those items matter when parcel data powers a customer facing application or time sensitive internal workflow. BestCRE’s analysis is that buyers should distinguish ordinary account assistance from production grade technical support. Procurement should ask who handles schema questions, county anomalies, service incidents, and licensing interpretations, as well as whether named contacts and response commitments are included. The available evidence supports an adequate rating, but not a top tier enterprise support score.

    Innovation and Roadmap: 7/10

    A score of 7 recognizes a useful delivery architecture rather than a fundamentally new form of property analysis. ReportAll has packaged a difficult, fragmented data category into several consumption models, including application programming interfaces, hosted feature services, national licensing, desktop overlays, downloads, browser tools, and mobile access. That breadth is meaningful innovation for customers that otherwise would reconcile county records and build distribution infrastructure themselves. The product is less differentiated at the analytical layer. Parcel aggregation, web services, and GIS overlays are established capabilities, and ReportAll does not publicly position the platform as an autonomous underwriting or forecasting system. BestCRE’s analysis is that its innovation lies in operationalizing nationwide parcel access and meeting users in their preferred technical environment. Future differentiation will depend on better provenance, change detection, temporal history, confidence indicators, and links between parcels and deeper CRE datasets, not simply adding another interface for the same records.

    Market Reputation: 7/10

    A score of 7 reflects an established public product presence and credible positioning in the parcel data market. ReportAll serves multiple industries and maintains products for enterprise licensing, application development, GIS use, browser research, downloads, and mobile workflows. Its visible relationship with the Esri ecosystem supports credibility among mapping professionals. LandGlide also gives the company a recognizable field oriented product. Even so, ReportAll does not publish enough audited performance information, customer counts, retention figures, or comprehensive named CRE references to justify a higher reputation score. The breadth of industries also means its reputation is not exclusively rooted in institutional commercial real estate. BestCRE’s analysis is that the vendor belongs on a serious parcel data shortlist, particularly for nationwide requirements. Buyers should still conduct reference calls with organizations whose usage resembles their own, especially when the planned implementation includes external distribution, high query volumes, or business critical mapping.

    9AI Score Card ReportAll USA
    69
    69 / 100
    Emerging Tool
    Parcel Data
    ReportAll USA
    ReportAll supplies standardized nationwide parcel records through APIs, Esri services, downloadable files, browser search, and overlays for property mapping applications.
    9 Dimensions, Scored 1 to 10
    1. CRE Relevance
    7/10
    2. Data Quality & Sources
    8/10
    3. Ease of Adoption
    7/10
    4. Output Accuracy
    7/10
    5. Integration & Workflow Fit
    9/10
    6. Pricing Transparency
    4/10
    7. Support & Reliability
    6/10
    8. Innovation & Roadmap
    7/10
    9. Market Reputation
    7/10
    BestCRE.com, 9AI Framework v2 Reviewed October 2026

    Who Should Use ReportAll USA

    ReportAll is best suited to property technology companies, internal software teams, and GIS groups that need a nationwide parcel layer inside an existing product or workflow. A marketplace might use it to draw parcel boundaries around listings. A development team could connect candidate sites to zoning, environmental, utility, demographic, or mobility layers. A brokerage research group could use standardized geometry to organize local datasets consistently. Portfolio owners with assets across many jurisdictions may also benefit when county by county acquisition and normalization would otherwise consume internal resources. These buyers should have a defined use case, technical ownership, and a clear plan for validating important attributes.

    Land focused investors, site selection teams, infrastructure planners, insurers, and public sector users are also plausible buyers because their decisions depend heavily on location and parcel context. CRE principals should consider ReportAll when their current bottleneck is obtaining and maintaining parcel data, not when their primary problem is interpreting market fundamentals. The strongest buyer can explain which fields are required, how often information must refresh, whether data will be shown externally, and which systems will consume it. BestCRE’s analysis is that value rises with geographic breadth and repeated use. A team examining isolated properties in one cooperative county may be able to use local sources, while a national platform gains more from standardization.

    Who Should Not Use ReportAll USA

    ReportAll is not the best primary purchase for an acquisitions team seeking finished underwriting, sales and lease comparables, rent forecasts, tenant intelligence, or investment recommendations. It provides an important geographic foundation, but the buyer must connect that foundation to other CRE datasets and analytical methods. Small brokerage teams without GIS or development resources may also find the API and enterprise layer more infrastructure than they need. Those users should first assess whether ReportAll Online, LandGlide, or a parcel feature already included in another subscription can satisfy the requirement.

    Organizations requiring survey grade boundaries, guaranteed legal ownership status, or instantaneous recording updates should not treat an aggregated parcel service as the final authority. Title, legal, entitlement, and construction decisions require appropriate primary documents and professional verification. ReportAll may also be a poor fit when a project covers only a small, stable geography and the relevant public agency supplies clean files under workable terms. BestCRE’s analysis is that the product becomes harder to justify when national consistency, application embedding, and recurring updates are not materially valuable.

    Pricing and ROI Analysis

    ReportAll does not publish a complete standard price schedule for its API, National Parcel Layer, Feature Service, or enterprise licensing. The online store supports purchases by county or state, but a buyer should not assume those transaction prices represent the cost of ongoing production access. Enterprise quotes may vary with geographic scope, product, attributes, request volume, update method, number of users, storage, and whether data appears in an external application. Buyers should request pricing for their actual architecture and ask the vendor to itemize setup costs, recurring fees, overages, support, data refreshes, and permitted redistribution.

    Analysis: simple return on investment should compare the annual vendor cost with the labor and delay avoided by sourcing, cleaning, joining, and maintaining parcel files internally. For example, if a GIS specialist would otherwise spend 20 hours each month on acquisition and normalization, the annual internal burden is 240 hours. Multiplying those hours by the organization’s fully loaded hourly cost creates a baseline savings estimate before considering faster launches or fewer mapping failures. This is an illustrative calculation, not a claim about ReportAll’s customers. Buyers should then subtract implementation work and continuing quality assurance. The business case is strongest when one maintained integration supports many markets, users, or customer interactions.

    Integration and CRE Tech Stack Fit

    ReportAll fits most naturally beneath a CRE application’s visible analytical layer. Its API can feed web maps, property search, site screening, asset records, or spatial analysis. The Feature Service is relevant to teams working in the Esri ecosystem, while downloadable data can enter a warehouse, GIS database, or batch processing pipeline. PARLAY 2.0 supports Google Earth and ArcGIS Earth workflows. These options allow a buyer to match delivery to existing skills instead of replacing the entire technology stack.

    Implementation diligence should cover parcel identifiers, coordinate systems, geometry types, attribute definitions, update handling, and joins to internal property records. Teams should also test whether an address, assessor identifier, or spatial match provides the most reliable link in their target markets. Contract review is equally important when parcel content will appear in a commercial product. BestCRE’s analysis is that ReportAll’s technical fit is strong, but integration success depends on data governance and licensing discipline. A proof of concept should test both common searches and difficult local exceptions before production approval.

    Competitive Landscape

    Regrid is the closest broad alternative for buyers seeking nationwide parcel information, mapping tools, downloads, and application access. It merits direct comparison on attribute coverage, freshness in priority counties, developer experience, licensing, and ease of linking parcels to other records. ATTOM is a stronger candidate when parcel information must sit beside a wider property data catalog, including ownership, valuation, transaction, mortgage, and market related fields. Its broader scope may reduce the number of vendors, although buyers should compare the clarity and fitness of each required field rather than choosing on catalog size alone.

    LandGlide is part of ReportAll’s own product family and is better considered an alternative interface for mobile and field users than an independent competing data source. A buyer that mainly needs property lookup on phones may not require an enterprise API project. Cotality, formerly associated with the CoreLogic name, is another major alternative for organizations seeking property, hazard, valuation, and related intelligence at enterprise scale. Its offering may suit broader risk and property workflows, while ReportAll’s proposition is more focused on accessible parcel delivery and embedding.

    BestCRE’s analysis is that the selection should begin with use case boundaries. Choose ReportAll for a parcel centered product architecture and multiple GIS delivery choices. Consider ATTOM or Cotality when parcel data is one component of a much wider property record requirement. Evaluate Regrid head to head when the decision is specifically about nationwide parcel infrastructure. CoStar, Green Street, Placer.ai, CompStak, Cherre, VTS, and Enodo address adjacent market, tenant, integration, or analytical needs, but none should be treated as a direct substitute without confirming the parcel workflow.

    The Bottom Line

    ReportAll deserves a shortlist position when a CRE organization or property technology company needs standardized parcel coverage across many jurisdictions. The API, Esri compatible service, national layer, downloads, browser product, and mapping overlays provide unusually flexible routes into the same core data category. Integration is its clearest strength. The primary cautions are limited public pricing, unevenness inherited from local source records, and the need to verify contractual rights for embedded or redistributed use.

    The buying decision should depend on a sample based technical test, not a sales demonstration alone. Select several difficult counties, inspect geometry and required attributes, measure match performance against internal records, and obtain a written production quote. Buy if ReportAll materially reduces recurring parcel maintenance and its license supports the intended audience. Do not buy it as a substitute for CRE market intelligence, underwriting, title work, or survey verification. BestCRE’s analysis is that it is capable parcel infrastructure with a focused job, and it should be judged on that job.

    About BestCRE

    BestCRE.com is the definitive authority on commercial real estate AI, analysis, and investment intelligence. Every article advances the platform’s mission to help CRE professionals identify, evaluate, and adopt the best tools and strategies in the industry. We benchmark platforms using the 9AI Framework so CRE leaders can compare tools with clear evidence. Explore the category map at 20 CRE sectors for deeper coverage across the CRE stack.

    Frequently Asked Questions

    What is ReportAll USA?

    ReportAll USA is a property data company that aggregates and standardizes parcel boundaries and related records from jurisdictions across the United States. Its products include a National Parcel Layer, an API, an Esri compatible Feature Service, browser based search, county and state downloads, mapping overlays, and the LandGlide mobile application. In commercial real estate, the data can support property mapping, site selection, development screening, portfolio visualization, and software products that need parcel context. It is not a complete CRE market analytics or underwriting system. Users generally combine its parcel information with internal property records and other sources covering transactions, rents, tenants, zoning, demographics, hazards, or financial performance.

    How does ReportAll USA compare with Regrid and ATTOM?

    ReportAll and Regrid are close comparisons when the core requirement is nationwide parcel data delivered through maps, files, or application services. Buyers should test both vendors in priority counties and compare field coverage, geometry, update handling, documentation, support, and licensing. ATTOM offers a broader property data proposition that can include transaction, ownership, valuation, mortgage, and market related information alongside parcel content. That may suit organizations trying to consolidate several data categories. ReportAll is more clearly centered on parcel access and flexible GIS delivery. BestCRE’s analysis is that no comparison should rely only on national coverage claims. A representative sample, an integration exercise, and written confirmation of external display and redistribution rights will reveal more than a feature checklist.

    How much does ReportAll USA cost?

    ReportAll does not publish a complete standard price list for its API, National Parcel Layer, Feature Service, or enterprise arrangements. Its Data Store allows geographic downloads, but those purchase options should not be treated as a reliable proxy for an ongoing enterprise license. Pricing may depend on the product, geographic scope, attributes, usage volume, refresh requirements, storage, number of users, and whether parcel information will be exposed to customers. Ask for a scenario based quote that includes implementation charges, recurring fees, overages, support, updates, caching rights, and redistribution terms. Analysis: compare that total with the internal cost of acquiring and normalizing county files, maintaining pipelines, resolving data issues, and delaying product releases.

    Who should use ReportAll USA?

    ReportAll is best suited to software teams, GIS departments, property technology companies, site selectors, developers, infrastructure planners, and portfolio analysts that repeatedly need parcel boundaries across multiple jurisdictions. It is particularly relevant when the data must appear inside an internal system or customer facing application. A national organization can benefit from using one standardized structure instead of maintaining separate county pipelines. It is less suitable as a primary tool for brokers or principals whose central needs are lease comparables, transaction evidence, market forecasts, or financial underwriting. Teams without GIS or development resources should first consider the browser, mobile, download, or overlay products. Any buyer using parcel records for legal or construction decisions should confirm information through authoritative documents and qualified professionals.

    What should ReportAll USA improve next?

    BestCRE’s analysis is that ReportAll’s most valuable next improvements would be clearer provenance, field level freshness indicators, historical parcel change tracking, and confidence signals for geometry and ownership attributes. Those features would help users distinguish recently processed data from recently updated local source records. More public pricing guidance and clearly defined licensing examples would also make procurement easier for software companies evaluating external display, caching, and derived products. On the analytical side, stronger links between parcels and zoning, permits, transactions, environmental constraints, and CRE property identifiers could reduce integration work without turning ReportAll into a full underwriting platform. The company should preserve its strength as parcel infrastructure while making data lineage, exceptions, and production economics easier for buyers to evaluate.

    Related Reviews

    Compare ReportAll USA with other Acquisitions tools BestCRE has scored: CompStak (76/100), Cherre (74/100), Esri ArcGIS Business Analyst (70/100) and Google Gemini (70/100). Browse every review in CRE Acquisitions, the full Best CRE AI Tools directory, or the 20 CRE Sectors hub.

  • Morningstar Credit Analytics Review: CMBS surveillance and loan analysis inside AI workflows

    Morningstar Credit Analytics Review: CMBS surveillance and loan analysis inside AI workflows

    BestCRE 9AI Score

    71/100 · Contender

    Morningstar Credit Analytics ranks #152 of 584 commercial real estate AI tools scored on the 9AI Framework. Nine dimensions, each scored out of 10: CRE relevance, data quality, ease of adoption, output accuracy, integration fit, pricing transparency, support, innovation and market reputation.

    Morningstar Credit Analytics is a commercial real estate credit platform for lenders, CMBS investors, servicers and analysts who monitor securitized debt and individual loans. Its central job is to bring deal, tranche and loan surveillance into one analytical environment. For a credit team, that can reduce the time spent finding delinquency changes, watchlist developments, special servicing transfers and collateral details across multiple securitization types. The product is CRE native and purpose built for institutional credit work, not a general market research tool adapted to real estate.

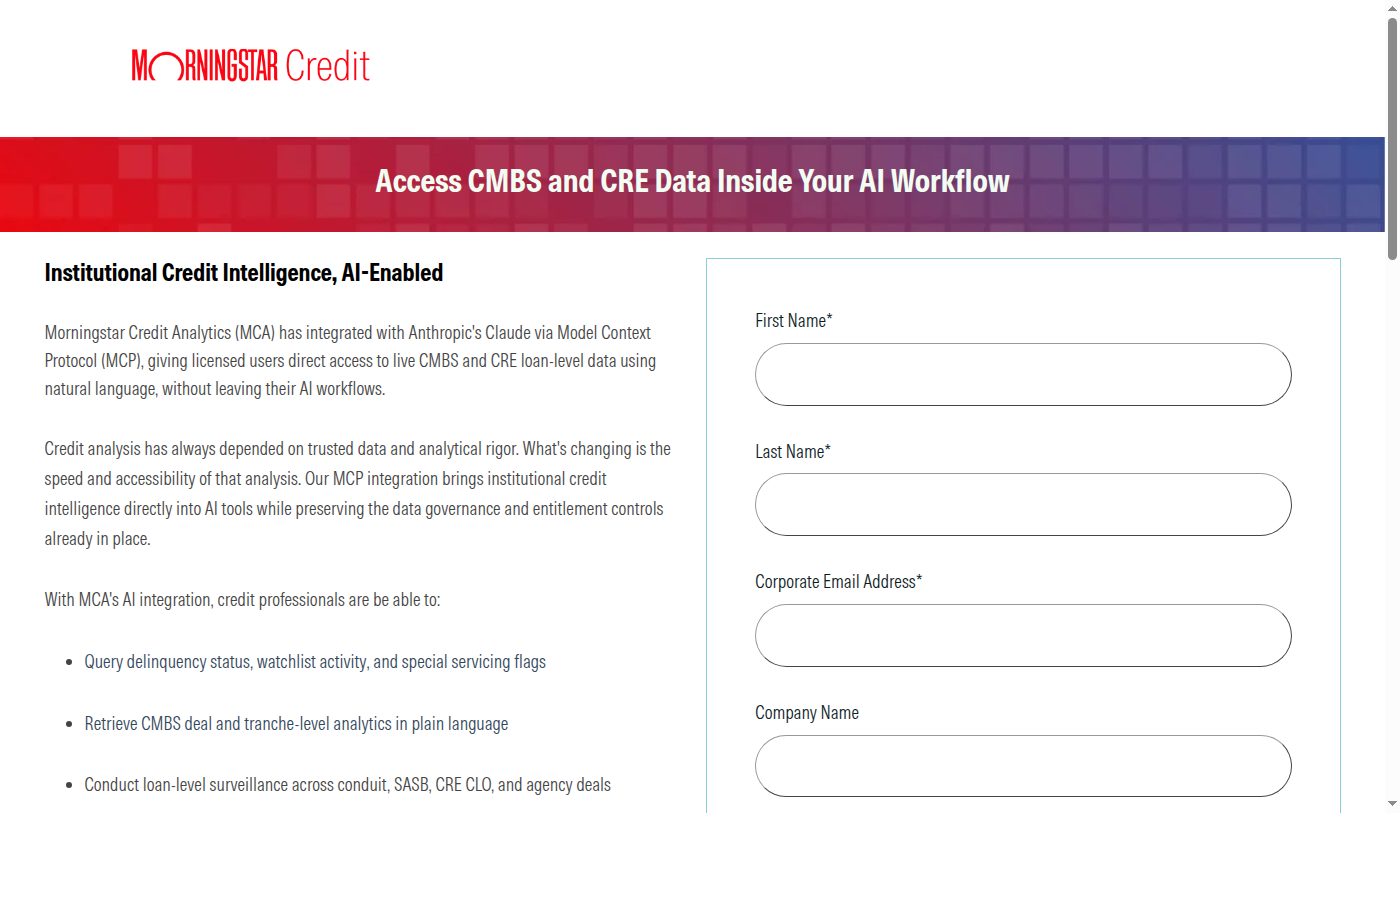
    The most consequential product development is access through Anthropic’s Claude using Model Context Protocol, or MCP. Licensed users can ask natural language questions about live CMBS and CRE data without exporting files or writing SQL. This changes the interface more than the underlying analytical discipline. The source data, permissions and licensed deal universe remain controlled by Morningstar, while the AI assistant becomes another way to retrieve and interrogate that information.

    Coverage includes conduit, single asset single borrower, CRE CLO and agency transactions. Users can examine pool composition, tranche analytics and monthly surveillance data, then move to specific loans and status indicators. Morningstar also offers credit models and Bring Your Own Loan analysis, which extends the platform beyond published securitization data. That combination is useful for institutions comparing internal exposures with the broader structured finance market.

    BestCRE’s analysis is that Morningstar Credit Analytics belongs on a serious CMBS buyer’s shortlist. Its strengths are domain relevance, institutional data lineage and a practical implementation of governed AI access. The principal limitations are commercial opacity and a narrower workflow focus than broad property intelligence platforms. Pricing is not published, support service levels are not described publicly, and the usefulness of MCP access depends on both the customer’s license entitlements and internal approval for Claude. Buyers should evaluate it as credit infrastructure, not as an all purpose CRE research subscription.

    What Morningstar Credit Analytics Does and How It Works

    Morningstar Credit Analytics organizes securitized commercial mortgage information around the structures credit professionals actually review. Users can retrieve data for conduit, single asset single borrower, CRE CLO and agency deals, examine pool composition and inspect tranche level analytics. At the loan level, surveillance queries can surface delinquency status, watchlist activity and special servicing flags. Monthly surveillance data supports recurring portfolio reviews, exception reporting and investigation of deteriorating collateral. The platform therefore connects capital structure analysis with the underlying properties and borrowers rather than treating a CMBS bond as an isolated security.

    Its MCP connection adds a natural language retrieval layer inside Claude. A licensed user can ask for permitted deal or loan information in plain English, and the request is handled under existing data entitlements. That design matters because institutional users cannot treat an AI interface as permission to bypass contractual access controls. It can also remove several mechanical steps from routine research, such as constructing a query, downloading a file and switching between applications. BestCRE’s analysis is that the value will be highest for focused questions and first pass investigation. Material credit decisions should still be checked against source records, definitions and the platform’s conventional analytical views.

    Credit models and Bring Your Own Loan capabilities broaden the workflow beyond securities already represented in the platform. A lender can apply Morningstar’s analytical environment to a proprietary loan, while an investor can compare surveillance signals across eligible transactions. Public product information does not fully describe model inputs, validation results, update latency, export formats or every supported field. Those details should be tested during diligence. The system is not presented as a property operations platform, transaction management system or general prospecting database. Its mechanics are centered on credit surveillance, structured finance research and analysis of CRE debt performance.

    9AI Framework: Dimension by Dimension Analysis

    CRE Relevance: 9/10

    A score of 9 reflects a product built directly around commercial mortgage credit rather than a generic AI assistant or broad property database. Its coverage of conduit, single asset single borrower, CRE CLO and agency transactions matches the instruments followed by CMBS investors, lenders and surveillance teams. Delinquency, watchlist and special servicing queries address recurring CRE credit tasks, while Bring Your Own Loan analysis supports balance sheet exposures outside securitized pools. The platform stops short of a perfect score because its relevance is concentrated in debt and structured finance. Brokers seeking prospecting data, owners managing buildings and equity investors modeling leasing assumptions may find only part of their workflow covered. BestCRE’s analysis is that the fit is exceptionally strong for institutional debt users and considerably less complete for the wider CRE market.

    Data Quality and Sources: 8/10

    A score of 8, held below 9 because field provenance and refresh specifications are not published, recognizes Morningstar’s established role in institutional financial data and the platform’s focus on live, licensed CMBS and CRE loan information. Deal, tranche and loan level coverage gives analysts a connected view of securities and collateral, while monthly surveillance supports ongoing monitoring. Existing entitlement controls are an important quality feature because they preserve authorized access and help maintain consistent datasets across conventional and AI interfaces. A perfect score would require public detail on field provenance, refresh timing, correction procedures, historical depth and completeness by transaction type. Morningstar does not publish all of those specifications on the product page. Buyers should request a field dictionary, sample histories and an explanation of how servicer updates and amended records flow into the system. BestCRE’s analysis is that the underlying data proposition is strong, but institutional diligence remains necessary.

    Ease of Adoption: 7/10

    A score of 7 balances an approachable natural language interface against the realities of enterprise credit deployment. Querying data through Claude can reduce training needs for analysts who understand CMBS but do not write SQL. It may also shorten routine workflows by limiting exports and application switching. Existing Morningstar customers should have an easier path because access follows licensed entitlements. Adoption is less straightforward for firms that have not approved Claude, lack an MCP governance policy or need the product connected to established reporting processes. Premium licensing is required, and public information does not specify implementation time, administrative tooling or onboarding requirements. Users must also learn how to frame questions, interpret returned fields and verify important findings. BestCRE’s analysis is that individual use should feel accessible, while institutional adoption will still require security, legal, data and model risk review.

    Output Accuracy: 7/10

    A score of 7, held below 8 because no accuracy rates are published, reflects the distinction between dependable licensed data and AI generated presentation of that data. Morningstar’s controlled datasets and analytical focus provide a sound basis for surveillance output. Direct access to deal, tranche and loan records can reduce errors introduced by manual copying, spreadsheet joins and stale exports. However, a natural language layer can still misunderstand a request, omit context or summarize a field incorrectly. The vendor does not publish accuracy rates, benchmark results or a formal error rate for MCP responses. Credit teams should therefore require citations or traceable record identifiers, reconcile material answers to source views and test ambiguous questions before relying on the workflow. BestCRE’s analysis is that the platform can produce highly useful results, but the AI interface should be treated as a research and retrieval mechanism rather than an autonomous credit decision maker.

    Integration and Workflow Fit: 7/10

    A score of 7, the ceiling without a native Yardi, MRI, CoStar or Argus integration, recognizes a meaningful connection between institutional CRE data and an external AI workflow. MCP gives licensed users a standardized way to access Morningstar information through Claude while retaining entitlement controls. That approach is more useful than an isolated chatbot because it places governed data inside a tool analysts may already use for research and synthesis. It also creates a plausible foundation for other MCP compatible assistants, although Morningstar publicly emphasizes Claude and does not publish a complete list of supported clients. Public materials do not specify native connections to loan servicing systems, data warehouses, portfolio management platforms or business intelligence tools. Nor are API terms, export limits and administrative controls fully described. BestCRE’s analysis is that the AI connection is unusually forward looking, but buyers with complex architectures must confirm how the product fits beyond the demonstrated Claude workflow.

    Pricing Transparency: 4/10

    A score of 4 is required because Morningstar does not publish subscription prices, package thresholds, data coverage fees or implementation charges for Credit Analytics. The MCP enabled data offering requires a premium license, but buyers must contact sales to learn what that means for their institution. It is also unclear publicly whether Claude access is included in a broader contract, priced as an add on or conditioned on particular data packages. This opacity makes early budgeting and competitor comparison difficult, especially for smaller teams. Enterprise data products often vary by users, coverage and permitted uses, but that does not eliminate the buyer’s need for a clear commercial framework. BestCRE’s analysis is that prospects should request a written breakdown covering licenses, datasets, AI access, exports, onboarding, renewals and any usage limits before agreeing to a pilot.

    Support and Reliability: 7/10

    A score of 7 reflects Morningstar’s institutional standing and the availability of a sales and customer success path, while recognizing that detailed service commitments are not public. Credit data buyers generally need help with entitlements, definitions, deal coverage and discrepancies, not merely software navigation. The product page invites prospects to meet with sales and customer success personnel, which indicates a supported enterprise motion. Morningstar does not publicly specify response times, support hours, named account coverage, training programs or escalation procedures for this offering. MCP access also creates additional support boundaries because an issue may arise from the data service, the assistant, the user’s configuration or internal security controls. BestCRE’s analysis is that support is likely suitable for institutional customers, but buyers should make service levels, data issue escalation and AI integration ownership explicit in the contract.

    Innovation and Roadmap: 8/10

    A score of 8, below the rare 9 to 10 range, reflects a substantive application of MCP to institutional CRE credit data. The notable advance is not simply conversational search. It is the delivery of licensed loan, deal and tranche information inside an AI assistant while maintaining entitlement controls. That architecture addresses a real obstacle to enterprise AI adoption: useful models often lack approved access to current proprietary data. Natural language retrieval can accelerate surveillance questions and allow analysts to combine data lookup with synthesis in one working session. The score is not higher because public evidence of broad production adoption, multi assistant support and measurable workflow improvement is limited. The interface also depends on careful verification when outputs influence credit decisions. BestCRE’s analysis is that Morningstar has moved beyond adding a decorative chatbot and created an important new access route for structured CRE credit information.

    Market Reputation: 7/10

    A score of 7, the ceiling when fewer than three CRE clients are named, is supported by Morningstar’s public company status, established financial information business and recognizable institutional brand. Morningstar is headquartered in Chicago and trades on Nasdaq under MORN. That parentage gives Credit Analytics more credibility and organizational durability than an early stage vendor with limited public history. For regulated lenders and investment managers, vendor stability, data governance and contract accountability can be as important as interface design. The score remains below perfect because reputation must be evaluated at the product level as well as the parent level. Morningstar does not publish customer counts, retention rates or a customer roster specifically for the MCP enabled CRE analytics offering. BestCRE’s analysis is that buyers can have substantial confidence in the organization, but should still obtain product references from teams with comparable portfolios, security requirements and surveillance processes.

    9AI Score Card Morningstar Credit Analytics
    78
    71 / 100
    Solid Platform
    CRE Credit Analytics
    Morningstar Credit Analytics
    Morningstar Credit Analytics lets licensed credit teams query live CMBS surveillance, deal, tranche and loan data through Claude using natural language.
    9 Dimensions, Scored 1 to 10
    1. CRE Relevance
    9/10
    2. Data Quality & Sources
    8/10
    3. Ease of Adoption
    7/10
    4. Output Accuracy
    7/10
    5. Integration & Workflow Fit
    7/10
    6. Pricing Transparency
    4/10
    7. Support & Reliability
    7/10
    8. Innovation & Roadmap
    8/10
    9. Market Reputation
    7/10
    BestCRE.com, 9AI Framework v2 Reviewed October 2026

    Who Should Use Morningstar Credit Analytics

    The strongest buyers are CMBS investment teams, commercial mortgage lenders, surveillance groups and servicers that repeatedly move between deal structures and underlying loan performance. Analysts responsible for monitoring delinquencies, watchlists, special servicing transfers and tranche exposure should find the data model closely aligned with their work. It is particularly relevant when a team already licenses Morningstar credit data and wants to make common queries accessible through natural language. Portfolio managers may also benefit when they need quick investigation before assigning a deeper review to an analyst.

    Institutions with proprietary loan books are another suitable profile because Bring Your Own Loan analysis can connect internal exposures with Morningstar’s credit models and market context. The buyer should have clear data governance, approved use of Claude and a process for validating AI assisted findings. BestCRE’s analysis is that the best customer is not seeking to replace credit judgment. It is seeking to compress retrieval and surveillance time while preserving traceability. A pilot should use representative deals, difficult loan questions and actual reporting deadlines, then measure whether analysts reach verified answers faster.

    Who Should Not Use Morningstar Credit Analytics

    Brokerage teams focused on prospecting, owner operators managing properties and equity investors centered on rent growth, leasing or development pipelines should not treat this as their primary market intelligence platform. The product’s center of gravity is structured credit and loan surveillance. CoStar, MSCI Real Assets, Moody’s REIS, Green Street or local property datasets may align better with workflows driven by transactions, ownership, rents, supply and operating fundamentals.

    Small teams that need public pricing, a self service trial or a lightweight subscription may also find the enterprise sales process unsuitable. Firms that prohibit external AI assistants will not receive the full benefit of the MCP interface, although the underlying analytics may still be relevant. BestCRE’s analysis is that buyers should also wait if they cannot establish a verification protocol. Natural language convenience is not enough when a returned status or tranche observation may affect a trade, reserve decision or risk report.

    Pricing and ROI Analysis

    Morningstar does not publish pricing for Credit Analytics, its credit models, Bring Your Own Loan analysis or MCP enabled access. The AI connection requires a premium license, but the vendor does not disclose minimum contract value, per user charges, data package fees, implementation costs or usage limits. Prospects should ask whether pricing varies by transaction universe, asset coverage, number of users, internal redistribution rights and access through Claude. They should also confirm whether assistant costs are separate and whether exports or downstream storage carry additional restrictions.

    Analysis: a buyer can create a simple break even case without assuming vendor pricing. Multiply the number of analysts by the hours each spends monthly finding, exporting and reconciling surveillance data, then multiply that result by the institution’s fully loaded hourly labor cost. Add the estimated value of avoided reporting errors only if the organization can document it. Compare that annual benefit with the complete annual contract and implementation cost. For example, a team should use its own observed time savings from a pilot rather than a vendor estimate. Approval is sensible only if verified savings and better risk coverage exceed total cost by the buyer’s required return threshold.

    Integration and CRE Tech Stack Fit

    The clearest integration is with Anthropic’s Claude through Model Context Protocol. Licensed users can query permitted CMBS and CRE loan data from the assistant while Morningstar retains its entitlement controls. This fits organizations that want analysts to use natural language without copying institutional datasets into unmanaged tools. It may also reduce dependence on one off spreadsheet exports for routine questions.

    The wider technology fit is less publicly documented. Morningstar does not publish a complete list of supported AI assistants, servicing platforms, portfolio systems, warehouses or business intelligence connections for this product. Buyers should test identity management, audit logs, citations, record links, permission changes and data retention. BestCRE’s analysis is that MCP is a strong access layer, but it is not automatically a complete enterprise integration strategy. Architecture teams must establish where responses can be stored, how outputs enter governed reports and which system remains the official record.

    Competitive Landscape

    Trepp is the most direct alternative for many CMBS surveillance teams, with deep familiarity among structured finance professionals and established deal and loan workflows. CRED iQ also competes around CRE debt intelligence, distress monitoring and surveillance. A buyer should compare coverage, field definitions, historical depth, update timing and the path from an alert to the underlying source record. The practical contest is not simply which vendor has more data. It is which platform answers the institution’s recurring credit questions with the least reconciliation.

    MSCI Real Assets, including capabilities associated with Real Capital Analytics, is more compelling when the requirement centers on property transactions, ownership and capital markets context. Moody’s REIS is a relevant alternative for market forecasts and property fundamentals. CoStar and Green Street can also serve adjacent research needs, but neither should be treated as a direct substitute for every CMBS surveillance function. BestCRE’s analysis is that Morningstar stands out when governed AI access, structured credit detail and proprietary loan analysis matter together. Trepp deserves a direct evaluation for CMBS depth, while broader property platforms are better comparators when debt surveillance is only one part of the mandate.

    The Bottom Line

    Morningstar Credit Analytics is a credible purchase candidate for institutions whose daily work centers on CMBS and CRE loan risk. Put it on the shortlist if analysts need connected deal, tranche and loan surveillance, and if governed natural language access through Claude could remove meaningful retrieval work. Require a pilot that tests current holdings, difficult status questions and traceability back to source data.

    Do not buy it solely because MCP is new or because Morningstar is a recognized name. The decision should turn on coverage, verified answer quality, contractual data rights and total cost, none of which can be settled from public information alone. BestCRE’s analysis is that the platform merits a serious evaluation alongside Trepp and CRED iQ. It is less appropriate as a general property research system or for teams unable to approve an external AI workflow.

    About BestCRE

    BestCRE.com is the definitive authority on commercial real estate AI, analysis, and investment intelligence. Every article advances the platform’s mission to help CRE professionals identify, evaluate, and adopt the best tools and strategies in the industry. We benchmark platforms using the 9AI Framework so CRE leaders can compare tools with clear evidence. Explore the category map at 20 CRE sectors for deeper coverage across the CRE stack.

    Frequently Asked Questions

    What is Morningstar Credit Analytics?

    Morningstar Credit Analytics is an institutional credit data and analysis platform focused on CMBS and commercial real estate loans. It serves lenders, investors, servicers and credit analysts who need to monitor securitized transactions and underlying collateral. The platform covers conduit, single asset single borrower, CRE CLO and agency structures, including pool composition, tranche analytics and monthly surveillance information. Users can investigate loan level indicators such as delinquency, watchlist activity and special servicing status. Credit models and Bring Your Own Loan analysis extend the workflow to proprietary exposures. It is not primarily a brokerage prospecting database, property management system or general rent forecasting product. BestCRE’s analysis is that its strongest role is as specialist infrastructure for CRE debt research and ongoing credit surveillance.

    How does Morningstar Credit Analytics compare with Trepp?

    Both Morningstar Credit Analytics and Trepp are relevant to institutions conducting CMBS and commercial mortgage surveillance. Buyers should compare their licensed deal coverage, historical depth, field definitions, update timing, tranche tools and treatment of special servicing information. Morningstar’s distinctive proposition is MCP based access through Claude, allowing licensed users to ask natural language questions while retaining data entitlements. It also combines credit models with Bring Your Own Loan analysis. Trepp has strong recognition among CMBS professionals and should be evaluated directly for established surveillance workflows. BestCRE’s analysis is that there is no universal winner. A controlled pilot using the buyer’s actual holdings should test completeness, traceability, response speed and the work required to verify each answer. Contractual data rights and integration requirements may decide the outcome as much as interface preference.

    How much does Morningstar Credit Analytics cost?

    Morningstar does not publish pricing for Credit Analytics. Public information states that access to its AI enabled data requires a premium license, but it does not disclose subscription tiers, minimum contract value, user fees, implementation charges or usage limits. Buyers must contact the vendor for a proposal. The request should separate the cost of core data, credit models, Bring Your Own Loan capabilities, MCP access, onboarding and any rights to export or store results. Claude related costs should also be identified separately where applicable. BestCRE’s analysis is that buyers should negotiate from a documented pilot. Measure time saved on surveillance and reconciliation, then compare that benefit with the entire annual cost. Do not build the business case around unverified estimates of AI productivity.

    Who should use Morningstar Credit Analytics?

    The platform best suits CMBS investors, commercial mortgage lenders, servicers, portfolio surveillance teams and credit analysts. It is especially relevant for professionals who routinely inspect deal structures, tranche exposure, loan performance, watchlist activity, delinquencies and special servicing transfers. Institutions with proprietary loan portfolios may also benefit from Bring Your Own Loan analysis and Morningstar’s credit models. The buyer should have a defined need for structured credit data, an approved AI environment and procedures for checking important outputs against source records. Equity focused acquisition teams, leasing brokers and property operators may need broader transaction, rent or operating datasets instead. BestCRE’s analysis is that the ideal customer wants to reduce repetitive data retrieval without delegating credit judgment to an AI assistant.

    Will Morningstar Credit Analytics support more AI assistants?

    Morningstar publicly emphasizes its integration with Anthropic’s Claude through Model Context Protocol. MCP is designed as a standardized way for AI applications to connect with external tools and data, so broader assistant compatibility is technically plausible. Morningstar does not publish a firm roadmap, schedule or complete list of additional supported assistants, however. Buyers should not assume that every MCP compatible client is approved, supported or covered by the same licensing terms. Ask which clients are production ready, how authentication and audit logging work, and whether Morningstar provides support when an assistant changes its MCP implementation. BestCRE’s analysis is that the architecture creates room for broader access, but procurement decisions should be based on supported capabilities available in October 2026 rather than anticipated integrations.

    Related Reviews

    Compare Morningstar Credit Analytics with other Financing & Lending tools BestCRE has scored: CompStak (76/100), Cherre (74/100), Google Gemini (70/100) and PNC Enterprise! Loan Management System (52/100). Browse every review in CRE Financing & Lending, the full Best CRE AI Tools directory, or the 20 CRE Sectors hub.

  • ScyAI Review: Matches physical asset risk with insurance coverage

    ScyAI Review: Matches physical asset risk with insurance coverage

    BestCRE 9AI Score

    57/100 · Watch

    ScyAI ranks #499 of 521 commercial real estate AI tools scored on the 9AI Framework. Nine dimensions, each scored out of 10: CRE relevance, data quality, ease of adoption, output accuracy, integration fit, pricing transparency, support, innovation and market reputation.

    ScyAI is an early stage risk intelligence company for businesses that own or operate substantial physical asset portfolios. Its product sits between property operations, corporate risk management, insurance procurement and finance. Users submit policy documents, statements of values, engineering reports, maintenance records and site drawings. ScyAI organizes this evidence into a digital representation of each location, then compares the documented assets and controls with insurance terms. For a CRE owner, operator or principal, the changed workflow is the preparation and review of property insurance renewals. Instead of relying mainly on spreadsheets, broker correspondence and periodic engineering surveys, the buyer gets a portfolio view of potential coverage mismatches and outstanding evidence.

    The proposition is narrower than a conventional sustainability platform. ScyAI is not primarily an energy management, carbon accounting or regulatory reporting system. Its relevance to CRE Sustainability and ESG comes from its use of hazard information, physical risk evidence and control documentation. Climate related changes such as flood reclassification can affect insurability, premiums, lender requirements and capital planning. The system is therefore best understood as insurance focused physical risk intelligence, with ESG applications, rather than an ESG system of record.

    Its most useful concept is coverage drift: the possibility that a building, its occupancy, its replacement cost or its risk controls have changed while the policy wording has not. ScyAI presents examples involving inadequate declared values, business interruption periods, flood limits, supplier dependencies and inspection obligations. These are credible risk management problems for complex portfolios. The value would come from finding a material discrepancy before renewal or loss, not from producing another generic portfolio score.

    BestCRE’s analysis is that ScyAI deserves attention from sophisticated asset owners but has not yet earned broad platform status. The company is young, public customer evidence is limited, pricing is not published and the available product information does not establish the depth of its integrations or validation processes. Buyers should treat it as a focused diagnostic layer and test it against known sites, policies and claims scenarios. A controlled pilot can reveal whether the product finds actionable issues that the incumbent broker, insurer and risk engineering process missed.

    What ScyAI Does and How It Works

    ScyAI begins with evidence already held across the organization. The product describes accepting engineering reports, maintenance programs, building and equipment drawings, statements of values and insurance wording. It extracts asset and control information, adds external hazard data and connects those records to locations in a digital twin. The result is not necessarily a geometric building model. In this context, the twin is an organized risk representation linking the physical site, declared assets, hazards, mitigation measures and applicable cover. That distinction matters because a buyer should not expect the design coordination capabilities associated with BIM software.

    The comparison layer appears to test what the organization owns and operates against what the policy says is insured. Potential findings include discrepancies in replacement values, indemnity periods, catastrophe sublimits, occupancy descriptions, named suppliers and protective safeguard conditions. The interface presents locations, maturity indicators, policy gaps, risk changes and open obligations. A user can inspect the evidence behind an issue and decide whether to resolve, defer or ignore it. This structure could give risk managers a repeatable exception workflow instead of forcing them to reread every policy alongside a fragmented set of property records.

    The external risk function monitors changes that may affect the exposure or disclosure obligation of a site. A hazard reclassification, for example, could be connected to policy conditions and turned into a dated action. ScyAI also frames outputs for insurer assessment, which suggests that the product aims to improve the evidence available during renewal negotiations. Buyers should verify how sources are selected, refreshed and reconciled, and whether every generated interpretation can be traced to an exact policy clause or property record. Insurance wording is contextual, and a flagged mismatch is a prompt for professional review rather than a coverage opinion. ScyAI does not publicly establish that its output replaces a broker, valuation professional, engineer, insurance counsel or catastrophe model.

    9AI Framework: Dimension by Dimension Analysis

    CRE Relevance: 6/10

    ScyAI scores 6 for CRE relevance. The product addresses physical assets, property hazards, replacement values, business interruption and insurance wording, all of which matter to owners and operators. Its portfolio and location views also fit the way institutional real estate teams supervise distributed properties. However, ScyAI describes its audience as asset heavy companies rather than CRE firms specifically. Its examples extend to industrial plants, mining operations, equipment and supply chain exposures. That breadth is useful for mixed portfolios but means the data model may not reflect every CRE workflow, such as lease administration, property accounting, tenant utility data or building certifications. BestCRE’s analysis is that the product is CRE adjacent, with strong relevance to corporate real estate, industrial facilities and operational portfolios. A pure investment manager will need to confirm that the system supports fund, entity, asset and lender reporting structures.

    Data Quality and Sources: 7/10

    ScyAI scores 7 for data quality because its proposed model begins with primary evidence rather than an unexplained portfolio rating. Policy wording, engineering reports, statements of values, drawings and maintenance records are appropriate inputs for identifying insurance discrepancies. Adding external hazard information can make that evidence more current and decision useful. The central strength is traceability: a useful finding should connect the policy requirement to the conflicting asset fact and its source. Public information, however, does not disclose the complete provider list, geographic coverage, refresh frequency, quality assurance process or rules for resolving contradictory documents. Buyers should also ask how the system handles scanned files, outdated valuations and incomplete maintenance records. BestCRE’s analysis is that the data architecture is credible, but the quality of any result will remain highly dependent on customer records and the provenance of external hazard layers.

    Ease of Adoption: 6/10

    ScyAI scores 6 for ease of adoption. Uploading familiar documents is a practical starting point and may reduce the need for a large data transformation project. The interface concept of facilities, gaps, changes and obligations should also be understandable to risk and insurance teams. Adoption becomes harder when documents are scattered across brokers, facilities teams, lenders and local operators. Someone must establish the authoritative asset list, identify current policy versions, resolve extraction errors and assign responsibility for findings. The vendor does not publish typical implementation duration, staffing requirements, training options or deployment benchmarks. BestCRE’s analysis is that a limited diagnostic can be relatively accessible, while portfolio scale adoption will require governance across several functions. Buyers should start with a small group of varied sites and measure document preparation effort, exception review time and the percentage of findings that result in a concrete insurance or control action.

    Output Accuracy: 6/10

    ScyAI scores 6 for output accuracy. Its examples show specific comparisons between policy clauses and operational evidence, which is more useful than a generic risk label. Clause level citations and linked source records could make errors visible and correctable. Nevertheless, insurance interpretation depends on definitions, endorsements, exclusions, jurisdiction and the complete policy structure. Asset replacement estimates and interruption scenarios also require professional assumptions. The company does not publish independent accuracy studies, extraction benchmarks, false positive rates or formal validation results. BestCRE’s analysis is that outputs should be treated as reviewable risk hypotheses, not final determinations of coverage or loss. During a pilot, buyers should create a blind test set with known discrepancies and clean controls. They should measure missed issues, unsupported flags and material interpretation errors, then require human approval before any result is sent to an insurer, lender or board.

    Integration and Workflow Fit: 5/10

    ScyAI scores 5 for integration. Its document centered approach can operate beside existing systems without requiring immediate replacement of the insurance, facilities or document stack. That is useful for a diagnostic, and common inputs such as PDF reports and spreadsheets are already present in most portfolios. The limitation is that the vendor does not publicly detail production connectors, APIs, export formats, identity standards or supported property systems. It is therefore unclear whether locations and findings can be synchronized with a risk management information system, document repository, computerized maintenance management system, valuation database or enterprise data warehouse. BestCRE’s analysis is that manual upload is acceptable for proving value but becomes a control problem at portfolio scale. A procurement review should require a documented integration map covering asset identifiers, version control, permissions, change events, audit logs and export of findings into the buyer’s established remediation workflow.

    Pricing Transparency: 3/10

    ScyAI scores 3 for pricing transparency. The vendor does not publish subscription prices, diagnostic fees, implementation charges or a standard pricing unit. A prospective buyer cannot determine whether cost is based on locations, insured value, documents, users or portfolio complexity. It is also unclear whether external hazard data, onboarding, specialist review and recurring monitoring are included. This opacity is common among young enterprise software companies, but it increases procurement effort and makes peer comparison difficult. BestCRE’s analysis is that buyers should request a fixed scope pilot followed by a fully specified annual proposal. The quote should separate software, data, implementation, professional services and renewal increases. It should also define what happens when the portfolio grows or additional policies are introduced. Without those terms, a low entry price could obscure significant expansion costs, while an expensive diagnostic may still be justified if it identifies one consequential coverage defect.

    Support and Reliability: 5/10

    ScyAI scores 5 for support because the workflow requires informed assistance, but the vendor does not publish enough detail to evaluate delivery capacity. Buyers will need help with evidence collection, asset taxonomy, policy interpretation boundaries, exception review and user training. A young provider may offer direct access to product specialists, which can be valuable during a pilot, but that is BestCRE’s analysis rather than a published service commitment. Public information does not specify service hours, response targets, customer success staffing, geographic coverage, implementation partners or formal service level terms. Procurement teams should ask who reviews extraction problems, whether insurance specialists participate, and how urgent hazard notifications are handled outside normal business hours. Support should include a clear escalation path and defined ownership when the system links an incorrect record to a policy clause. Large portfolios should also require continuity provisions so that knowledge does not depend on one vendor employee.

    Innovation and Roadmap: 8/10

    ScyAI scores 8 for innovation. The notable idea is not merely using AI to read documents. It is constructing an evidence graph across assets, controls, hazards and policy language, then monitoring where the physical reality and contractual cover diverge. That framing targets an expensive coordination failure shared by property, finance, facilities and insurance teams. The connection between changing site conditions and time sensitive policy obligations is particularly distinctive. BestCRE’s analysis is that this is a more consequential application than producing another climate score or sustainability dashboard. The score stops short of the top tier because innovation must be demonstrated in repeated operating use, not just in interface examples. Buyers should test whether the system understands endorsements and layered programs, distinguishes missing evidence from failed controls, and maintains the chain of evidence as documents change. If those mechanics work reliably, ScyAI could define a useful new layer in portfolio risk operations.

    Market Reputation: 5/10

    ScyAI scores 5 for market reputation. It is an early stage European company with pre seed funding of EUR 2 million, and its public profile remains limited compared with established property technology, engineering and insurance analytics vendors. The vendor does not publish a substantial customer roster, quantified portfolio deployments, retention figures or a broad collection of named case studies. That does not imply weak product quality, but it limits independent evidence about performance across geographies and insurance programs. BestCRE’s analysis is that prospective customers should evaluate the company as an emerging specialist rather than a proven enterprise standard. Reference calls should cover implementation effort, finding quality, renewal outcomes, information security and vendor responsiveness. Buyers should also assess financial continuity, data portability and contractual exit rights. The score reflects promising domain positioning tempered by limited public proof, consistent with the framework’s cap for young companies with few visible customers.

    9AI Score Card ScyAI
    57
    57 / 100
    Early Stage
    Risk Intelligence
    ScyAI
    ScyAI builds evidence based digital twins to identify differences between physical assets, operational risks, controls and the insurance policies intended to cover them.
    9 Dimensions, Scored 1 to 10
    1. CRE Relevance
    6/10
    2. Data Quality & Sources
    7/10
    3. Ease of Adoption
    6/10
    4. Output Accuracy
    6/10
    5. Integration & Workflow Fit
    5/10
    6. Pricing Transparency
    3/10
    7. Support & Reliability
    5/10
    8. Innovation & Roadmap
    8/10
    9. Market Reputation
    5/10
    BestCRE.com, 9AI Framework v2 Reviewed October 2026

    Who Should Use ScyAI

    ScyAI is best suited to corporate risk leaders, insurance managers and treasury teams responsible for large, operationally complex property portfolios. Industrial owners, logistics operators, data center businesses, infrastructure groups and corporate occupiers are plausible fits because their coverage depends on equipment, occupancy, business interruption assumptions and documented controls, not just building values. A CRE principal with multiple jurisdictions or frequent site changes may also benefit if renewal preparation currently requires extensive reconciliation among facilities records, valuations and policy schedules. The strongest buyer has a real concern that its insured description has drifted from its operating reality.

    The product may also suit brokers and risk consultants seeking a structured way to prepare client evidence and surface exceptions, although commercial terms and professional responsibilities would need clarification. Lender facing owners could use the output to examine whether insurance obligations remain aligned with credit requirements. BestCRE’s analysis is that the ideal adopter already has competent insurance and engineering advisers. ScyAI can organize evidence and focus their attention, but its value depends on specialists who can validate findings and negotiate changes. Buyers should have enough portfolio complexity and premium exposure to justify a formal diagnostic, plus an internal owner able to coordinate risk, facilities, finance and legal review.

    Who Should Not Use ScyAI

    ScyAI is not the first purchase for a small property owner with a few standardized buildings, uncomplicated insurance and limited internal risk staff. Such buyers may receive more value from disciplined statements of values, scheduled broker reviews and current replacement cost assessments. It is also a poor match for teams mainly seeking energy benchmarking, carbon accounting, utility optimization or sustainability disclosure. Those requirements call for a dedicated ESG or building performance platform rather than an insurance coverage intelligence layer.

    Buyers expecting automated legal conclusions should not proceed without resetting that expectation. Policy interpretation and loss estimation require contextual professional judgment. The product is also unsuitable for organizations unwilling to gather current source records or resolve inconsistent asset identifiers. BestCRE’s analysis is that incomplete evidence could create a polished but misleading view of risk. Firms that require mature global support, extensive standard connectors or a long record of referenceable deployments should wait until ScyAI publishes more operational proof, or use a tightly bounded pilot with strong data export and termination rights.

    Pricing and ROI Analysis

    ScyAI does not publish pricing. There is no public rate card for diagnostics, subscriptions, locations, users, documents or insured value, and the vendor does not disclose standard implementation or data charges. Buyers should request an itemized proposal that identifies the pricing unit, included hazard sources, document volume limits, onboarding work, support level and cost of adding sites. A pilot contract should define the number and type of properties, policies to be reviewed, expected outputs, acceptance criteria and rights to export both source mappings and findings. Enterprise buyers should also seek a multiyear price schedule rather than relying on an introductory diagnostic fee.

    Analysis: simple ROI should be calculated from verified actions, not the number of alerts. Assume a hypothetical annual cost of 100 currency units. If validated findings avoid 60 units of duplicated advisory work and produce an expected risk benefit of 90 units through corrected limits, evidence or terms, the estimated benefit is 150 units. Net benefit is 50 units, and simple ROI is 50 percent. These figures are illustrative, not ScyAI pricing or a promised result. A buyer should replace them with quoted costs, internal labor and probability weighted outcomes. The business case should distinguish direct savings from avoided loss, because avoided loss is uncertain and can be overstated. Renewal cycle time, accepted underwriting evidence and remediation completion are useful secondary measures.

    Integration and CRE Tech Stack Fit

    ScyAI appears designed to sit across the CRE technology stack rather than replace a core system. Source records may originate in document management, facilities maintenance, property accounting, valuation, broker or risk management systems. The product can then act as a comparison and exception layer for insurance renewal and ongoing change monitoring. A stable property identifier is essential. Without one, policies, engineering reports and hazard records can be attached to the wrong site or duplicated across entities.

    The vendor does not publish a complete connector catalog or detailed API documentation. Buyers should therefore assume that initial deployment may depend on file exchange until ScyAI confirms otherwise. BestCRE’s analysis is that integration diligence should focus on bidirectional change control, not just ingestion. The team must know when a policy, valuation or maintenance record has been superseded and whether downstream tasks were completed. Required controls include role based access, audit history, source citations, configurable exports and retention rules. For recurring use, confirmed connections to document repositories, risk systems and work management tools would materially improve scalability.

    Competitive Landscape

    ScyAI does not compete directly with every platform in the CRE Sustainability and ESG category. Jupiter Intelligence is the clearest alternative for climate risk analytics, particularly where the buyer prioritizes hazard modeling and portfolio exposure rather than insurance wording. Autodesk Forma supports early design and site analysis, while One Click LCA focuses on life cycle assessment and embodied carbon. ENERGY STAR Portfolio Manager, Measurabl and Measurabl Navigate are stronger choices for benchmarking, ESG data management and portfolio reporting. Schneider Electric EcoStruxure Building and Siemens Building X operate closer to building systems and performance. None is a simple substitute for ScyAI’s proposed comparison of site evidence with insurance coverage.

    Insurance focused buyers should also compare ScyAI with their broker’s analytics, a risk management information system, catastrophe modeling services and specialist risk engineering reviews. Those alternatives may offer deeper insurance expertise or established carrier acceptance, but they can remain fragmented and periodic. ScyAI’s advantage is the potential to maintain one evidence based view of coverage drift across locations. Its disadvantage is limited public proof and unclear integration maturity. BestCRE’s analysis is that selection should follow the primary job. Choose a sustainability platform for emissions and disclosure, a climate analytics provider for hazard quantification, and ScyAI when the central question is whether changing physical assets and controls still match the contractual insurance program.

    The Bottom Line

    ScyAI is a credible candidate for a controlled insurance risk diagnostic, especially for industrial, infrastructure and corporate real estate portfolios where asset changes can outpace policy updates. Its evidence based digital twin and coverage comparison address a specific operational problem with potentially material consequences. BestCRE would not yet select it as the portfolio’s primary ESG or risk system because market proof, pricing, integrations and independent accuracy evidence remain limited.

    The buying decision should be conditional. Select a representative pilot spanning straightforward and complex sites, include known defects and clean records, and require traceable findings that specialists can validate. Proceed to portfolio deployment only if ScyAI identifies material issues with an acceptable false positive burden and fits the existing remediation process. Buyers primarily seeking carbon, energy or disclosure capabilities should choose a more established category specialist. For the right insurance workflow, ScyAI merits testing, but not blind trust.

    About BestCRE

    BestCRE.com is the definitive authority on commercial real estate AI, analysis, and investment intelligence. Every article advances the platform’s mission to help CRE professionals identify, evaluate, and adopt the best tools and strategies in the industry. We benchmark platforms using the 9AI Framework so CRE leaders can compare tools with clear evidence. Explore the category map at 20 CRE sectors for deeper coverage across the CRE stack.

    Frequently Asked Questions

    What is ScyAI?

    ScyAI is an AI risk intelligence product for companies with substantial physical assets. It organizes property, equipment, hazard, control and insurance evidence into a digital twin for each location. The system is intended to reveal differences between the assets a company actually operates and the assets, values, conditions or exposures described in its insurance program. Its workflow is relevant to corporate risk managers, insurance teams, facilities leaders, finance teams and advisers preparing for renewal. ScyAI is not primarily a carbon accounting, energy management or building automation platform. BestCRE’s analysis is that it belongs at the intersection of portfolio risk management and insurance operations, with a secondary role in climate and ESG governance. Findings still require review by qualified insurance, engineering, valuation or legal professionals.

    How does ScyAI compare property records with insurance coverage?

    ScyAI accepts records such as policy documents, statements of values, engineering reports, maintenance programs and site drawings. It extracts information about assets, occupancies, exposures and controls, adds external hazard data, and links those facts to the relevant location. The product then compares documented site reality with policy terms and flags possible mismatches or obligations. Examples can include outdated values, short interruption periods, inadequate hazard limits, changed occupancies or missing inspection evidence. The differentiator is the connection between source evidence and insurance wording, rather than a standalone hazard score. BestCRE’s analysis is that buyers should test clause citations, document versioning and false positives carefully. A system generated flag is a review item, not a definitive interpretation of whether a claim would be covered.

    How much does ScyAI cost?

    ScyAI does not publish its prices. Buyers must contact the company for a diagnostic or enterprise proposal. Public information does not establish whether fees are calculated by location, user, document volume, insured value or portfolio complexity. It also does not clarify whether onboarding, external hazard data, specialist review and ongoing monitoring are included. A useful quote should separate subscription, implementation, data and professional service charges. It should state document limits, supported policies, renewal terms and the cost of adding properties. BestCRE’s analysis is that a fixed scope pilot is the safest entry point. Payment milestones should be tied to agreed deliverables, such as completed site twins, traceable policy comparisons and validated findings, rather than the raw volume of generated alerts.

    Who should use ScyAI?

    ScyAI best suits companies with large or complex portfolios where physical operations, equipment and insurance terms change frequently. Likely users include corporate insurance managers, risk leaders, treasury teams, industrial property operators, logistics businesses, data center owners, infrastructure groups and corporate real estate departments. It may also help brokers or consultants structure evidence for renewal, subject to suitable commercial and professional arrangements. The strongest customer already has insurance and engineering expertise but lacks a consistent way to connect records across sites and policies. BestCRE’s analysis is that small landlords with simple coverage will often find a broker review and updated valuation more proportionate. It is also not the right primary tool for organizations whose main need is emissions reporting, utility management, green certification or sustainability disclosure.

    Can ScyAI become a core platform for portfolio risk management?

    ScyAI could become an important portfolio risk layer if it proves that its digital twins remain accurate as assets, hazards, controls and policies change. The concept is strong because insurance gaps often arise between organizational functions rather than inside one system. Reaching core platform status will require more public evidence of customer adoption, independent accuracy, repeatable implementation and enterprise support. It will also require dependable connections to document repositories, maintenance systems, risk platforms and work management tools. BestCRE’s analysis is that the near term role is more likely to be a focused diagnostic and monitoring layer than a system of record. Buyers should watch for published reference cases, connector documentation, validation methods and transparent service commitments before making ScyAI operationally critical.

    Related Reviews

    Compare ScyAI with other Market Analytics & Data tools BestCRE has scored: Autodesk Forma (74/100), Measurabl (72/100), ENERGY STAR Portfolio Manager (71/100) and Restb.ai (67/100). Browse every review in CRE Market Analytics & Data, the full Best CRE AI Tools directory, or the 20 CRE Sectors hub.

  • Restb.ai Review: Computer vision for property image analysis

    Restb.ai Review: Computer vision for property image analysis

    BestCRE 9AI Score

    67/100 · Niche

    Restb.ai ranks #366 of 514 commercial real estate AI tools scored on the 9AI Framework. Nine dimensions, each scored out of 10: CRE relevance, data quality, ease of adoption, output accuracy, integration fit, pricing transparency, support, innovation and market reputation.

    Restb.ai is a real estate computer vision provider used by appraisers, lenders, valuation firms, listing services and property platforms. Its software changes the image review stage of valuation by converting photographs into structured observations about rooms, features, condition and quality. Instead of asking an analyst to inspect every image manually, a client can send property imagery through Restb.ai and return standardized classifications for use in appraisal review, comparable selection, automated valuation models and workflow triage.

    The central buyer question is whether visual analysis can make an existing valuation process faster or more consistent without introducing opaque assumptions. Restb.ai is not a complete appraisal platform, a source of transaction records or a replacement for professional judgment. It is an intelligence layer for images. That distinction matters in commercial real estate, where photographs may be incomplete, dated or poorly aligned with the spaces and building systems that drive value.

    Restb.ai offers image tagging, condition and quality analysis, visual similarity search, comparable-property support, photo compliance, duplicate detection, captions, descriptions, watermark detection and appraisal complexity assessment. The company reports processing about 2 billion photos per month. That reported scale is notable, but volume alone does not establish accuracy for a buyer’s asset classes, geographies or image standards. A procurement process should therefore emphasize validation on the buyer’s own photographs and review decisions.

    BestCRE analysis: Restb.ai is strongest as specialized infrastructure for organizations processing large image volumes, particularly in residential appraisal, listing and valuation workflows adjacent to CRE. Its commercial property value depends on the assignment. Standardized multifamily units and repeatable portfolios are more natural fits than specialized industrial plants, hospitality properties or assets whose value rests on leases, operations and hidden systems. Clear Capital‘s 2026 acquisition may improve distribution and workflow access, although buyers should ask how ownership affects product priorities, contracting and data governance.

    What Restb.ai Does and How It Works

    Restb.ai receives property images and applies computer vision models that classify what appears in them. Depending on the selected product, outputs can identify room types, interior and exterior features, architectural characteristics, image quality, property condition and apparent quality. These observations can be returned as structured fields rather than left inside photographs. A valuation system can then use those fields to filter records, flag inconsistencies, support model inputs or direct a human reviewer toward images requiring attention.

    Condition analysis is the most relevant capability for valuation teams. Human descriptions of condition vary considerably, so Restb.ai seeks to apply a consistent visual standard across a portfolio. Visual similarity tools can also compare property images, while comparable-property functions incorporate image-derived condition and quality signals into comp selection. For appraisal and inspection users, complexity assessment and automated quality checks can help route difficult assignments or flag a report whose photographs appear inconsistent with recorded facts. These functions support decisions, but they do not establish legal condition, remaining useful life or the cost to cure a defect.

    The broader product set addresses operational uses around the core analysis. Photo compliance can detect images that may violate listing or report rules. Duplicate and watermark detection can identify reused or modified media. Captions and property descriptions turn visual observations into text for accessibility, search and listing production. Practical deployment typically requires a client to transmit images, map returned labels into its data model and establish thresholds for automated action. BestCRE analysis: the output should initially be treated as a signal, not a final conclusion. Buyers should test false positives, missing views, renovation bias, image age, inconsistent lighting and performance across property types before allowing results to influence valuation or risk decisions.

    9AI Framework: Dimension by Dimension Analysis

    CRE Relevance: 7/10

    BestCRE analysis: 7 out of 10. Restb.ai addresses a real valuation problem, extracting consistent observations from property photographs for condition review, comparable selection and quality control. Those functions can matter in CRE, especially for multifamily portfolios, appraisal management and high-volume lending. The limitation is product orientation. Much of the stated workflow and terminology centers on homes, listing services, automated valuation models and residential appraisal. Commercial value frequently depends on leases, tenant credit, zoning, building systems, environmental factors and operating performance that photographs cannot resolve. The product is therefore CRE-adjacent rather than a complete commercial valuation system. A buyer should confirm support for its property types and avoid assuming that residential image labels transfer cleanly to offices, warehouses, retail centers, hotels or specialized assets.

    Data Quality and Sources: 8/10

    BestCRE analysis: 8 out of 10. Restb.ai’s focus on property imagery gives it a purpose-built data foundation that generic vision services do not offer. The reported processing scale suggests substantial exposure to varied real estate photos, and the product produces structured classifications across condition, quality, rooms and features. Still, buyers do not receive complete assurance merely from scale. Image-derived data inherits the limitations of the source photograph, including selective framing, poor lighting, old images, duplicate media and missing areas. The vendor does not publicly disclose all training-data composition, label governance or performance by commercial asset subtype. Buyers should request field definitions, confidence scores, test-set methodology and geographic coverage. The highest score is withheld because commercial valuation requires evidence that outputs remain consistent across the buyer’s specific imagery, not only across broad real estate datasets.

    Ease of Adoption: 7/10

    BestCRE analysis: 7 out of 10. The product can fit into an existing workflow without requiring users to replace their appraisal, valuation or listing system. That modularity should make a pilot manageable for organizations that already store property images in accessible systems and can consume structured results. Restb.ai also offers demonstrations, which can help teams understand output categories before technical work begins. Adoption becomes harder when images lack stable property identifiers, arrive in inconsistent formats or sit across disconnected repositories. Operational teams must decide which scores trigger review, which remain informational and when a human can override the result. The vendor does not publish a universal implementation timeline. Ease therefore depends less on the visual model itself and more on image governance, integration resources and the buyer’s willingness to redesign review rules around probabilistic output.

    Output Accuracy: 7/10

    BestCRE analysis: 7 out of 10. Restb.ai presents image analysis as a way to improve valuation consistency, and its public site cites case-study outcomes for selected customer applications. Those examples are useful signals, but they do not constitute a universal accuracy benchmark for commercial assets. Condition and quality are subjective, while photos may omit defects or emphasize recently improved spaces. A model can accurately identify what is visible and still support the wrong valuation conclusion if the imagery is incomplete or stale. Buyers should construct a blinded test using representative assets, human-reviewed labels and predefined acceptance thresholds. They should measure errors by property type, feature and downstream consequence rather than rely on one aggregate rate. The score reflects a credible specialized capability while reserving judgment on performance in each buyer’s CRE portfolio.

    Integration and Workflow Fit: 7/10

    BestCRE analysis: 7 out of 10. Restb.ai is positioned as an intelligence component that feeds other real estate products and workflows, which is appropriate for lenders, appraisal firms, listing services and valuation platforms. Its structured outputs can support automated valuation models, comparable searches, quality-control queues and listing databases. This architecture is more useful than a closed standalone interface for enterprise buyers. However, the vendor’s public information does not provide enough detail to score every connector, implementation method or commercial system relationship. Buyers should verify image ingestion limits, response formats, batch processing, identity matching, security controls, audit logs and the handling of corrected labels. Integration value will be highest where property IDs and images already follow consistent standards. Fragmented portfolios may require meaningful data engineering before the model’s results become operational.

    Pricing Transparency: 3/10

    BestCRE analysis: 3 out of 10. Restb.ai does not publish standard prices, usage tiers or implementation fees on its public website. Prospective customers are directed toward demonstrations and sales contact, leaving buyers unable to estimate cost before discussing image volume and product scope. Custom pricing is understandable for an enterprise image-analysis service, but the absence of even indicative units makes early comparison difficult. Procurement teams should ask whether charges are based on images, properties, API calls, selected modules, minimum commitments or processing frequency. They should also identify fees for setup, model customization, support and data retention. BestCRE analysis: a credible business case requires the buyer to connect total annual cost with avoided manual reviews, faster cycle times or measurable model improvement. Without a written proposal and clear usage assumptions, pricing predictability remains weak.

    Support and Reliability: 6/10

    BestCRE analysis: 6 out of 10. Restb.ai presents demonstrations, customer-specific discussions, case studies and advisory experience around visual intelligence. Those signals suggest that enterprise buyers can obtain guidance, but the vendor does not publish enough detail about support tiers, guaranteed response times, implementation staffing or service-level commitments. Clear Capital ownership may provide additional operational reach, although buyers should not assume that every Restb.ai customer receives the same support structure. A contract should identify the implementation owner, escalation path, incident response expectations and process for disputing or correcting model outputs. Valuation users also need notice when models, labels or scoring methods change, because an apparently small revision can affect review thresholds and historical comparability. The score recognizes a mature enterprise orientation while reflecting limited public evidence about standardized support terms.

    Innovation and Roadmap: 8/10

    BestCRE analysis: 8 out of 10. Restb.ai applies computer vision to a part of real estate analysis that remains difficult to structure at scale. Turning photographs into condition, quality, feature and similarity signals creates useful inputs that conventional property records often lack. The combination of tagging, visual comparables, compliance checks, duplicate detection and complexity assessment extends beyond simple object recognition. For valuation teams, the notable innovation is not image labeling by itself, but the possibility of applying consistent visual evidence across large review queues. BestCRE analysis: the approach is differentiated, although it should not be confused with a complete valuation methodology. Similar capabilities are available from other property intelligence vendors, and general vision models continue to improve. Restb.ai must maintain its advantage through real estate-specific taxonomies, defensible evaluation and workflow integration rather than novelty alone.

    Market Reputation: 7/10

    BestCRE analysis: 7 out of 10. Restb.ai has an established profile in real estate image intelligence and publicly identifies use cases spanning valuation, appraisal, listing services, search and insurance. Its reported processing volume and published case studies indicate enterprise-scale usage, although the vendor does not publish a complete customer count or detailed adoption figures for commercial real estate. Acquisition by Clear Capital in 2026 adds a recognized valuation-industry owner and may expand access to lending and appraisal workflows. It also creates questions about product independence and strategic focus that buyers should address during diligence. The score places Restb.ai above an early-stage specialist with limited market evidence, but below vendors whose commercial property coverage, financial scale and customer references are more fully documented. Reputation is credible, while direct CRE proof remains less extensive than residential real estate proof.

    9AI Score Card Restb.ai
    67
    67 / 100
    Emerging Tool
    Visual Property Intelligence
    Restb.ai
    Restb.ai converts property imagery into standardized condition, quality and feature data for valuation, appraisal review, compliance and comparable selection workflows.
    9 Dimensions, Scored 1 to 10
    1. CRE Relevance
    7/10
    2. Data Quality & Sources
    8/10
    3. Ease of Adoption
    7/10
    4. Output Accuracy
    7/10
    5. Integration & Workflow Fit
    7/10
    6. Pricing Transparency
    3/10
    7. Support & Reliability
    6/10
    8. Innovation & Roadmap
    8/10
    9. Market Reputation
    7/10
    BestCRE.com, 9AI Framework v2 Reviewed October 2026

    Who Should Use Restb.ai

    Restb.ai should be considered by appraisal management companies, lenders, valuation firms and property data platforms that process large, recurring volumes of images. The strongest buyer already has a defined review workflow and wants to add consistent visual signals for condition, quality, comparable selection or exception handling. Multifamily lenders and portfolio operators may find the technology especially relevant when unit and building images follow repeatable patterns. Listing services and marketplaces can also use the same infrastructure for tagging, compliance, accessibility text and media quality.

    The product also suits technical teams building automated valuation models or internal property intelligence systems. These buyers can combine image-derived attributes with transactions, property records and market data, then test whether the added signal improves a specific decision. BestCRE analysis: organizations should enter procurement with a measurable hypothesis, such as reducing manual image review or identifying reports requiring extra scrutiny. A representative pilot should precede broader use. Success requires enough image volume to justify integration, reliable property identifiers and subject-matter experts who can evaluate errors rather than accept model output at face value.

    Who Should Not Use Restb.ai

    Restb.ai is a weak fit for firms seeking an end-to-end commercial appraisal platform, discounted cash flow software, lease analysis or market forecasting. It does not replace ARGUS Enterprise, a property database or an appraiser’s reconciliation. Small teams that review only a limited number of properties may also struggle to justify integration and enterprise contracting when manual inspection remains practical.

    Buyers focused on specialized assets should proceed cautiously. Industrial plants, data centers, hotels, senior housing and complex mixed-use properties contain operational and physical factors that ordinary listing photographs may not capture. The tool is also unsuitable when image provenance, date or coverage cannot be trusted. BestCRE analysis: if a firm cannot assemble a representative validation set or define how the output will influence a decision, it should first improve its image governance and workflow design.

    Pricing and ROI Analysis

    Restb.ai does not publish standard pricing, package rates or minimum commitments. Buyers must contact the company for a proposal based on their use case and likely processing volume. A complete quote should separate recurring usage, implementation, customization, support, storage and any minimum annual commitment. Procurement should also clarify whether multiple analyses on one photograph generate separate charges and whether reprocessing is billed when models or source images change.

    BestCRE analysis: simple ROI math should begin with the current review burden. Multiply annual image-review hours by the fully loaded hourly cost, then add the estimated cost of avoidable rework or delayed decisions. Compare that amount with the complete first-year contract and internal integration expense. For example, a buyer can calculate the break-even point as total annual program cost divided by the labor cost avoided per reviewed property. This is an analytical formula, not a claim about Restb.ai savings. Any projected benefit should be discounted for human quality checks, false positives and the share of images that cannot be processed reliably.

    Integration and CRE Tech Stack Fit

    Restb.ai fits best as an API or data service inside an existing property workflow. Image-derived fields can feed appraisal review systems, lender decision tools, valuation models, listing databases, comparable searches and compliance queues. The buyer should preserve the original image, returned label, confidence information, model version and review outcome so that decisions can be audited and later retested.

    Commercial deployment depends on identity and data quality. Property, unit and image identifiers must remain aligned across storage, valuation and workflow systems. Buyers should confirm supported file formats, batch capacity, latency, access controls, retention rules and procedures for corrected results. BestCRE analysis: treat the integration as a governed model input rather than a simple media plug-in. That approach makes overrides, monitoring and downstream accountability easier.

    Competitive Landscape

    FoxyAI is the closest specialist comparison for buyers evaluating image-derived property condition and quality signals. Hover is stronger where detailed property measurements, exterior capture and project workflows matter, while ZestyAI emphasizes property risk intelligence for insurance and related decisions. HouseCanary and Cotality offer broader property data and valuation ecosystems, which may appeal to buyers wanting imagery alongside established records and analytics rather than a focused visual intelligence layer.

    Clear Capital is both an alternative valuation provider and, following its 2026 acquisition of Restb.ai, the product’s owner. Buyers should determine whether contracting through the broader Clear Capital environment provides operational benefits or reduces flexibility. Green Street and Deepblocks address different parts of CRE analysis, with stronger emphasis on commercial market intelligence or development feasibility rather than photo interpretation. ARGUS Enterprise remains the relevant alternative for cash flow valuation, but it is complementary rather than directly competitive.

    BestCRE analysis: choose Restb.ai when image understanding is the defined gap and a team can integrate the result into an existing decision process. Choose a broader data vendor when parcel, transaction, market and valuation coverage matters more than visual depth. Choose Hover for capture and measurement-heavy workflows. No alternative should be selected on feature lists alone. Test the same image set, property types and review outcomes across shortlisted vendors.

    The Bottom Line

    Restb.ai is a credible specialist for organizations that need to turn large property-image collections into structured valuation and workflow signals. Its strongest case is consistent condition and quality analysis at a scale where manual review becomes slow or uneven. It is not a complete CRE valuation product, and its residential orientation limits automatic transfer to every commercial asset class.

    BestCRE analysis: shortlist Restb.ai for multifamily, appraisal review, lending and property-platform use cases, but require a paid or controlled pilot using representative images. Contract only if the test demonstrates acceptable errors, useful workflow impact and clear economics after integration and human review. Buyers with low image volume, specialized assets or a need for full underwriting software should select a different category of product.

    About BestCRE

    BestCRE.com is the definitive authority on commercial real estate AI, analysis, and investment intelligence. Every article advances the platform’s mission to help CRE professionals identify, evaluate, and adopt the best tools and strategies in the industry. We benchmark platforms using the 9AI Framework so CRE leaders can compare tools with clear evidence. Explore the category map at 20 CRE sectors for deeper coverage across the CRE stack.

    Frequently Asked Questions

    What is Restb.ai?

    Restb.ai is a real estate computer vision service that analyzes property photographs and converts their visible content into structured data. Its products can identify room types, property features, apparent condition and quality, visually similar properties, duplicate images, watermarks and potential photo-compliance issues. Appraisers, lenders, valuation firms, listing services and property platforms can use those outputs in review queues, comparable searches, automated valuation models and listing workflows. It is not a complete appraisal or underwriting system. The software interprets imagery, while transaction data, leases, operating performance, market evidence and professional judgment remain separate requirements. Clear Capital acquired Restb.ai in 2026.

    How does Restb.ai compare with other property AI tools?

    Restb.ai concentrates on extracting real estate information from images. FoxyAI is a close comparison for visual property condition and quality analysis. Hover is more oriented toward property capture, measurements and project-related workflows. ZestyAI focuses more heavily on property risk intelligence, while HouseCanary and Cotality combine valuation or property analytics with broader datasets. Restb.ai is attractive when the primary gap is unstructured image content and the buyer already has systems for valuation and workflow management. BestCRE analysis: buyers should compare vendors using the same representative photo set and measure errors by property type and business consequence. General feature comparisons cannot show whether a model handles a specific portfolio, image source or review standard reliably.

    How much does Restb.ai cost?

    Restb.ai does not publish standard prices, usage rates or package tiers. Buyers must request a proposal, likely reflecting the selected products, processing volume, implementation needs and support arrangement. Procurement teams should ask whether billing is based on images, properties, analyses, API calls or minimum commitments. They should also request separate figures for setup, customization, storage, reprocessing and support. BestCRE analysis: evaluate price against a documented baseline, such as annual manual review time and the cost of rework. The break-even volume can be calculated by dividing the complete annual program cost by the labor and error cost avoided per property. Buyers should not accept projected savings without accounting for human verification, integration effort and images that produce unusable results.

    Who should use Restb.ai?

    Restb.ai best suits lenders, appraisal management companies, valuation firms, listing services and property platforms that handle enough imagery to make manual analysis costly or inconsistent. Multifamily portfolios are a plausible CRE application because repeated unit and building types can support standardized review. Technical teams can also add image-derived condition or quality attributes to internal valuation models and comparable searches. The product is less suitable for small review volumes or firms needing lease analysis, cash flow modeling and full appraisal production. Specialized properties require additional caution because photographs may omit the systems and operational factors that drive value. BestCRE analysis: the ideal customer has clean image access, stable property identifiers, a measurable workflow problem and staff capable of validating model errors.

    Will Restb.ai become more useful for commercial real estate?

    Restb.ai could become more useful in CRE as lenders and operators collect better property imagery and connect visual observations with inspections, transactions and asset-management records. Clear Capital ownership may also bring the technology closer to established valuation workflows. The opportunity is strongest where portfolios contain repeatable assets and frequent review events, including multifamily lending and servicing. Progress should be judged by published validation across commercial property types, clearer model governance and easier integration with valuation systems. BestCRE analysis: image intelligence will remain an input rather than a complete answer because photographs cannot establish lease economics, tenant credit, environmental liability or hidden building condition. Future value therefore depends on how well Restb.ai combines its visual specialization with auditable data and human review.

    Related Reviews

    Compare Restb.ai with other Market Analytics & Data tools BestCRE has scored: Hover (71/100), Deepblocks (70/100), Climate X (69/100) and ZestyAI (63/100). Browse every review in CRE Market Analytics & Data, the full Best CRE AI Tools directory, or the 20 CRE Sectors hub.

  • Preqin Review: Private markets intelligence for real estate fundraising

    Preqin Review: Private markets intelligence for real estate fundraising

    BestCRE 9AI Score

    71/100 · Contender

    Preqin ranks #224 of 469 commercial real estate AI tools scored on the 9AI Framework. Nine dimensions, each scored out of 10: CRE relevance, data quality, ease of adoption, output accuracy, integration fit, pricing transparency, support, innovation and market reputation.

    Preqin is a private markets data and research platform used by fund managers, institutional investors, placement agents and advisers. For commercial real estate firms, its most consequential role is near the beginning of the capital raising workflow: identifying institutions that invest in real estate funds, studying their preferences and building a more defensible list of prospective limited partners. It also supplies fund, manager, performance, term, asset, service provider and market information that can support fundraising preparation, manager research and benchmarking.

    The central buying question is whether better market intelligence will materially improve a firm’s fundraising effort. Preqin can help a real estate sponsor replace scattered web research and incomplete contact lists with a structured view of private market participants. A team can investigate investor allocations, strategies, locations and relationships before deciding whom to approach. That makes the product most valuable when the addressable investor universe is institutional, international or difficult to map through existing relationships.

    Preqin should not be mistaken for a complete investor relations operating system. Platforms such as Juniper Square, InvestorFlow and Altvia focus more directly on relationship management, fundraising processes, investor communications, subscriptions and ongoing administration. Preqin’s distinctive value is the information layer. It helps a team decide which investors and managers deserve attention, while another system may still be needed to manage outreach, documents, commitments and post-close communications.

    BestCRE’s analysis is that Preqin is one of the stronger data purchases available to an established real estate capital markets team, but it is not automatically the best category purchase for every sponsor. Its breadth across alternative assets strengthens institutional prospecting and comparative research, yet that breadth also makes it less CRE-specific than purpose-built sponsor software. Pricing is not publicly listed, so buyers must validate coverage, freshness, export rights and expected usage in a controlled evaluation before committing.

    What Preqin Does and How It Works

    Preqin Pro provides searchable profiles and datasets covering private market investors, fund managers, funds, performance, strategies, deals and related organizations. In a real estate fundraising workflow, a user can screen for institutions whose characteristics appear compatible with a proposed vehicle, then review profiles to understand investment interests and activity. The platform also covers private equity, venture capital, private credit, infrastructure, hedge funds, secondaries and natural resources, so firms raising multi-strategy capital can examine relationships beyond real estate alone. The practical output is a researched target universe, not a guaranteed pipeline of interested investors.

    Preqin also supplies research, benchmarks, indices and intelligence on fund terms. These resources can help a manager compare performance or commercial terms with relevant peers, prepare market materials and answer investment committee questions. Investors can use the same information for manager selection, preliminary due diligence, portfolio monitoring and negotiations. Enterprise Data Solutions provides data delivery options for organizations that want information inside internal systems, while Company Intelligence and Transaction Intelligence extend the product into company and transaction research. The exact fields, history and access rights depend on the purchased product and contract.

    The product increasingly addresses AI-assisted workflows. Preqin describes AI-related data capabilities and offers Preqin MCP for connecting private markets information with AI workflows. BestCRE’s analysis is that this direction matters because fundraising teams spend considerable time finding, reconciling and summarizing fragmented records. However, an AI interface does not remove the need for human verification. Investor mandates change, organizations restructure and stated preferences may not reflect current appetite. Buyers should test several known investors, inspect source dates and compare platform records with internal knowledge before treating any profile as outreach-ready.

    9AI Framework: Dimension by Dimension Analysis

    CRE Relevance: 7/10

    A score of 7 reflects meaningful real estate coverage within a broader alternative assets platform. Preqin covers real estate investors, funds, performance, terms, assets and service providers, making it directly useful for institutional fundraising, manager selection and market benchmarking. It is especially relevant to managers raising closed-end or other private real estate vehicles from pensions, endowments, foundations, insurers, sovereign institutions, family offices and consultants. The limitation is workflow depth. Preqin is not principally a property operating platform, brokerage system, underwriting application or investor portal. Even within capital raising, it supplies intelligence more than end-to-end execution. A sponsor may still need a CRM, subscription workflow, document room and investor reporting system. BestCRE’s analysis is that the platform earns strong CRE relevance for fund-level capital formation, but not the highest score because real estate is one of several covered asset classes rather than the sole product focus.

    Data Quality and Sources: 9/10

    A score of 9 recognizes Preqin’s position as a specialist provider of structured private markets information. Its datasets span investors, managers, funds, performance, terms, companies, deals and other market participants, with real estate included as a defined asset class. This breadth allows a user to connect an investor profile with its apparent strategy, allocations and private market activity rather than relying on a simple directory. The important caveat is that private markets are inherently difficult to observe. Mandates, contacts, performance figures and fundraising status can become stale or remain undisclosed. No commercial database eliminates those gaps. Buyers should examine field definitions, update dates, sources and treatment of estimated or unavailable values. BestCRE’s analysis is that Preqin’s data foundation is a major strength, particularly for comparative research, but firms should validate individual records before using them for sensitive outreach, valuation conclusions or investment committee decisions.

    Ease of Adoption: 6/10

    A score of 6 reflects a product that can improve research quickly but requires process discipline to produce durable results. Search, screening and profile review are understandable concepts for analysts, and an experienced capital markets professional should be able to use the core platform without redesigning an entire organization. Adoption becomes harder when teams must agree on target criteria, define ownership between research and relationship managers, reconcile Preqin records with a CRM and prevent duplicate outreach. Broad asset coverage and numerous data fields can also overwhelm occasional users. The vendor promotes educational resources through Preqin Academy, but public information does not establish a universal onboarding format or implementation period for every subscription. BestCRE’s analysis is that dedicated research and fundraising teams should reach value faster than small sponsors whose principals use the system intermittently. A pilot should require users to complete actual target-list, benchmarking and diligence tasks, not merely attend a product demonstration.

    Output Accuracy: 8/10

    A score of 8 reflects generally credible structured outputs with limitations created by the opacity of private markets. Preqin can organize investor, fund, benchmark, term and performance information into research that is more consistent than ad hoc internet searches. Accuracy still depends on the underlying field, reporting period, contributor and methodology. A historical fund record has a different confidence profile from an investor’s current appetite or an inferred fundraising plan. Users must also distinguish reported data from calculated benchmarks and qualitative profile information. The vendor publishes information about its datasets and methodologies, but it does not publicly guarantee that every record will be complete or current. BestCRE’s analysis is that Preqin is suitable for screening, market context and defensible comparative work when analysts preserve definitions and dates. It should not serve as the sole source for final diligence, compliance checks or assertions about whether a specific institution is presently willing to commit.

    Integration and Workflow Fit: 8/10

    A score of 8 reflects multiple ways to use Preqin beyond a standalone research interface. Preqin markets Enterprise Data Solutions for flexible delivery and offers Preqin MCP for AI workflows, indicating a strategy built around bringing private markets data into other environments. This is valuable for firms that want analysts to work from governed internal datasets or enrich a relationship management system. The practical fit depends on contractual data rights, available connectors, API or feed specifications and the buyer’s technical capacity. Public product information does not establish that every CRM or CRE application has a ready-made native connector. BestCRE’s analysis is that sophisticated managers should be able to place Preqin within a modern data architecture, but smaller firms may rely on exports and manual processes. Buyers should confirm permitted storage, redistribution, retention and AI usage before designing integrations, since technical access does not automatically grant unrestricted use of licensed data.

    Pricing Transparency: 3/10

    A score of 3 reflects the absence of public subscription prices for the principal commercial products. Preqin directs prospective customers toward account creation, product exploration and demonstrations, but it does not publish a standard rate card that lets a CRE buyer estimate annual cost independently. Pricing may vary by product, dataset, user count, delivery method, geography or contractual rights, although the vendor does not publicly provide a complete formula. This makes comparison with other systems harder and places more responsibility on procurement. Buyers should request an itemized proposal that identifies included modules, seats, data exports, integration access, renewal terms, usage limitations and support. BestCRE’s analysis is that opacity is especially consequential for smaller sponsors because the return depends on a limited number of fundraising processes. An evaluation should define the precise data needed and resist paying for broad coverage that the team will not routinely use.

    Support and Reliability: 6/10

    A score of 6 reflects visible client resources but limited public evidence about service levels attached to each package. Preqin provides research, educational content, events, webinars, contact channels and Preqin Academy, all of which can help users understand private market concepts and product applications. Those resources do not reveal the response commitments, dedicated account coverage, implementation assistance or escalation procedures available under a particular contract. Support quality may also matter differently by use case. A research subscriber mainly needs help with search logic and field interpretation, while an enterprise data customer may require technical documentation, delivery monitoring and data issue resolution. BestCRE’s analysis is that the public support footprint appears credible, but a higher score would require clearer, package-specific service commitments. Buyers should ask who handles data corrections, how disputed records are reviewed, what training is included and whether technical support for feeds or integrations carries separate terms.

    Innovation and Roadmap: 8/10

    A score of 8 reflects meaningful product development around data delivery, benchmarks and AI workflows. Preqin MCP is particularly notable because it is intended to connect private markets data with AI-based work, potentially reducing the friction of retrieving and summarizing information across large datasets. The company also positions its benchmarks, indices, company intelligence, transaction intelligence and sustainability information as connected parts of a wider private markets data foundation. Innovation should still be judged by usable outcomes rather than product labels. AI-generated research can reproduce source gaps, omit qualifications or present stale information confidently. BestCRE’s analysis is that Preqin is moving beyond a conventional directory toward an infrastructure role for private markets intelligence. The score stops short of the maximum because buyers need evidence that newer interfaces improve their specific CRE workflow, preserve source context and operate within contracted data rights. A practical pilot should compare AI-assisted outputs with conventional searches on identical questions.

    Market Reputation: 9/10

    A score of 9 reflects Preqin’s established standing in private markets and its acquisition by BlackRock. The company has operated for more than two decades and is widely associated with alternative assets data, research and benchmarking. Its audience spans managers and investors across multiple private market strategies, giving it relevance beyond a narrow real estate software niche. BlackRock ownership further signals strategic importance, although ownership alone does not prove that every dataset or workflow is superior. Preqin states that its products are used by more than 200,000 professionals, but the company does not publicly break that figure into paying organizations, CRE users or active fundraising teams on the main product overview. BestCRE’s analysis is that few competitors match its name recognition as a private markets data provider. Buyers should nevertheless evaluate current coverage in their exact investor segment rather than treating reputation as a substitute for record-level testing.

    9AI Score Card Preqin
    71
    71 / 100
    Solid Platform
    Capital Raising Intelligence
    Preqin
    Preqin helps real estate fund managers identify prospective limited partners and evaluate funds, managers, performance, terms, deals and broader private market activity.
    9 Dimensions, Scored 1 to 10
    1. CRE Relevance
    7/10
    2. Data Quality & Sources
    9/10
    3. Ease of Adoption
    6/10
    4. Output Accuracy
    8/10
    5. Integration & Workflow Fit
    8/10
    6. Pricing Transparency
    3/10
    7. Support & Reliability
    6/10
    8. Innovation & Roadmap
    8/10
    9. Market Reputation
    9/10
    BestCRE.com, 9AI Framework v2 Reviewed October 2026

    Who Should Use Preqin

    Preqin is best suited to established real estate fund managers pursuing institutional capital across a broad or unfamiliar investor universe. A capital formation team raising a commingled fund, separate account strategy or multi-asset platform can use the database to map prospective limited partners, research allocation patterns and prepare targeted outreach. Placement agents and investor relations advisers are also logical buyers because prospect intelligence can be reused across active mandates, subject to contract terms and appropriate information controls. The strongest buyer has dedicated analysts who can validate records and convert research into CRM activity.

    Institutional allocators, investment consultants and multi-manager teams may also find substantial value in manager screening, fund comparison, benchmark analysis and term research. Large firms with data engineering resources are better positioned to use enterprise delivery and AI-oriented capabilities inside internal research systems. BestCRE’s analysis is that purchase economics improve when multiple teams repeatedly use the same information for fundraising, diligence, portfolio analysis and market reporting. Before buying, a firm should identify named workflows, expected user groups and measurable outputs, such as qualified targets researched or manager screens completed.

    Who Should Not Use Preqin

    Preqin is a weak primary purchase for a local sponsor raising mainly from personal contacts, small private investors or an established high net worth network. Those firms may gain more immediate value from an investor portal, CRM, subscription system or reporting platform. Preqin can identify institutions, but it cannot manufacture institutional readiness, replace a placement strategy or guarantee access to decision makers. Teams without someone responsible for research quality and CRM hygiene may turn an expensive information product into an underused directory.

    It is also not the right core system for property underwriting, leasing, asset management, accounting or construction oversight. Investors seeking granular building-level operating data should test whether the relevant asset records are sufficient for their purpose rather than assuming fund coverage translates into complete property intelligence. BestCRE’s analysis is that firms needing workflow execution more than market intelligence should first consider Juniper Square, InvestorFlow, Altvia, Agora, Cashflow Portal or another purpose-built operating platform.

    Pricing and ROI Analysis

    Preqin does not publish standard commercial prices for Preqin Pro, Enterprise Data Solutions, Transaction Intelligence, Company Intelligence or its other principal subscription products. Public materials invite prospects to create an account, launch the platform or book a demonstration, but they do not provide a rate card. Buyers should expect a negotiated proposal and request separate pricing for users, datasets, exports, integrations, historical access and permitted uses. Contract review should also cover renewal increases, data retention after termination and any limitations on transferring records into a CRM or AI environment.

    Analysis: ROI should be modeled using the firm’s own fully loaded labor cost and fundraising economics, not an assumed industry price. If analysts spend H hours per year assembling investor lists and the platform reduces that work by S hours, annual labor value equals S multiplied by the firm’s hourly cost. Add the expected contribution from any additional qualified meetings, weighted by the probability and net value of a resulting commitment. Then subtract the quoted subscription, implementation and integration costs. A purchase is defensible only when conservative value exceeds total cost and the team can document ongoing usage. Because no public price is available, BestCRE cannot calculate a credible universal payback period.

    Integration and CRE Tech Stack Fit

    Preqin fits best as a market intelligence layer beside a fundraising CRM and investor relations system. Researchers can identify and qualify institutions in Preqin, then move approved prospects into Altvia, InvestorFlow, Intapp DealCloud or another relationship platform for ownership, contact history, tasks and pipeline management. Juniper Square or similar systems may handle subscriptions, investor reporting and administration after interest becomes an active relationship. Clear field mapping and duplicate controls are essential because investor organizations often have multiple offices, programs and contacts.

    Enterprise data delivery and Preqin MCP create options for data warehouses, internal applications and AI-assisted research, but availability and rights should be confirmed contractually. BestCRE’s analysis is that firms should maintain provenance, source dates and confidence indicators when combining licensed data with internal records. The buyer should test identity matching, refresh frequency, deletion handling and export limits. Preqin can strengthen the stack substantially, but it should not automatically become the system of record for relationship history or investor communications.

    Competitive Landscape

    Juniper Square, which scored 82 in this category, is the stronger choice when a real estate manager prioritizes fundraising workflow, investor onboarding, reporting and administration in one CRE-oriented environment. InvestorFlow, scored at 76, and Altvia place greater emphasis on CRM processes, relationship tracking and capital raising execution. Intapp DealCloud is another credible alternative for firms wanting configurable deal and relationship management across complex institutional workflows. Preqin is differentiated by the depth and breadth of its investor, fund and private market data rather than by ownership of the entire investor lifecycle.

    SponsorCloud, scored at 77, Cashflow Portal at 73, Agora at 72, Covercy at 71 and Groundbreaker at 67 are more directly oriented toward sponsor operations, investor portals, communications or transaction administration. Carta, scored at 67, is broader corporate ownership and fund infrastructure software. These products may be better operational systems for smaller managers, but they are not direct substitutes for Preqin’s market intelligence in every case. BestCRE’s analysis is that the most sophisticated buyer may pair Preqin with one of these platforms rather than select only one.

    The deciding test is straightforward. Choose Preqin when the principal bottleneck is knowing which institutional investors, funds or managers exist and how they compare. Choose an investor relations platform when the bottleneck is managing known relationships, subscriptions, reporting or communications. Choose DealCloud, Altvia or InvestorFlow when configurable pipeline discipline is the priority. Buyers should require vendors to demonstrate the same real fundraising scenario so that database breadth is not confused with workflow completeness.

    The Bottom Line

    Buy Preqin if institutional prospecting and private market comparison are recurring, high-value activities for a real estate capital formation team. Its data breadth, benchmarks and delivery options can materially improve how a firm maps investors and prepares for fundraising. Treat it as a specialist intelligence platform, not as a replacement for CRM, subscriptions, investor reporting or human relationship development.

    Do not approve a contract based on reputation or a polished demonstration alone. Run a structured trial against known investors, difficult prospects and recent market activity. Verify record dates, contact usability, benchmark definitions, export rights and integration requirements. BestCRE’s analysis is that Preqin merits a shortlist for established institutional managers, while smaller sponsors should first determine whether workflow software would solve a more immediate problem.

    About BestCRE

    BestCRE.com is the definitive authority on commercial real estate AI, analysis, and investment intelligence. Every article advances the platform’s mission to help CRE professionals identify, evaluate, and adopt the best tools and strategies in the industry. We benchmark platforms using the 9AI Framework so CRE leaders can compare tools with clear evidence. Explore the category map at 20 CRE sectors for deeper coverage across the CRE stack.

    Frequently Asked Questions

    What is Preqin and what does it do for real estate firms?

    Preqin is a private markets data, research and benchmarking platform owned by BlackRock. Real estate fund managers use it to research institutional investors, funds, managers, performance, terms, assets and related market participants. Its most useful capital raising function is helping a team build and qualify a prospective limited partner universe based on structured information rather than scattered public searches. Institutional investors can also use it for manager screening, preliminary diligence and peer comparison. Preqin covers several alternative asset classes, so it is CRE-adjacent rather than exclusively designed for real estate. It does not replace a CRM, investor portal, subscription workflow or reporting system. BestCRE’s analysis is that its primary value is better market intelligence before and during fundraising.

    How does Preqin compare with Juniper Square and InvestorFlow?

    Preqin is primarily a private markets intelligence platform, while Juniper Square and InvestorFlow are more directly centered on investor relations and capital raising workflows. Preqin is stronger when a team needs to discover institutions, examine investor preferences, research funds and compare performance or terms. Juniper Square is generally better aligned with integrated investor onboarding, reporting, administration and CRE sponsor operations. InvestorFlow focuses more on relationship management, pipeline visibility and fundraising execution. These products can be complementary. A manager might use Preqin to identify and research prospects, then manage approved targets and existing investors in another platform. BestCRE’s analysis is that the correct choice depends on whether the bottleneck is missing market intelligence or inconsistent workflow execution.

    How much does Preqin cost?

    Preqin does not publish standard commercial pricing for its main subscription products. Prospective buyers must contact the company for a proposal, and the final quote may depend on products, datasets, users, delivery methods and usage rights. The vendor does not publish a complete pricing formula, so buyers cannot make a reliable cost comparison without sales engagement. Request an itemized quote covering seats, exports, integrations, historical data, support, renewal terms and post-termination data rights. Analysis: calculate value from documented analyst hours saved and the probability-weighted value of additional qualified fundraising opportunities, then subtract subscription and implementation costs. Do not rely on a generic payback estimate because the subscription price and each manager’s fundraising economics are not public.

    Who should use Preqin for real estate fundraising?

    Preqin best suits established real estate managers, placement agents, institutional allocators and advisers that repeatedly research a large private markets universe. It is particularly relevant to teams raising institutional vehicles across multiple regions or strategies, where personal networks and ordinary web searches leave meaningful gaps. Firms with dedicated fundraising analysts, investor relations professionals or data teams are more likely to use the platform consistently and maintain accurate CRM processes around it. A local sponsor raising primarily from known private investors may find an investor portal or fundraising CRM more immediately useful. BestCRE’s analysis is that a good Preqin buyer has a specific research bottleneck, defined target investor segments and enough recurring activity to justify a specialist data subscription.

    Will Preqin MCP change how CRE fundraising teams research investors?

    Preqin MCP could make private markets research easier to access through AI-assisted workflows by allowing approved systems to work with Preqin data. Potential uses include summarizing investor profiles, comparing funds, preparing meeting briefs and answering structured questions without manually navigating every record. The important word is could. Results will still depend on data coverage, source dates, model behavior, permissions and the quality of the user’s question. Sensitive outputs should retain citations or record provenance and receive human review before external use. Buyers must also confirm that their contract permits the intended storage, processing and AI use. BestCRE’s analysis is that MCP is a promising interface development, but adoption should be judged through controlled workflow tests rather than assumptions about general AI productivity.

    Related Reviews

    Compare Preqin with other Investor Relations & Capital Raising tools BestCRE has scored: Juniper Square (76/100), Yardi Matrix (71/100), SponsorCloud (71/100) and InvestorFlow (63/100). Browse every review in CRE Investor Relations & Capital Raising, the full Best CRE AI Tools directory, or the 20 CRE Sectors hub.

  • Esri ArcGIS Business Analyst Review: GIS market intelligence for site and trade area decisions

    Esri ArcGIS Business Analyst Review: GIS market intelligence for site and trade area decisions

    BestCRE 9AI Score

    70/100 · Contender

    Esri ArcGIS Business Analyst ranks #214 of 584 commercial real estate AI tools scored on the 9AI Framework. Nine dimensions, each scored out of 10: CRE relevance, data quality, ease of adoption, output accuracy, integration fit, pricing transparency, support, innovation and market reputation.

    Esri ArcGIS Business Analyst is location intelligence software used by site selection, market planning, retail real estate and GIS teams. Its central job is to turn geographic, demographic and commercial data into evidence for decisions about stores, facilities, territories and customer coverage. For a CRE analyst, the changed workflow is straightforward: candidate locations can be mapped, assigned realistic trade areas and compared against the people, spending patterns, businesses and competitors surrounding them.

    The product belongs to Esri, the privately held geographic information systems company headquartered in Redlands, California. Business Analyst is available through web, desktop and mobile applications and can also fit into a broader ArcGIS environment. This matters because it is not merely a dashboard placed over a fixed location database. It is part of a substantial mapping platform with spatial analysis, data management, visualization and publishing capabilities.

    Its strongest CRE application is location strategy rather than property underwriting. Analysts can create drive time areas, rings and other trade areas, profile consumers, assess market potential, examine network coverage and produce reports for proposed or existing locations. Those capabilities are particularly relevant to retail, restaurants, health care, hospitality and service businesses. The product is less directly useful for investors whose central questions concern rent rolls, lease comparables, debt, ownership, valuation or transaction probability.

    BestCRE analysis: Business Analyst is one of the most capable choices when geographic context is the core of the decision and the buyer either has GIS talent or intends to build it. Its breadth also creates friction. Teams seeking a ready made answer about visits, tenant demand or acquisition pricing may find that a more specialized CRE product reaches the conclusion faster. The buying case is strongest when the organization will reuse Esri data, maps and analytical workflows across many markets and decisions.

    What Esri ArcGIS Business Analyst Does and How It Works

    Business Analyst begins with a location or an area of interest. A user can place candidate sites on a map, import organizational data and define the geographic areas that each site is expected to serve. Those areas may be simple distance rings, travel time boundaries or more sophisticated trade areas. The software then summarizes the characteristics inside each boundary, allowing an analyst to compare candidates on population, household attributes, consumer behavior, business presence and spending potential rather than relying on municipal boundaries that may not reflect actual customer access.

    The data layer is a major part of the product. Esri says Business Analyst combines demographic, census, lifestyle, spending and business information, with global coverage spanning more than 170 countries and over 15,000 variables. Users can combine those sources with proprietary information such as customer locations, sales, facilities and property costs. Workflows include customer segmentation, market potential, territory design, location allocation, market penetration and sales forecasting. The quality of the result still depends on selecting appropriate variables, geographic units, travel assumptions and internal inputs.

    Outputs include thematic maps, comparative reports, infographics and presentations that can be shared with decision makers. Teams can use the web application for accessible analysis, desktop software for more advanced GIS work and mobile access for field use. Integration with ArcGIS also permits analysts to publish map content and connect Business Analyst findings to wider spatial workflows. BestCRE analysis: the product produces decision infrastructure, not an automatic site verdict. Its value lies in letting a qualified analyst test assumptions consistently, document the geographic evidence and communicate why one market or location compares favorably with another.

    9AI Framework: Dimension by Dimension Analysis

    CRE Relevance: 7/10

    BestCRE analysis: 7 out of 10, the top of the CRE adjacent range. Business Analyst addresses genuine CRE workflows, especially retail site selection, market planning, network optimization and trade area analysis. Drive time boundaries, customer profiling, spending estimates and location comparison can materially improve how occupiers, brokers and consultants evaluate a market. The limitation is that it is CRE adjacent rather than a complete property intelligence system. It does not center its experience on leases, rent rolls, ownership, debt, sale comparables or asset valuation. A retail location team may use it every week, while an acquisitions analyst focused on office investments may use it only occasionally. The score reflects excellent relevance to location driven real estate decisions, offset by limited coverage of the financial, transactional and operational work that defines much of commercial property analysis.

    Data Quality and Sources: 8/10

    BestCRE analysis: 8 out of 10, held below 9 because Esri publishes no accuracy metrics for its modeled estimates. Esri provides a broad combination of demographic, census, consumer spending, lifestyle and business data, supported by the geographic framework required to interpret those variables correctly. The ability to add customer, sales, facility and cost information makes the product more useful than a closed data portal. Its geographic reach also supports organizations that operate across multiple countries. Buyers should still evaluate source dates, estimate methods, update schedules and geographic consistency for every market they intend to study. Modeled consumer variables are estimates, not direct observations of every household, and small area analysis can create false precision. The high score recognizes the scope and spatial structure of the data, while preserving the distinction between a credible analytical input and verified property, transaction or customer facts.

    Ease of Adoption: 7/10

    BestCRE analysis: 7 out of 10. The web application, guided workflows and prepared reports make basic demographic mapping accessible to analysts who are not full time GIS specialists. A user can define an area, select variables and create a presentable market profile without building a mapping system from scratch. Adoption becomes harder when the organization wants advanced trade areas, custom data, territory optimization or desktop GIS analysis. Those tasks require geographic judgment, careful data preparation and familiarity with ArcGIS concepts. Large variable libraries can also encourage unfocused analysis unless the team establishes standard metrics and templates. Business Analyst is approachable relative to traditional GIS, but it is not as immediately prescriptive as a specialized location dashboard. Buyers should budget for workflow design and training, not only software access.

    Output Accuracy: 7/10

    BestCRE analysis: 7 out of 10, because no accuracy metrics or independent validation are published. Business Analyst can produce accurate and reproducible maps, calculations and area summaries when the underlying data, boundaries and analytical assumptions are suitable. Esri’s spatial tools give analysts more control over geography than products that summarize only fixed administrative areas. That control is valuable, but it also transfers responsibility to the user. A drive time setting, customer file, forecast assumption or trade area method can materially change the result. Demographic and spending estimates should not be treated as observed sales, visits or lease economics. The product therefore supports rigorous analysis without guaranteeing a correct investment or site decision. The score rewards transparent spatial mechanics and repeatable outputs, while recognizing that analytical accuracy depends heavily on methodology, input quality and professional review.

    Integration and Workflow Fit: 7/10

    BestCRE analysis: 7 out of 10, capped because no native Yardi, MRI, CoStar or Argus integration is documented. Business Analyst fits naturally within the ArcGIS ecosystem and can be used through web, desktop and mobile experiences. Organizations already storing facilities, customers, territories or planning layers in ArcGIS have a strong foundation for incorporating its data and analysis. Maps and findings can be shared across the organization, while proprietary datasets can be combined with Esri content. The main constraint is that integration depth varies by deployment, licensing and the technical resources available to the buyer. Connecting a CRM, data warehouse or property system may require ArcGIS administration, data engineering or custom configuration rather than a simple toggle. Even with that caveat, few competing market analysis products offer an equivalent geographic platform around the application. This score reflects platform fit and extensibility, not a claim that every CRE system has a packaged connector.

    Pricing Transparency: 5/10

    BestCRE analysis: 5 out of 10. Esri provides a route to pricing and purchase options, but the vendor does not publish one simple universal cost that captures every Business Analyst deployment. The relevant total can depend on the application, user structure, ArcGIS environment, data access, credits, services and organizational agreement. That makes it difficult for a buyer to determine a complete operating cost from the product description alone. A sales conversation may be reasonable for a configurable enterprise GIS product, but it reduces comparability for smaller CRE teams evaluating several tools. Buyers should request an itemized proposal that separates recurring licenses, data entitlements, consumption charges, implementation, training and optional services. Under the BestCRE methodology, limited upfront visibility caps this dimension at 5 even when the eventual proposal may be commercially competitive.

    Support and Reliability: 7/10

    BestCRE analysis: 7 out of 10, because no service levels or SOC 2 report are cited in the evidence reviewed. Esri offers the institutional support expected from a mature software provider, including product documentation, training resources, community knowledge and direct sales contact. The wider ArcGIS user and partner ecosystem can also help organizations find GIS expertise. That is materially different from relying on a small vendor with limited implementation capacity. Support quality can nevertheless vary by contract, geography, deployment and the complexity of the workflow. A standard product question is easier to resolve than a problem involving proprietary data, custom models or several connected ArcGIS services. Buyers should confirm response expectations, onboarding scope and named administrative responsibilities before purchase. The score reflects the depth of the Esri ecosystem and available learning resources, while avoiding the assumption that every subscription includes intensive consulting or dedicated analyst support.

    Innovation and Roadmap: 7/10

    BestCRE analysis: 7 out of 10. Business Analyst applies sophisticated spatial analysis to practical decisions about customers, territories and facilities, but its core proposition is established rather than newly created. Trade areas, demographic profiling, location allocation and thematic mapping have long been central GIS methods. Esri’s advantage is the breadth and maturity with which these capabilities are assembled, distributed and connected to a larger geographic platform. That is meaningful product development, even if it does not make every workflow novel. Compared with newer competitors, Business Analyst may feel less centered on automated recommendations or a narrowly designed CRE interface. BestCRE analysis favors useful advancement over novelty for its own sake. The score recognizes a deep analytical toolkit and ongoing platform evolution, tempered by the fact that much of the value comes from well developed GIS methods rather than a fundamentally new decision model.

    Market Reputation: 8/10

    BestCRE analysis: 8 out of 10, below 9 because Business Analyst is not a dominant incumbent in CRE specifically. Esri is an established name in geographic information systems, and Business Analyst benefits from that institutional credibility, technical ecosystem and familiarity among GIS professionals. Public examples identify use by organizations including Mid America Real Estate Group, Chick fil A, Horwath HTL Canada, Moffitt Cancer Center, the Food and Drug Administration and Trust for Public Land. These references demonstrate applicability across commercial, consulting, health and public sector settings, although they should not substitute for references matching a buyer’s exact workflow. Esri is privately held and does not publish a verified Business Analyst customer count. The score reflects strong recognition and documented enterprise use. It stops short of a perfect rating because reputation at the ArcGIS platform level does not prove equal satisfaction with every license, dataset, implementation partner or market specific use case.

    9AI Score Card Esri ArcGIS Business Analyst
    78
    70 / 100
    Solid Platform
    Market Analytics
    Esri ArcGIS Business Analyst
    Business Analyst combines Esri mapping with demographic, spending, lifestyle and business data to evaluate sites, customers, markets and sales territories.
    9 Dimensions, Scored 1 to 10
    1. CRE Relevance
    7/10
    2. Data Quality & Sources
    8/10
    3. Ease of Adoption
    7/10
    4. Output Accuracy
    7/10
    5. Integration & Workflow Fit
    7/10
    6. Pricing Transparency
    5/10
    7. Support & Reliability
    7/10
    8. Innovation & Roadmap
    7/10
    9. Market Reputation
    8/10
    BestCRE.com, 9AI Framework v2 Reviewed October 2026

    Who Should Use Esri ArcGIS Business Analyst

    Business Analyst is best suited to retail real estate, restaurant, health care, hospitality and service network teams that repeatedly compare sites or markets. It is especially compelling when analysts need defensible trade areas, demographic profiles, consumer spending indicators and territory planning in one geographic workflow. Brokers and location consultants can also use its maps and infographics to explain recommendations to clients, provided they disclose the assumptions behind the analysis. Existing ArcGIS users receive the clearest adoption advantage because governance, skills and spatial data may already be in place.

    Enterprise strategy and research teams should consider it when they need to combine internal sales, customer or facility data with external market information. It also suits organizations that want analysts to move beyond static radius reports into travel time, location allocation and network coverage analysis. BestCRE analysis: the ideal buyer has recurring location decisions, an accountable analytical owner and enough volume to justify standard templates and training. A buyer should define the decisions Business Analyst will support before purchase, then test the product with real candidate sites and known store outcomes.

    Who Should Not Use Esri ArcGIS Business Analyst

    Business Analyst is a weaker fit for CRE investors seeking a primary source for lease comparables, sale transactions, ownership, loan exposure, rent rolls or property valuation. Those requirements call for property and capital markets platforms rather than demographic GIS. It is also excessive for a small team that needs only an occasional population report and has no plan to maintain geographic data or analytical standards.

    Teams wanting direct foot traffic observations, automated tenant recommendations or a finished acquisition conclusion may prefer a more specialized product. Business Analyst requires the user to frame the question and interpret the evidence. BestCRE analysis: buyers without GIS capacity should not assume the web interface eliminates methodological work. If no one owns data quality, trade area design and model validation, the organization may produce attractive maps without improving decisions. A limited pilot is preferable when expected usage is uncertain.

    Pricing and ROI Analysis

    Esri does not publish one universal all inclusive price for ArcGIS Business Analyst. Its site directs buyers toward pricing and purchase options, while the complete cost can vary with deployment, user access, ArcGIS licensing, data, service credits, implementation and support requirements. Prospective customers should obtain a written configuration and identify which capabilities require Business Analyst Web App, desktop access or other ArcGIS components. The proposal should also state renewal terms, usage limits, geographic data coverage, training costs and the price of adding users.

    BestCRE analysis: ROI should be calculated from avoided location errors and analyst time, using the buyer’s own verified inputs. For example, a team can multiply annual site studies by the hours currently spent gathering, mapping and formatting market data, then multiply the saved hours by its loaded labor cost. It can add the expected value of better site screening, but only if that estimate is supported by historical approval and performance data. The resulting annual benefit should exceed the complete annual software and administration cost by the buyer’s required return threshold. Esri does not publish a universal customer ROI figure, and BestCRE would not treat a vendor case study as a substitute for this calculation.

    Integration and CRE Tech Stack Fit

    Business Analyst has its strongest technology fit inside an ArcGIS environment. A CRE organization can combine market data with its own sites, customers, sales, territories, parcels or planning layers, then distribute maps and reports through Esri applications. Web, desktop and mobile availability supports analysts, decision makers and field teams with different levels of geographic expertise. Organizations using enterprise GIS can also apply existing identity, data governance and publishing practices.

    Outside that ecosystem, buyers should map every required connection before signing. CRM records, property databases, financial models and warehouse tables may need preparation, geocoding and scheduled data movement. Esri does not claim a packaged connector for every CRE platform. BestCRE analysis: Business Analyst should serve as the spatial analysis layer, while systems of record retain leases, properties, customers and financial assumptions. This division keeps demographic intelligence useful without forcing GIS software to perform jobs for which it was not designed.

    Competitive Landscape

    Placer.ai is the most obvious alternative when a buyer prioritizes observed visitation patterns, venue performance and movement based location intelligence. Business Analyst is stronger when the assignment requires broad demographic variables, custom geographic analysis and integration with enterprise GIS. Buxton also targets customer analytics and site selection, often with a more consultative and brand oriented approach. The choice depends on whether the buyer wants a configurable spatial platform or a more packaged location strategy service.

    Targomo is relevant for travel time, accessibility and location planning, particularly where mobility based catchments are central. LocateAI is positioned around retail real estate decision support and may appeal to teams seeking a narrower interface for site strategy. CoStar remains a different kind of alternative, centered more heavily on commercial property and market information than consumer trade area analysis. Green Street is more appropriate for investors focused on property markets, valuation and public real estate securities.

    BestCRE analysis: Esri wins when geographic flexibility, internal data combination and ArcGIS compatibility matter most. Placer.ai may reach a traffic based answer faster, while CoStar or Green Street better addresses property and investment questions. Buyers should run the same locations through finalists and compare data lineage, boundary logic, workflow time and the clarity of the resulting recommendation. Feature volume alone is not a useful selection test.

    The Bottom Line

    Choose ArcGIS Business Analyst when location is the organizing principle of the decision and the team needs repeatable trade area, demographic and territory analysis. It is particularly defensible for multi market occupiers, consultants and enterprises already committed to ArcGIS. Require a pilot using internal customer or site data, and have business users review the conclusions rather than judging only the maps.

    Do not buy it as a substitute for property comparables, lease intelligence or investment underwriting. BestCRE analysis: Business Analyst deserves a shortlist for serious site selection programs, but its value depends on analytical ownership and disciplined implementation. Obtain a complete price, confirm the required licenses and test whether routine users can reproduce an approved workflow. If the organization cannot support that operating model, a narrower location platform may deliver a faster return.

    About BestCRE

    BestCRE.com is the definitive authority on commercial real estate AI, analysis, and investment intelligence. Every article advances the platform’s mission to help CRE professionals identify, evaluate, and adopt the best tools and strategies in the industry. We benchmark platforms using the 9AI Framework so CRE leaders can compare tools with clear evidence. Explore the category map at 20 CRE sectors for deeper coverage across the CRE stack.

    Frequently Asked Questions

    What is Esri ArcGIS Business Analyst?

    Esri ArcGIS Business Analyst is location based market intelligence software for demographic mapping, site selection, market planning, customer analysis and territory design. It combines Esri maps and spatial analysis with demographic, census, lifestyle, consumer spending and business information. Users can define a trade area around a proposed or existing location, examine the characteristics within it and compare that location with alternatives. They can also add internal information such as customers, sales, facilities and property costs. The product is available through web, desktop and mobile applications and connects with the broader ArcGIS ecosystem. For CRE teams, it is most relevant to occupier and advisory decisions about where to locate, expand, consolidate or adjust coverage. It is not a complete property, lease or transaction database.

    How does ArcGIS Business Analyst compare with Placer.ai?

    ArcGIS Business Analyst and Placer.ai answer related but different location questions. Business Analyst emphasizes GIS, demographics, consumer characteristics, spending indicators, trade areas, territory planning and the combination of internal data with geographic layers. Placer.ai is generally considered when observed visitation patterns, venue traffic and movement based insights are the main requirement. BestCRE analysis: Business Analyst is the stronger choice for configurable spatial analysis and organizations already using ArcGIS. Placer.ai may be easier for teams seeking a focused view of location visitation without developing a broader GIS workflow. Neither product should be selected from a feature checklist alone. A useful trial should compare identical sites, inspect the lineage and timing of each input, and test whether the output improves a real approval decision.

    How much does ArcGIS Business Analyst cost?

    Esri does not publish one universal all inclusive price for every ArcGIS Business Analyst configuration. Buyers are directed to pricing and purchase options, but the complete amount may depend on deployment, number and type of users, ArcGIS products, geographic data, service credits, implementation and support. Request a written proposal that identifies every required license and separates recurring software costs from onboarding, training and optional consulting. Confirm whether adding users, running analyses or accessing additional geographic markets creates further charges. BestCRE analysis: compare the complete annual cost with labor saved across recurring studies and with any measurable improvement in site screening. Do not base the business case on an unverified claim that one avoided bad location will automatically pay for the software.

    Who should use ArcGIS Business Analyst for commercial real estate?

    ArcGIS Business Analyst suits retail real estate directors, location strategists, market researchers, brokers, consultants and GIS analysts who repeatedly evaluate sites, trade areas or network coverage. It is particularly relevant to restaurants, retailers, health care providers, hospitality groups and service businesses whose performance depends on customer access and local demand. Organizations already using ArcGIS are well positioned because they may have compatible skills, data governance and mapping infrastructure. BestCRE analysis: the product is most valuable when a named analyst owns the methodology and internal sales or customer data can be incorporated. It is less suitable as the primary tool for acquisition teams focused on rents, leases, ownership, debt, sale comparables or valuation. Those buyers need a property intelligence or underwriting platform.

    Will ArcGIS Business Analyst remain useful as site selection becomes more automated?

    Yes, provided Esri continues pairing automation with transparent geographic methods and current data. Site selection can automate data assembly, screening and presentation, but buyers still need to understand why a trade area was drawn, which variables influenced a result and how internal performance data was treated. Business Analyst has an advantage because it sits within a larger GIS platform and supports custom data, maps and analytical workflows. BestCRE analysis: its future value will depend less on producing another demographic report and more on helping teams test scenarios, validate models and distribute governed location intelligence. Buyers in October 2026 should assess product direction, data update practices and automation controls during procurement. Esri does not publish a guaranteed roadmap covering every future Business Analyst capability.

    Related Reviews

    Compare Esri ArcGIS Business Analyst with other Acquisitions tools BestCRE has scored: CompStak (76/100), Cherre (74/100), Google Gemini (70/100) and Propmarker (70/100). Browse every review in CRE Acquisitions, the full Best CRE AI Tools directory, or the 20 CRE Sectors hub.

  • CommercialEdge Review: Commercial listings, property intelligence and market research

    CommercialEdge Review: Commercial listings, property intelligence and market research

    BestCRE 9AI Score

    66/100 · Niche

    CommercialEdge ranks #400 of 584 commercial real estate AI tools scored on the 9AI Framework. Nine dimensions, each scored out of 10: CRE relevance, data quality, ease of adoption, output accuracy, integration fit, pricing transparency, support, innovation and market reputation.

    CommercialEdge is a commercial real estate listings, property intelligence and market research platform owned by Yardi Systems. It serves brokers, investors, landlords and research teams that need to identify properties, understand markets, assess opportunities and promote available space. Its practical appeal is workflow consolidation. A user can move from market screening and property investigation toward listing discovery or marketing without beginning each task in a disconnected general purpose application. This makes CommercialEdge relevant to acquisition sourcing, broker prospecting, portfolio research, competitive property monitoring and landlord marketing.

    The product occupies an unusual position between a listings marketplace and an institutional property database. That distinction matters to buyers. A marketplace is judged by listing participation, freshness and inquiry activity, while a research product is judged by coverage, field completeness, update methods and confidence in ownership or transaction records. CommercialEdge asks buyers to value both sides of the proposition. BestCRE analysis finds that the combination is more meaningful than either component alone, particularly for teams whose research and marketing responsibilities overlap.

    Yardi ownership is the clearest strategic differentiator. Yardi is deeply established in property management and real estate software, giving CommercialEdge a credible place within CRE operations. The connection can reduce vendor fragmentation for an organization already committed to the Yardi ecosystem. It should not, however, be treated as proof that every dataset is complete or that every desired integration is included. Buyers still need a field level evaluation covering target markets, property types, refresh timing, export rights and workflow compatibility.

    BestCRE views CommercialEdge as a serious category contender, not an automatic substitute for every incumbent. Its CRE specificity, recognizable parent company and combination of research, listings and marketing support make it suitable for a structured trial. The principal constraints are limited public pricing and the need to validate data quality market by market. A buyer should judge the platform using real properties, known transactions and active listings from the territories where the organization earns revenue.

    What CommercialEdge Does and How It Works

    CommercialEdge organizes commercial property and market information for search, comparison and prospecting. Users can narrow a market by relevant property characteristics, inspect individual records and assemble a working view of potential acquisitions, owners, competitors or leasing opportunities. The platform is intended to replace some of the manual movement among search engines, brokerage pages, public records and internal spreadsheets. Available information can support property identification, ownership research, transaction review and market context, although the precise fields and depth available to a customer can depend on product access and coverage.

    On the marketplace side, CommercialEdge presents commercial real estate listings to people searching for space or investment opportunities. On the marketing side, the broader offering supports the publication and distribution of property availability. This creates a practical connection between the landlord or broker maintaining an offering and the prospect discovering it. The important diligence questions concern how quickly changes propagate, where listings are distributed, how duplicate records are handled and what reporting is available. CommercialEdge does not publicly provide enough standardized evidence to assume identical performance across every market, asset class and listing type.

    For analysts and deal teams, the product can function as an initial research layer rather than a final underwriting system. Search results and property records can help create a target list, frame a submarket and identify records requiring deeper investigation. Users should then reconcile material facts against source documents, local records, broker confirmation and internal systems before making an investment or leasing decision. BestCRE analysis considers this distinction essential: the platform can shorten discovery and reduce repetitive research, but it does not eliminate professional verification. Its value is highest when the organization defines which fields can guide prospecting and which fields require independent confirmation.

    9AI Framework: Dimension by Dimension Analysis

    CRE Relevance: 9/10

    CommercialEdge earns a 9 for CRE relevance because its core workflows are built around commercial properties, listings, owners, transactions, market research and property marketing. Brokers can use it for prospecting and listing exposure, landlords can support availability marketing, and investors can screen properties or markets before deeper underwriting. The terminology and data structure reflect commercial real estate rather than a general business database adapted to the sector. Its marketplace and research functions also connect activities that frequently sit with different teams inside a CRE organization. BestCRE analysis withholds the highest possible assessment because relevance still varies by assignment. Teams conducting detailed portfolio valuation, construction feasibility, lease administration or accounting will need specialized systems beyond CommercialEdge. Within market intelligence, property discovery and listing workflows, however, the product is directly aligned with daily CRE work.

    Data Quality and Sources: 7/10

    CommercialEdge receives a 7 for data quality, held below 8 because no independently audited completeness rate is published. Yardi ownership gives the product credible real estate domain foundations, and the platform offers structured property, ownership, listing, transaction and market information intended for professional use. That breadth can materially improve initial screening compared with unstructured web research. Nevertheless, data quality in commercial real estate is highly local and field specific. Ownership entities can obscure beneficial owners, transactions may require interpretation, and listing details can become stale when participants delay updates. The vendor does not publish a universal, independently audited completeness rate for every field and market. BestCRE analysis therefore recommends a controlled test using known properties, recent deals and deliberately difficult ownership records. Buyers should measure match rates, field accuracy, update lag and duplicate handling in their actual territories before assigning the data to production decisions.

    Ease of Adoption: 6/10

    CommercialEdge scores 6 for ease of adoption, held back because no self-serve sign-up or trial is documented, even though its central tasks follow familiar CRE research patterns: choose a geography, apply property criteria, review records and develop a target set. Listings are also a familiar interaction model for brokers, investors and tenants. Organizations already using Yardi products may encounter less institutional resistance because procurement, data governance and vendor management have an established reference point. Adoption still requires more than granting user accounts. Teams need shared definitions for searches, saved criteria, exports and verification, or different users may produce conflicting market views. The vendor does not publish a standardized implementation duration that applies to every customer. BestCRE analysis expects individual researchers and brokers to learn the main search workflow relatively quickly, while larger deployments will require training, permissions design and documented handoffs into CRM, underwriting and marketing processes.

    Output Accuracy: 7/10

    CommercialEdge earns a 7 for output accuracy, held below 8 because no independently verified error rate is published. Its structured records can provide a consistent starting point for property research, market comparisons and prospect identification. The platform is more suitable for repeatable analysis than relying on isolated brokerage pages or unrestricted internet searches. Accuracy must still be separated from completeness. A displayed field may correctly reflect the latest captured source while omitting a recent change, and an ownership record may identify a legal entity without resolving the ultimate decision maker. Listing terms can also change between updates. CommercialEdge does not publish an independently verified error rate covering all outputs. BestCRE analysis treats the platform as decision support, not conclusive diligence. Material facts such as ownership, sale terms, debt status, availability and asking conditions should be checked against authoritative documents or direct market confirmation before capital, legal commitments or client advice depends on them.

    Integration and Workflow Fit: 6/10

    CommercialEdge scores 6 for integration, held down because no native Yardi connector or API matrix is documented, with credit given principally because it belongs to Yardi and fits naturally into conversations about a Yardi centered real estate technology stack. The common vendor relationship can simplify governance and create a clearer route for connecting property research, listings and operational workflows. CommercialEdge also supports practical movement of information through features such as exports and marketing workflows, subject to the customer’s package and permissions. Buyers should not infer that every Yardi product or outside CRM, warehouse and underwriting tool connects automatically. Public information does not present a complete matrix of included connectors, data direction, synchronization frequency and API rights for every subscription. BestCRE analysis recommends documenting each required handoff before purchase. The test should follow one record from discovery through CRM assignment, underwriting and reporting, while checking identifiers, field mappings, duplicates and update behavior.

    Pricing Transparency: 5/10

    CommercialEdge receives 5 for pricing transparency, the maximum allowed under BestCRE methodology when a vendor does not publish standard pricing. The public website does not provide a complete rate card covering subscriptions, users, data access, exports, implementation and optional services. Prospective customers must engage the vendor for a quote, making comparison harder for smaller firms and buyers conducting an early budget screen. Contract value may reasonably vary with products, access levels, organization size or data requirements, but those variables should be confirmed in writing. BestCRE analysis recommends requesting an itemized proposal that separates license charges, onboarding, training, integrations, usage limits, renewal terms and any marketplace or marketing services. Buyers should also ask which functions shown during a demonstration are included in the quoted package. Without that detail, a favorable headline price can conceal the cost of achieving the demonstrated workflow.

    Support and Reliability: 6/10

    CommercialEdge scores 6 for support, held below 8 because no response times or service levels are published. Its ownership by Yardi provides the backing of an established real estate software organization rather than a small, unproven vendor. That matters for enterprise procurement, account continuity and access to personnel familiar with property industry workflows. CommercialEdge offers sales and customer contact channels, but the vendor does not publish enough standardized information to compare response times, service levels and escalation performance across all customer tiers. BestCRE analysis therefore distinguishes organizational capacity from verified service quality. During diligence, buyers should request named support responsibilities, coverage hours, target response times, data correction procedures and escalation paths for time sensitive listing or research problems. Reference calls should focus on issue resolution after implementation, not the sales process. Organizations with deadline driven brokerage teams should also test how quickly the vendor handles incorrect records and urgent availability changes.

    Innovation and Roadmap: 6/10

    CommercialEdge earns 6 for innovation, because it consolidates established activities and documents no distinct AI capability. Its most meaningful contribution is the combination of a commercial listings marketplace, property intelligence and marketing capabilities within the orbit of a major real estate software provider. That structure can reduce the operational distance between researching a property, presenting availability and managing adjacent CRE workflows. It is useful innovation through consolidation and domain alignment, although the underlying activities are established parts of the market rather than entirely new categories. The vendor promotes data driven research capabilities, but it does not publicly provide enough detail to credit CommercialEdge with a uniquely superior artificial intelligence architecture or independently proven predictive advantage. BestCRE analysis prioritizes measurable workflow improvement over broad technology claims. Buyers should ask for a demonstration using unfamiliar properties and require the vendor to distinguish sourced facts, calculated fields and any machine generated conclusions.

    Market Reputation: 7/10

    CommercialEdge scores 7 for market reputation, capped because no named customers are published, with credit given because it is backed by Yardi Systems, a widely established provider of real estate software. That parentage reduces concerns about vendor durability, CRE domain commitment and the ability to serve professional property organizations. CommercialEdge also competes visibly in listings and property research against some of the sector’s best known platforms. The vendor does not publish a complete, independently verified customer count for CommercialEdge, and Yardi’s overall reputation should not be treated as direct evidence that this specific product fits every buyer. BestCRE analysis gives substantial credit for institutional credibility while preserving the need for product level references. Prospective customers should speak with organizations resembling their own in geography, asset focus, team size and Yardi usage. The most useful references will discuss record accuracy, renewal experience, support responsiveness and actual user adoption.

    9AI Score Card CommercialEdge
    78
    66 / 100
    Emerging Tool
    CRE Market Analytics
    CommercialEdge
    CommercialEdge is most compelling for Yardi users that want listings, property research and marketing workflows from a single CRE focused vendor.
    9 Dimensions, Scored 1 to 10
    1. CRE Relevance
    9/10
    2. Data Quality & Sources
    7/10
    3. Ease of Adoption
    6/10
    4. Output Accuracy
    7/10
    5. Integration & Workflow Fit
    6/10
    6. Pricing Transparency
    5/10
    7. Support & Reliability
    6/10
    8. Innovation & Roadmap
    6/10
    9. Market Reputation
    7/10
    BestCRE.com, 9AI Framework v2 Reviewed October 2026

    Who Should Use CommercialEdge

    CommercialEdge should be considered by brokerage, investment and landlord teams that regularly move between property discovery, market research and listing activity. It is particularly relevant when researchers assemble prospect lists, brokers monitor competing availability, or owners want a more coordinated way to present space and understand nearby properties. A mid sized or enterprise CRE organization can benefit if fragmented research tools and spreadsheets are creating duplicate work. The product also deserves a close look from firms already using Yardi, since the common vendor relationship may simplify procurement and stack planning.

    The strongest buyer has defined markets, repeatable research questions and staff available to test the data before rollout. Acquisitions teams can use CommercialEdge to identify candidates and frame initial market context, while business development teams can investigate properties and ownership entities before direct outreach. Landlords and listing brokers may obtain greater value when they need both research and property marketing capabilities. BestCRE analysis recommends the platform most strongly when multiple departments can share its information, provided the organization establishes record ownership, verification rules and clear handoffs to CRM or underwriting systems.

    Who Should Not Use CommercialEdge

    CommercialEdge is less suitable for a buyer seeking a complete investment decision engine. It does not replace lease abstraction, detailed cash flow modeling, appraisal judgment, environmental review, title work or legal diligence. Organizations that need only a narrow local dataset may also find a specialized regional provider or direct public record workflow more economical. A team should not buy the platform merely because it already uses another Yardi product. Product fit must be demonstrated against the actual markets and fields that drive revenue.

    Small firms with occasional research needs may struggle to justify a sales led subscription when public pricing is unavailable. Likewise, teams requiring a specific real time connector, unrestricted API access or automatic synchronization with a non Yardi stack should obtain written technical confirmation before proceeding. BestCRE analysis also advises against adoption when nobody is responsible for data testing and workflow governance. Access to more property records does not create value if users export inconsistent lists, bypass CRM controls or accept unverified facts as final diligence.

    Pricing and ROI Analysis

    CommercialEdge does not publish a complete standard price list for its research, listings and marketing products. Buyers should expect a vendor conversation and a package specific proposal. The quote should identify licensed modules, named or concurrent users, geographic coverage, export allowances, onboarding, training, support level, integrations and renewal conditions. Ask whether any data, marketplace exposure or marketing capability demonstrated by sales carries a separate charge. Contract comparisons should use the same assumptions for users, markets and service levels. Otherwise, a lower quote may simply include less usable access.

    Analysis: simple ROI math should begin with labor saved and decisions improved, not an assumed revenue claim. If five employees each save three research hours per month, the platform returns fifteen staff hours monthly. Multiply those hours by the organization’s fully loaded hourly cost, then add any measurable savings from retiring overlapping data or listing services. Compare that annual benefit with the complete annualized contract cost, including implementation and integration. Do not assign speculative value to a transaction unless the team can document CommercialEdge’s contribution. A sensible pilot records baseline research time, completed searches, verified contacts and qualified opportunities, then measures the same activities using the platform.

    Integration and CRE Tech Stack Fit

    CommercialEdge fits most naturally in a stack where Yardi already plays a significant role. Its shared ownership can support a more coherent vendor strategy across property operations, research and marketing. That advantage must be translated into specific technical commitments. Buyers should ask which identifiers are shared, which records synchronize, whether updates move in one or both directions, and what access is included in the proposed package. A brand relationship alone does not establish integration depth.

    For a mixed stack, the critical connections are usually CRM, underwriting models, data warehouses, business intelligence tools and listing marketing workflows. BestCRE analysis recommends testing exports and any available interfaces with production like records before signing. Confirm field mappings, permissions, duplicate treatment, refresh schedules and the process for correcting a source record. If a team depends on Salesforce, Microsoft Dynamics, an internal lakehouse or a proprietary underwriting system, it should obtain a written architecture showing how CommercialEdge data enters, changes and exits that environment.

    Competitive Landscape

    CoStar is the most direct institutional alternative for buyers prioritizing a large commercial property research environment and established broker workflows. LoopNet is a familiar alternative for public listing exposure and search, while Crexi combines marketplace activity with data and transaction oriented tools. Brevitas is another commercial marketplace option, particularly for investment property promotion and discovery. Each competitor should be tested in the buyer’s specific markets because national brand recognition does not guarantee equal local record depth or listing participation.

    CommercialEdge differentiates itself through Yardi ownership and the potential to connect research and marketing with a broader real estate software relationship. That can be decisive for an existing Yardi customer, but it is less important to a firm whose CRM, accounting and property systems sit elsewhere. CoStar may be preferred when research depth and an entrenched industry workflow outweigh vendor consolidation. Crexi or Brevitas may appeal when marketplace activity is the central requirement. LoopNet may remain relevant when broad public property search and exposure are the primary goals.

    For data architecture rather than marketplace discovery, Cherre offers a different proposition centered on connecting and organizing real estate data. CompStak is a strong alternative when verified lease and transaction comparables are the priority. Green Street serves buyers seeking research and market intelligence with a more investment oriented emphasis. BestCRE analysis recommends comparing CommercialEdge by job to be done, not by feature count. A controlled evaluation should use identical properties, markets and output requirements across finalists.

    The Bottom Line

    CommercialEdge belongs on the shortlist for CRE organizations that need property research, listings and marketing capabilities, especially when Yardi is already a strategic vendor. Its domain focus and institutional backing make it more credible than a general data tool for broker prospecting, acquisition screening and landlord market monitoring. The purchase case becomes strongest when several teams can use the same property intelligence and reduce overlapping research work.

    The decision should remain conditional on a market specific data test and a fully itemized quote. Require the vendor to demonstrate known properties, recent changes, difficult ownership records and the exact integration path into your stack. BestCRE analysis would buy when coverage meets a documented threshold, users complete real tasks faster and the total contract cost is supported by measurable labor or vendor consolidation savings. If those conditions are not met, retain the incumbent or run a direct comparison with CoStar, Crexi and a specialized data provider.

    About BestCRE

    BestCRE.com is the definitive authority on commercial real estate AI, analysis, and investment intelligence. Every article advances the platform’s mission to help CRE professionals identify, evaluate, and adopt the best tools and strategies in the industry. We benchmark platforms using the 9AI Framework so CRE leaders can compare tools with clear evidence. Explore the category map at 20 CRE sectors for deeper coverage across the CRE stack.

    Frequently Asked Questions

    What is CommercialEdge?

    CommercialEdge is a commercial real estate platform owned by Yardi Systems. It combines a property listings marketplace with property information, market research and marketing capabilities for brokers, investors, landlords and research teams. Typical uses include finding commercial properties, reviewing market and property records, identifying potential owners or opportunities, monitoring competing availability and promoting listings. It is CRE native rather than a general business intelligence product. CommercialEdge can support the early stages of prospecting, acquisition screening and leasing research, but it is not a substitute for detailed underwriting, source document review or legal diligence. Material facts should be confirmed using authoritative records and direct market checks.

    How does CommercialEdge compare with CoStar and Crexi?

    CommercialEdge competes with CoStar and Crexi across commercial property research, listings and prospecting, but each has a different center of gravity. CoStar is known for its institutional research environment and established broker usage. Crexi combines marketplace discovery with data and transaction related workflows. CommercialEdge’s clearest distinction is Yardi ownership, which may make it a better strategic fit for organizations already using Yardi software. BestCRE analysis recommends comparing all three with the same sample of known properties, recent transactions and active listings. Measure record completeness, update timing, search usability, export rights, integration fit and total contract cost. The strongest platform is the one that performs best in the buyer’s actual markets.

    How much does CommercialEdge cost?

    CommercialEdge does not publish a complete standard rate card. Buyers must contact the vendor for pricing based on the products and access required. A useful quote should separate research access, listing or marketing functions, user licenses, geographic coverage, exports, implementation, training, support and any integration charges. Buyers should also confirm renewal terms and whether functionality shown during the demonstration is included. BestCRE analysis recommends annualizing every required cost and comparing it with documented labor savings plus any subscriptions that can genuinely be retired. Because pricing is not public, firms should obtain competing proposals using matching users, markets and service assumptions before judging relative value.

    Who should use CommercialEdge?

    CommercialEdge best suits CRE brokers, investors, landlords and analysts that conduct recurring property searches and can use both research and listing related capabilities. It is particularly attractive to organizations already working within the Yardi ecosystem, provided the required connections are confirmed. Acquisition teams can use it for initial screening, brokers for prospecting and competitive research, and landlords for availability monitoring and property marketing. It is less compelling for occasional users, firms needing only one narrow local dataset, or teams seeking a complete underwriting and diligence platform. BestCRE analysis recommends assigning a product owner before adoption so searches, exports, verification and CRM handoffs remain consistent across users.

    Will CommercialEdge add more AI capabilities?

    CommercialEdge may continue adding automation and AI assisted functions as data platforms and Yardi products evolve, but buyers should not base a current purchase on unannounced features. The vendor does not publish a binding public roadmap covering every future model, workflow or release. A buyer evaluating forward potential should ask which capabilities are generally available today, which are limited tests, what data trains or informs the output, and how generated conclusions can be checked. BestCRE analysis favors practical improvements such as better entity resolution, record matching, search assistance and anomaly identification over an unspecified AI label. Contract value should be justified by current performance, with future functionality treated as optional upside until delivery and commercial terms are confirmed.

    Related Reviews

    Compare CommercialEdge with other Brokerage & Transactions tools BestCRE has scored: CompStak (76/100), Cherre (74/100), DealCloud (72/100) and Google Gemini (70/100). Browse every review in CRE Brokerage & Transactions, the full Best CRE AI Tools directory, or the 20 CRE Sectors hub.

  • Yardi Matrix Review: Property and market intelligence for CRE decisions

    Yardi Matrix Review: Property and market intelligence for CRE decisions

    BestCRE 9AI Score

    71/100 · Contender

    Yardi Matrix ranks #152 of 584 commercial real estate AI tools scored on the 9AI Framework. Nine dimensions, each scored out of 10: CRE relevance, data quality, ease of adoption, output accuracy, integration fit, pricing transparency, support, innovation and market reputation.

    Yardi Matrix is a commercial real estate research and data platform used by investors, lenders, brokers and operators. It changes the early and middle stages of the CRE workflow, when teams identify assets, compare properties, size markets, test assumptions and prepare investment or credit materials. Rather than beginning with scattered broker reports, public records and manual property lists, subscribers can research properties and markets within a purpose built system. Coverage includes multifamily, affordable housing, student housing, single family rental and build to rent, office, industrial, self storage and vacant land.

    Its strongest position is in workflows where property detail and market context must be examined together. An acquisitions analyst can move from market trends to competing properties, while an asset manager can use the same research environment to challenge leasing or operating assumptions. A lender can investigate supply, rents and comparable assets before deciding where additional verification is required. The product is CRE native, so its categories and research structure are more relevant than those of a general business intelligence or generative AI tool.

    Yardi Matrix is part of Yardi Systems, a privately held real estate software company headquartered in Santa Barbara, California. Matrix is sold separately from Yardi’s operating platform, an important distinction for buyers who want market intelligence without replacing their property management system. The connection to a major CRE software provider strengthens institutional credibility, but buyers should not assume that separate Yardi products automatically share every field or workflow. Available integrations, export rights and implementation requirements should be confirmed in writing.

    BestCRE’s analysis is that Yardi Matrix belongs on the shortlist for data intensive CRE teams, especially those evaluating apartments and adjacent residential sectors. Its value depends on whether the relevant markets, property types and fields are consistently populated for the buyer’s actual portfolio. It is not a substitute for asset level diligence, direct market calls or source document review. The purchase case becomes strongest when a team can replace recurring manual research and standardize underwriting inputs. Pricing is not publicly posted, so a controlled evaluation using known properties is essential before signing a subscription.

    What Yardi Matrix Does and How It Works

    Yardi Matrix organizes property level information, market trends, forecasts and research publications into a commercial real estate intelligence product. Users can investigate individual assets, establish competitive sets and examine conditions across markets and property types. The practical benefit is not merely access to records. It is the ability to move between an asset and its surrounding market without rebuilding the research set in spreadsheets each time. For multifamily work, the company states that it covers the commercial apartment industry across 228 markets. Buyers in other sectors should verify geographic depth separately because broad product availability does not establish equal coverage in every segment.

    The platform supports research that commonly feeds acquisitions, lending, brokerage, development and portfolio strategy. An analyst can use property information to screen opportunities, compare competing inventory and prepare inputs for underwriting. Market reports and forecasts add a forward view for investment committee materials, budgeting and risk discussions. These outputs remain evidence rather than final answers. Forecasts depend on methodology and assumptions, while property records can lag real world changes. BestCRE’s analysis is that the most disciplined workflow uses Matrix to form and test a view, then confirms decisive facts through offering materials, ownership contacts, public records and local market checks.

    The product also publishes market reports and premium research intended to support recurring intelligence needs. Its property type navigation indicates that Matrix is broader than a single apartment database, although its public positioning remains particularly associated with commercial apartments. The website includes methodology, terminology, reliability and comparison resources, which are useful starting points for data governance reviews. Public materials do not fully describe every source, update cycle, field level confidence rule, export allowance or integration pathway. Buyers should therefore run a sample based validation: select known assets, compare critical fields, inspect missing values, test historical observations and review how corrections are handled. That process reveals whether the product fits a specific decision workflow more reliably than a polished demonstration can.

    9AI Framework: Dimension by Dimension Analysis

    CRE Relevance: 9/10

    Yardi Matrix scores 9 for CRE relevance because its product structure follows the actual research questions asked by investors, lenders, brokers and operators. Property records, competitive sets, market trends, supply information, reports and forecasts can feed acquisition screening, credit review, valuation support, development analysis and portfolio planning. Coverage spans several specialized property types rather than treating real estate as a generic company or location dataset. Its terminology and navigation are designed around CRE assets and markets, which reduces the translation work required with general analytics products. BestCRE’s analysis is that the remaining gap comes from role specificity. A market intelligence platform can inform underwriting and operating decisions, but it does not itself replace a complete underwriting model, transaction workflow, lease administration system or property management platform. Relevance is therefore exceptionally high, but not universal across every CRE task.

    Data Quality and Sources: 8/10

    Yardi Matrix scores 8 for data quality because the product is built around researched property and market information, supported by published methodology, terminology and reliability resources. Its institutional positioning and extensive market organization indicate a disciplined data operation rather than a lightly assembled directory. The platform’s usefulness also benefits from combining property observations with market reports and forecasts, allowing users to inspect an asset in context. BestCRE’s analysis is that no commercial property database should receive an unquestioned perfect score. Ownership, rents, occupancy, construction status and operating details can change faster than any external research process. Quality can also vary by geography, asset class and field. Buyers should test known properties, review timestamps and ask how conflicting records are resolved. Yardi does not publicly disclose every field level collection method, validation rule or error rate, so empirical testing remains necessary.

    Ease of Adoption: 7/10

    Yardi Matrix scores 7 for ease of adoption. Its research orientation maps to familiar CRE concepts, so an experienced analyst should understand the basic workflow without learning an abstract data model first. Property search, market comparison, reports and forecasts fit naturally into acquisition, lending and brokerage research. A team can also adopt the product without replacing its operating platform because Matrix is offered separately from Yardi’s management software. BestCRE’s analysis is that organizational adoption still requires more than user access. Teams need consistent definitions for competitive sets, approved fields, source dates and downstream model inputs. They must also decide when Matrix data is sufficient and when direct verification is mandatory. Public information does not establish typical implementation time, training requirements or administrative effort. Adoption should be tested with real assignments and several user roles, not judged solely from a sales demonstration.

    Output Accuracy: 8/10

    Yardi Matrix scores 8 for output accuracy, reflecting the fit between its researched CRE data and the decisions it is intended to support. Property level records, market measures, reports and forecasts provide a more grounded starting point than general web search or unstructured AI output. The vendor also makes methodology and reliability information available, which gives buyers a basis for evaluating how outputs are formed. BestCRE’s analysis is that accuracy has two layers. Historical property facts can be checked against known assets, while forecasts should be evaluated as modeled estimates rather than facts. Even a strong database may contain stale values, estimated observations or classifications that do not match an owner’s internal definitions. The score assumes disciplined use with dates, definitions and sources visible. Material investment, lending or valuation decisions still require corroboration from primary documents and local evidence.

    Integration and Workflow Fit: 7/10

    Yardi Matrix scores 7 for integration. Its ownership by Yardi creates a credible place within a large CRE technology ecosystem, and the ability to purchase Matrix separately gives firms flexibility in how they add market intelligence. Research outputs can support common downstream work in underwriting models, presentations, credit memoranda and portfolio reviews. However, buyers should not infer automatic connectivity merely because another system carries the Yardi name. Public product information does not comprehensively specify available application programming interfaces, supported connectors, synchronization behavior, export limits or the commercial terms attached to data access. BestCRE’s analysis is that the product can fit most institutional research stacks, but the method may range from straightforward exports to a more governed data workflow. Technical buyers should validate field mappings, identifiers, update frequency, user permissions and data retention rights before treating integration as a solved problem.

    Pricing Transparency: 4/10

    Yardi Matrix scores 4 for pricing transparency because standard subscription prices are not publicly posted. Prospective buyers must contact the vendor or use the purchase process to determine the cost for their required property types, markets, users and data rights. That approach is common in institutional CRE data, but it makes early comparison and budget planning unnecessarily difficult. Buyers cannot determine from public information whether prices vary by module, geography, seat count, export entitlement or contract length. BestCRE’s analysis is that opaque pricing increases the importance of a detailed written proposal. The proposal should separate subscription access, premium reports, implementation, training, data feeds and any usage restrictions. It should also identify renewal terms and permitted internal distribution. A score above 5 would require accessible public pricing or a sufficiently detailed rate structure that buyers could estimate their likely cost before engaging sales.

    Support and Reliability: 7/10

    Yardi Matrix scores 7 for support. The product provides support access and publishes methodology, terminology, reliability and research resources, giving users several ways to understand both the interface and the underlying information. Its position within Yardi also suggests an established organizational base for serving institutional real estate customers. BestCRE’s analysis is that research data support must address more than login or navigation issues. Buyers need timely answers about disputed property facts, field definitions, historical revisions, coverage gaps and forecast methodology. Public information does not provide universal response commitments, named service tiers, resolution statistics or guaranteed correction times. Prospective customers should therefore test the support process during evaluation by submitting a substantive data question. Contract review should clarify escalation paths, training access, account coverage and treatment of data corrections. The score reflects credible support capacity while reserving judgment on service levels that are not published.

    Innovation and Roadmap: 7/10

    Yardi Matrix scores 7 for innovation. The product brings property information, broad market coverage, research publications and forecasts into one CRE specific environment, and its site identifies AI as a product area. That combination can reduce fragmented research and help analysts move more quickly from screening to a defensible market view. Yet the public information available does not establish enough detail about AI functions, model architecture, automated reasoning, explainability or customer results to justify a higher score on AI innovation alone. BestCRE’s analysis is that Matrix competes primarily on the quality and structure of its real estate intelligence, not on novelty for its own sake. Buyers should ask for live demonstrations of any AI capability, including its source citations, permissions, error handling and treatment of proprietary customer data. Innovation deserves credit when it improves research reliability or speed, but claimed features should be judged through actual workflows.

    Market Reputation: 7/10

    Yardi Matrix scores 7 for market reputation. It operates under Yardi Systems, an established privately held real estate software company based in Santa Barbara, and serves the institutional property research market under a recognizable CRE brand. Its continued publication of market reports and forecasts gives industry users a visible way to assess the firm’s analytical perspective before purchasing. The platform also competes directly with prominent providers such as CoStar, Moody’s REIS, MSCI Real Capital Analytics, CompStak and Radix, which places it in a demanding institutional category. BestCRE’s analysis is that reputation does not eliminate product specific diligence. A buyer’s experience may depend on asset class, local coverage, account support and contracted data rights. The vendor does not publish complete customer counts, retention statistics or independently audited accuracy results. The score recognizes institutional standing while avoiding unsupported assumptions about universal customer satisfaction.

    9AI Score Card Yardi Matrix
    78
    71 / 100
    Solid Platform
    CRE Market Analytics
    Yardi Matrix
    Yardi Matrix combines property records, market research and forecasts across several CRE sectors in a product sold separately from Yardi operating software.
    9 Dimensions, Scored 1 to 10
    1. CRE Relevance
    9/10
    2. Data Quality & Sources
    8/10
    3. Ease of Adoption
    7/10
    4. Output Accuracy
    8/10
    5. Integration & Workflow Fit
    7/10
    6. Pricing Transparency
    4/10
    7. Support & Reliability
    7/10
    8. Innovation & Roadmap
    7/10
    9. Market Reputation
    7/10
    BestCRE.com, 9AI Framework v2 Reviewed October 2026

    Who Should Use Yardi Matrix

    Yardi Matrix is best suited to CRE investment, lending and advisory teams that repeatedly need property records and market context before committing staff time or capital. Multifamily acquisitions groups are a particularly natural fit, as are affordable housing, student housing, single family rental, office, industrial and self storage specialists whose target markets are well covered. A regional or national research team can use the platform to standardize screening, define competitive sets and prepare market sections for investment committee or credit materials. Brokers may also benefit when prospecting, positioning assignments or checking competing inventory.

    The strongest buyer has enough research volume to make consistency and analyst time valuable. It also has a clear validation policy for fields that affect valuation or credit. BestCRE’s analysis is that institutional firms should consider Matrix when they want a dedicated CRE intelligence layer without making a property management system replacement part of the project. Existing Yardi customers may find the common vendor relationship attractive, but should still test actual interoperability. Before purchase, the team should evaluate representative assets across its important markets, include both power users and occasional users, and confirm that permitted exports match its underwriting and reporting process.

    Who Should Not Use Yardi Matrix

    Yardi Matrix is less suitable for small firms that perform only occasional market research and cannot justify an institutional data subscription. A buyer seeking transparent self service pricing may also be frustrated because standard rates are not publicly posted. Teams focused on a narrow local niche should first determine whether direct broker relationships, public records and specialized local sources provide better detail at lower cost. The product is also unnecessary for users who need only general economic commentary rather than property level research.

    It should not be purchased as an automatic source of final underwriting truth. Developers, lenders and investors that expect forecasts or database fields to replace site visits, source documents and local verification are setting the wrong operating standard. Firms requiring a clearly documented application programming interface, unrestricted redistribution or automatic synchronization with a particular warehouse should resolve those requirements before contracting. BestCRE’s analysis is that buyers should walk away if a controlled sample exposes material coverage gaps in core markets, or if the proposed license prevents the exports and internal sharing needed for the expected workflow.

    Pricing and ROI Analysis

    Yardi Matrix does not publish standard subscription pricing. Public information does not establish a universal per user rate, module price, implementation charge or minimum contract value. Cost may depend on the requested property types, markets, users, reports and data access rights, but buyers should obtain the exact structure directly from the vendor rather than assume how packaging works. A useful proposal should identify every included market and asset class, the number and type of users, export permissions, premium content, training, support, renewal mechanics and any fees for feeds or technical access.

    Analysis: ROI can be tested without inventing a market price. Suppose a research team completes 40 assignments per month and Matrix saves 45 minutes on each assignment. That equals 30 staff hours saved monthly. Multiply those hours by the firm’s fully loaded hourly cost, then add any measurable value from avoiding duplicate data purchases or improving opportunity screening. Compare the annual benefit with the complete annual contract cost, including implementation and optional data delivery. This is only a planning model, not a claim about realized savings. The buyer should run the calculation using a timed pilot and its own staffing costs. If savings depend primarily on unverified forecasts or vague productivity claims, the business case is not yet strong enough.

    Integration and CRE Tech Stack Fit

    Yardi Matrix fits most naturally as a research layer beside underwriting, customer relationship management, document and portfolio systems. Analysts can use its property and market intelligence to inform models, presentations, credit memoranda and strategy work. Because Matrix is sold separately from Yardi’s operating platform, firms do not need to replace their property management software merely to evaluate the data product. That separation also means buyers must establish what information can move between systems and by which method.

    Public information does not fully describe every connector, application programming interface, export format or synchronization option available under each subscription. Technical diligence should cover stable property identifiers, field definitions, refresh timing, permission controls, historical revisions and retention rights. Existing Yardi customers should request a workflow demonstration across their exact products rather than assume native data flow. BestCRE’s analysis is that spreadsheet based use may be adequate for smaller research teams, while enterprise buyers will need clearer governance for warehouse ingestion, model mapping and downstream redistribution.

    Competitive Landscape

    CoStar is the most obvious broad market alternative, with a large property information ecosystem and workflows familiar to many brokerage and investment teams. Moody’s REIS is a relevant choice for market analytics and forecasts, while MSCI Real Capital Analytics is particularly important when transaction and capital markets intelligence drives the requirement. CompStak should be examined when lease comparable data is central to the workflow. Radix is a focused alternative for multifamily market intelligence and operational benchmarking. Each comparison should be run at the field and market level, not decided by brand breadth.

    Yardi Matrix differentiates itself through Yardi backed research and a product that can be purchased independently from Yardi’s operating platform. BestCRE’s analysis is that Matrix has a compelling position for multifamily centered teams that also want coverage of adjacent sectors, but it is not automatically superior for every data problem. CoStar may offer a broader daily research environment for some users. REIS may fit teams centered on economic and market forecasting. MSCI Real Capital Analytics may be stronger for transaction analysis, while CompStak may win when verified lease comparables are the priority.

    The right evaluation uses a shared test set across vendors. Buyers should compare known assets, missing fields, update dates, competitive set construction, export rights and support responses. BestCRE has scored CompStak at 88 and CoStar at 81 in this category, but those results do not remove the need to match each product to the intended workflow. Yardi Matrix should advance when its coverage is demonstrably stronger in the buyer’s actual markets and its licensing supports the required use.

    The Bottom Line

    Buy Yardi Matrix if property and market research is a recurring institutional workflow, particularly when multifamily or related residential sectors matter, and a pilot confirms reliable coverage in the markets that drive revenue or investment decisions. Its CRE specific structure, research depth and Yardi backing make it a serious alternative to CoStar, REIS and specialized data vendors. The product should be judged on field accuracy, coverage and workflow fit, not merely on the breadth of its navigation.

    Do not sign until pricing, exports, integration rights and support expectations are documented. BestCRE’s analysis is that a representative data test is the decisive step: use known properties, record discrepancies and time complete assignments with and without the platform. If Matrix materially reduces research effort while preserving a clear verification trail, it merits adoption. If core fields are inconsistent or licensing blocks downstream use, choose the competitor that performs better on those exact requirements.

    About BestCRE

    BestCRE.com is the definitive authority on commercial real estate AI, analysis, and investment intelligence. Every article advances the platform’s mission to help CRE professionals identify, evaluate, and adopt the best tools and strategies in the industry. We benchmark platforms using the 9AI Framework so CRE leaders can compare tools with clear evidence. Explore the category map at 20 CRE sectors for deeper coverage across the CRE stack.

    Frequently Asked Questions

    What is Yardi Matrix?

    Yardi Matrix is a commercial real estate data and market research platform from Yardi Systems. It is designed for investors, lenders, brokers, operators and researchers who need property level information, market trends, reports and forecasts. The product covers multifamily, affordable housing, student housing, single family rental and build to rent, office, industrial, self storage and vacant land. It can support property screening, competitive analysis, underwriting research, credit work and portfolio planning. Matrix is sold separately from Yardi’s property management platform, so a firm can evaluate it without replacing its operating software. BestCRE’s analysis is that it should be treated as a research system and evidence source, not as a substitute for source documents, direct market checks or final investment judgment.

    How does Yardi Matrix compare with CoStar?

    Yardi Matrix and CoStar both serve property research and market intelligence workflows, but buyers should compare them using their actual markets and fields. Matrix combines Yardi backed property research, market reports and forecasts across several CRE sectors, with particular relevance to multifamily research. CoStar offers a broad commercial property information environment that is deeply familiar to many brokerage and investment users. BestCRE’s analysis is that neither brand alone determines the better purchase. Create a test set of known properties and compare coverage, timestamps, ownership information, rents, occupancy, supply data, search workflow and export rights. Include support questions and licensing terms in the test. Matrix is the stronger choice when its data performs better for the buyer’s target assets and its contract supports the required downstream use.

    How much does Yardi Matrix cost?

    Yardi Matrix does not publish standard subscription pricing. The vendor does not provide a public universal price per user, module or market, so buyers need a written quote for their intended scope. The proposal should state which property types and geographies are included, how many users receive access, what reports are covered, which exports are permitted and whether training, implementation or data delivery costs extra. BestCRE’s analysis is that buyers should calculate value from a timed pilot rather than accept general productivity claims. Measure the hours required to complete representative research assignments before and during the trial, multiply verified time savings by the firm’s fully loaded labor cost, and compare the annual benefit with the complete contract cost. Renewal terms and any restrictions on internal sharing should be reviewed before signature.

    Who should use Yardi Matrix?

    Yardi Matrix is best suited to CRE teams that perform property and market research frequently enough to benefit from a standardized data source. Likely users include acquisitions analysts screening markets, lenders reviewing collateral, brokers researching properties, asset managers testing operating assumptions and research teams preparing recurring reports. Multifamily focused organizations are a natural audience, although the platform also covers affordable housing, student housing, single family rental and build to rent, office, industrial, self storage and vacant land. BestCRE’s analysis is that fit depends more on coverage than company size. A regional specialist may receive strong value if its markets are well represented, while a large firm may find gaps in a particular niche. Every buyer should test known assets, critical fields, historical depth, exports and correction support before committing.

    Will Yardi Matrix AI change CRE research?

    Yardi Matrix identifies AI within its product navigation, but public information does not fully establish the functions, models, controls or measured customer outcomes associated with those capabilities. Buyers should therefore evaluate demonstrated behavior rather than assume that an AI label changes the underlying research process. Ask the vendor to show how AI selects sources, cites property records, handles conflicting information, protects customer data and distinguishes forecasts from observed facts. BestCRE’s analysis is that the most valuable future direction would combine natural language access with traceable, permission aware CRE data. That could reduce search time while preserving the evidence trail required for investment and lending decisions. It would not remove the need for analyst review. Any future AI output should be tested against known assets and prevented from silently inserting unsupported assumptions into underwriting.

    Related Reviews

    Compare Yardi Matrix with other Market Analytics & Data tools BestCRE has scored: CompStak (76/100), Cherre (74/100), First Street (71/100) and Google Gemini (70/100). Browse every review in CRE Market Analytics & Data, the full Best CRE AI Tools directory, or the 20 CRE Sectors hub.
  • Intex Review: Cash flow modeling for CMBS and structured securities

    Intex Review: Cash flow modeling for CMBS and structured securities

    BestCRE 9AI Score

    71/100 · Contender

    Intex ranks #213 of 455 commercial real estate AI tools scored on the 9AI Framework. Nine dimensions, each scored out of 10: CRE relevance, data quality, ease of adoption, output accuracy, integration fit, pricing transparency, support, innovation and market reputation.

    Intex is a specialist cash flow modeling and data analytics provider for securitized products. Its users include investors, issuers, underwriters, dealers, arrangers and rating agencies working across CMBS, RMBS, ABS and CLO securities. In a commercial real estate workflow, Intex sits downstream from property underwriting and loan surveillance. It helps an analyst translate assumptions about collateral performance into projected payments, losses and valuation implications for individual CMBS bonds. That makes it highly relevant to structured finance desks, but much less applicable to property owners, leasing teams and investment sales brokers.

    The company was founded in 1985 and remains independent and privately owned. Its principal advantage is a maintained library of cash flow models covering more than 50,000 securitization deals. Those models encode transaction waterfalls, payment rules and other deal mechanics that would otherwise require extensive manual interpretation and implementation. Intex says its coverage of supported securities in the United States, Canada, the United Kingdom and continental Europe is close to complete, with additional coverage across several other international markets.

    Analysis: The product should be viewed as financial market infrastructure rather than a general CRE analytics application. A CMBS analyst can use it to examine how prepayments, defaults, losses, recoveries and other assumptions move through a transaction. A property acquisitions team cannot use it as a substitute for rent comparables, property operating data, market forecasts or asset management software. Its value depends on whether the buyer needs security level cash flow analysis and whether that need occurs frequently enough to justify a specialist system.

    The buying case is strongest when reproducibility, deal coverage and confidence in waterfall mechanics matter more than interface simplicity. Its long operating history and position within securitization workflows support a strong reputation. The tradeoffs are equally clear: pricing is not published, implementation can involve technical work, and the product addresses a narrower part of CRE than platforms such as CoStar, Green Street or Trepp. Buyers should test coverage for their exact securities, required fields, scenarios and delivery method before signing a contract.

    What Intex Does and How It Works

    Intex creates and maintains cash flow models for structured finance transactions. Each model represents the contractual rules that determine how collections from underlying assets are allocated among bond classes and other accounts. For CMBS users, this allows loan and collateral assumptions to be translated into security level results without rebuilding every transaction waterfall internally. Analysts can change assumptions, run scenarios and compare the resulting principal, interest, loss and timing outcomes across bonds. The practical benefit is consistency when examining structures that differ materially in their priorities, triggers and allocation rules.

    The product family includes user interface platforms, Excel plug ins, client resident APIs, web service APIs and integrations used by third party applications. This gives buyers several deployment paths. An individual researcher may work through a supplied interface or spreadsheet workflow, while a quantitative team can call models from internal valuation, risk or portfolio systems. Traders can evaluate securities, researchers can study cohorts, portfolio managers can assess risk, and structuring teams can test proposed transactions. The vendor also provides related data analytics, although the defining capability remains the cash flow model library.

    A typical workflow begins with selecting a deal and security, supplying market and collateral assumptions, and running the applicable transaction model. The output can inform valuation, scenario analysis, relative value work, risk reporting or portfolio decisions. Intex does not eliminate the need to form defensible assumptions about property loans, recoveries or market conditions. It calculates the consequences of those assumptions through the security structure. Analysis: This distinction is critical. Model fidelity can be excellent while an investment conclusion remains weak if the analyst supplies unrealistic collateral inputs, overlooks changing servicer information or treats a scenario as a forecast.

    9AI Framework: Dimension by Dimension Analysis

    CRE Relevance: 7/10

    Intex earns a 7 for CRE relevance because CMBS analysis is directly tied to commercial mortgage performance, yet the product operates at the securitization layer rather than the property operating layer. It is highly pertinent to investors assessing conduit, single asset and other commercial mortgage securities. It can help connect loan performance assumptions to bond cash flows, credit exposure and valuation. It is not designed for prospecting, leasing, property management, development feasibility or conventional acquisitions underwriting. Analysis: The relevance score therefore depends heavily on the buyer’s seat. For a dedicated CMBS desk, Intex can be central infrastructure. For a CRE owner or broker without structured credit exposure, it is peripheral. The score reflects meaningful CRE application with a deliberately narrow professional audience.

    Data Quality and Sources: 9/10

    Intex earns a 9 for data quality because its central product is an actively maintained library of transaction specific models and related structured finance information. Its longevity and broad global coverage indicate a mature process for interpreting documents and updating models across supported asset classes. The value is not simply a collection of loan records. It is the structured representation of payment rules, triggers, accounts and security relationships required to calculate deal cash flows. Analysis: That creates a substantial advantage over teams attempting to build and maintain waterfalls internally. Buyers should still validate whether every required private transaction, historical field and collateral attribute is available under their proposed subscription. The vendor does not publish a field by field completeness audit, correction rate or independent data quality benchmark.

    Ease of Adoption: 6/10

    Intex earns a 6 for ease of adoption. The availability of interfaces and Excel connectivity gives analysts practical entry points, while APIs support more sophisticated deployments. However, structured security modeling has an inherently steep learning curve. Users must understand bond structures, collateral assumptions, scenario construction and interpretation of outputs. A familiar spreadsheet surface does not remove that domain requirement. Enterprise adoption may also require mapping identifiers, building valuation conventions, establishing assumption governance and connecting results to portfolio or risk systems. Analysis: Experienced CMBS analysts should become productive more quickly than general CRE professionals, but this is not a casual analytics subscription. Buyers should request a workflow demonstration using representative deals and confirm training, documentation and implementation responsibilities before purchase.

    Output Accuracy: 9/10

    Intex earns a 9 for output accuracy because transaction level cash flow mechanics are its defining competency. Maintained deal models can reduce errors that arise when analysts manually code complex waterfalls or interpret payment priorities inconsistently. The platform is positioned as an objective calculation layer used for valuation, scenario analysis, trading and risk work. Accuracy nevertheless has two components: the implementation of contractual mechanics and the assumptions supplied by the user. Intex can model an assumption correctly without making that assumption probable. Analysis: Buyers should distinguish model verification from forecast validation, maintain controlled assumption sets and reconcile selected outputs against trustee reports or other authoritative records. The vendor does not publish a universal error rate, so the score reflects product specialization, operating history and workflow role rather than a disclosed accuracy statistic.

    Integration and Workflow Fit: 8/10

    Intex earns an 8 for integration because it offers several routes into institutional workflows, including Excel plug ins, client resident APIs, web service APIs and third party integrations. That range supports both analyst driven use and automated portfolio, valuation or risk processes. Firms can incorporate modeled cash flows into internal applications rather than forcing every user into one interface. The main constraints are likely to be implementation effort, licensing terms, data mapping and the specialist knowledge required to test results. Analysis: This is a stronger integration posture than a closed research portal, particularly for quantitative investors and large financial institutions. It does not mean deployment is effortless. Buyers should confirm authentication, supported environments, identifiers, response formats, throughput limits and rights to store or redistribute derived outputs.

    Pricing Transparency: 3/10

    Intex earns a 3 for pricing transparency because the vendor does not publish subscription prices, package ranges or standard implementation charges. Prospective customers must contact the company for a commercial proposal. That approach may reflect differences in asset coverage, delivery method, number of users and permitted applications, but it prevents buyers from estimating total cost before a sales process. It also makes direct comparison with alternatives more difficult. Analysis: Procurement teams should request a detailed schedule covering licenses, model libraries, API access, environments, onboarding, support, renewals and usage restrictions. They should also ask which costs change with users, portfolios or transaction coverage. The score is below average because pricing opacity is material for smaller teams deciding whether specialist modeling infrastructure can clear their budget threshold.

    Support and Reliability: 7/10

    Intex earns a 7 for support. The company lists operations or representation in the Boston area, London and Shanghai, which is consistent with serving an international institutional client base. A maintained model library also implies ongoing operational work beyond delivering static software. Still, the vendor does not publish detailed service levels, standard response times, onboarding duration or the support provisions included with each license. Analysis: Effective support is particularly important here because users may need to distinguish a model question from a data issue, an assumption problem or a local integration defect. Buyers should assess access to product specialists, escalation procedures, release communication and coverage across their trading hours. The score recognizes an established service footprint while withholding higher marks because publicly available support commitments are limited.

    Innovation and Roadmap: 6/10

    Intex earns a 6 for innovation. Its principal strength is disciplined maintenance of complex transaction models across markets, not a highly visible push into generative AI or novel CRE interfaces. The company offers modern delivery choices such as web services and supports third party products, but the underlying value proposition is established and specialized. Analysis: For this category, conservative engineering can be an advantage. A calculation engine used in valuation and risk work should prioritize consistency, auditability and coverage over fashionable features. Even so, buyers looking for natural language research, automated property intelligence or modern visual exploration may find other platforms more ambitious. The vendor does not publish enough technical detail about AI capabilities or development velocity to justify a higher innovation score.

    Market Reputation: 9/10

    Intex earns a 9 for market reputation. It has operated for decades and describes its models as serving investors, issuers, underwriters, arrangers, dealers and rating agencies in global securitization markets. Its role in structured finance workflows and its extensive model library give it institutional credibility that younger analytics vendors cannot easily reproduce. Analysis: Reputation is especially valuable when different counterparties need a common modeling reference, although reputation should not substitute for buyer testing. The vendor does not publish a customer count, retention rate or complete client roster. Prospective users should therefore request relevant references and confirm adoption among their actual counterparties. The score reflects longevity, specialization and apparent market standing, while stopping short of a perfect result because independently comparable customer metrics are not public.

    9AI Score Card Intex
    71
    71 / 100
    Solid Platform
    Structured Finance Analytics
    Intex
    Intex provides maintained deal models that let CMBS investors, issuers and analysts test payment waterfalls, collateral assumptions and security performance.
    9 Dimensions, Scored 1 to 10
    1. CRE Relevance
    7/10
    2. Data Quality & Sources
    9/10
    3. Ease of Adoption
    6/10
    4. Output Accuracy
    9/10
    5. Integration & Workflow Fit
    8/10
    6. Pricing Transparency
    3/10
    7. Support & Reliability
    7/10
    8. Innovation & Roadmap
    6/10
    9. Market Reputation
    9/10
    BestCRE.com, 9AI Framework v2 Reviewed October 2026

    Who Should Use Intex

    Intex best suits dedicated CMBS investors, structured products research teams, dealers, issuers, arrangers and rating analysts that repeatedly need security level cash flows. It is particularly compelling when the team covers many transactions, compares bonds across vintages or must run changing default, loss, recovery and prepayment assumptions through complicated payment structures. Quantitative and risk teams are also credible buyers when they need a maintained calculation engine inside internal valuation, portfolio or stress testing systems.

    A suitable buyer will already understand structured finance and have a clear process for creating collateral assumptions. The organization should value standardized waterfall calculations, reproducible scenarios and broad deal coverage more than a general property research experience. Analysis: The strongest purchase case is not merely that Intex saves analyst time. It is that internal model maintenance would be costly, inconsistent or difficult to govern across a portfolio. Teams should identify representative transactions, required outputs and reconciliation tests before evaluating the product, then judge it against those specific workflows.

    Who Should Not Use Intex

    Intex is not the right primary platform for property owners, leasing brokers, developers or acquisitions teams seeking rent comparables, ownership records, tenant intelligence, foot traffic, market forecasts or operating benchmarks. Those buyers would receive more direct value from CRE property and market platforms. Even debt professionals focused solely on originating whole loans may find the securitization emphasis too removed from their daily workflow.

    Small teams with occasional CMBS questions should also be cautious. The domain knowledge, procurement effort and undisclosed price may be difficult to justify when analysis is infrequent. Analysis: Buyers who mainly need surveillance data or credit commentary, rather than independent waterfall calculations, should compare Trepp, CRED iQ and Morningstar Credit Analytics before committing. Intex becomes more persuasive when accurate cash flow modeling itself is a recurring operational requirement.

    Pricing and ROI Analysis

    Intex does not publish standard prices, package tiers or implementation fees. Buyers must request a quote. The final commercial structure may depend on asset classes, model coverage, user count, interface choice, API access and usage rights, but the vendor does not publicly specify those variables. A serious proposal request should separate software access, data or model libraries, integration services, training, support and renewal terms. Buyers should also clarify whether derived cash flows can be stored, shared internally or passed into other systems.

    Analysis: A simple ROI test is to estimate annual hours spent building, checking and maintaining waterfalls, then multiply those hours by the fully loaded cost of the employees involved. Add the expected cost of avoidable modeling errors and delayed decisions, but keep that estimate conservative. Compare the total with the complete annual contract and implementation cost. If a five person team saves three hours per person each week, the annual time saving equals 780 hours before considering error reduction. That calculation is illustrative, not a claim about typical Intex customers or results.

    Integration and CRE Tech Stack Fit

    Intex can fit into a CRE credit stack through its interfaces, Excel plug ins and APIs. A research analyst can use modeled outputs alongside loan surveillance and market data, while an engineering team can feed cash flows into valuation, portfolio management or risk systems. Third party integrations may also let firms access Intex calculations through products they already license. Buyers should identify whether direct access or an existing integrated platform provides the cleaner commercial and technical route.

    The product does not replace upstream property, lease or loan data systems. Those sources inform assumptions, while Intex applies assumptions through securitization mechanics. Analysis: The most effective architecture keeps those roles distinct and records the inputs used for every run. Integration testing should cover security identifiers, scenario conventions, model versions, output fields, error handling and reconciliation. Firms should also confirm data retention rights and whether API capacity supports scheduled portfolio processing.

    Competitive Landscape

    Trepp is the clearest CRE focused alternative for many buyers. It combines CMBS and commercial mortgage information with surveillance, research and analytics that can be easier to connect to individual loans and properties. A team whose main problem is monitoring collateral or researching credit events may prefer Trepp. Intex has the sharper identity when detailed transaction cash flow mechanics and security scenario calculations are the deciding requirements. Some institutions may use both because the products address overlapping but distinct layers of analysis.

    CRED iQ is another alternative for users prioritizing CRE debt intelligence, surveillance and distress analysis. It may be more approachable for professionals investigating loans, properties and servicer developments rather than constructing bond cash flows. Morningstar Credit Analytics is relevant for credit research, structured finance analysis and institutional risk workflows. Buyers should compare exact asset coverage, model access, surveillance fields, scenario controls and export rights, not broad category labels.

    Analysis: CoStar and Green Street are credible alternatives only when the actual need is property or market intelligence. CoStar is stronger for broad property, transaction and market research, while Green Street is oriented toward CRE research, valuation context and market insight. Neither should be treated as a direct replacement for a specialist securitization cash flow engine. The purchasing decision should begin with the analytical object: property, loan, deal or bond. Intex is most defensible when the answer is deal or bond.

    The Bottom Line

    Buy Intex when CMBS or other structured security cash flow analysis is a recurring, consequential part of the investment process. Its maintained deal models, institutional history and multiple delivery options make it a strong reference engine for specialists. Require a trial or structured evaluation using difficult securities from the actual portfolio, and reconcile the outputs before approving a contract.

    Do not buy it merely because the organization works in commercial real estate or occasionally reviews CMBS. Analysis: The narrow focus, technical learning curve and unpublished pricing demand a concrete use case. If the team primarily needs property data, market research or loan surveillance, start elsewhere. If it needs repeatable waterfall calculations at scale, Intex deserves a finalist position alongside Trepp and other structured finance platforms.

    About BestCRE

    BestCRE.com is the definitive authority on commercial real estate AI, analysis, and investment intelligence. Every article advances the platform’s mission to help CRE professionals identify, evaluate, and adopt the best tools and strategies in the industry. We benchmark platforms using the 9AI Framework so CRE leaders can compare tools with clear evidence. Explore the category map at 20 CRE sectors for deeper coverage across the CRE stack.

    Frequently Asked Questions

    What is Intex used for in commercial real estate?

    Intex is a cash flow modeling and analytics platform for securitized products, including CMBS. Commercial real estate credit professionals use it to model how assumptions about mortgage collateral affect payments to individual bond classes. The models represent transaction rules such as payment priorities, triggers, accounts and loss allocation. Users can test defaults, losses, recoveries, prepayments and other assumptions, then examine resulting principal and interest cash flows. It is primarily relevant to CMBS investors, issuers, dealers, researchers, risk teams and rating analysts. It is not a general property intelligence product and does not replace leasing data, rent comparables, ownership research, property management software or a conventional acquisition model.

    How does Intex compare with Trepp?

    Intex is most clearly differentiated by its maintained transaction cash flow models across CMBS and other securitized asset classes. Trepp is more closely associated with commercial mortgage data, loan and deal surveillance, research and CRE credit analytics. Analysis: A bond analyst focused on waterfall mechanics and scenario driven security cash flows may favor Intex, while a professional focused on collateral monitoring, loan research and servicing developments may favor Trepp. The products can be complementary rather than mutually exclusive. Buyers should run the same representative deals through each proposed workflow and compare coverage, assumptions, model controls, exports, integration options and reconciliation results. Contract rights and total pricing should also be compared because public list prices are unavailable.

    How much does Intex cost?

    Intex does not publish standard subscription prices, package tiers or implementation charges. Prospective customers need to contact the company for a quote. The proposal should identify which asset classes and model libraries are included, how many users can access the product, whether API or Excel connectivity costs extra, and what support, training and implementation services are covered. Buyers should also ask about renewal terms, usage limits and rights governing stored or shared outputs. Analysis: Cost should be evaluated against the internal effort required to build, validate and maintain transaction models, plus the operational value of consistent calculations. Without a written scope and complete fee schedule, buyers cannot make a reliable comparison with Trepp, CRED iQ or Morningstar Credit Analytics.

    Who should buy Intex?

    Intex is best suited to institutional teams that analyze CMBS, RMBS, ABS or CLO securities frequently enough to require repeatable transaction level cash flows. Likely buyers include structured credit investors, trading desks, issuers, arrangers, underwriters, rating analysts, portfolio managers and risk teams. It is especially relevant when staff would otherwise need to code and maintain many complex waterfalls internally. Analysis: The ideal customer already has expertise in structured finance and a disciplined process for creating collateral assumptions. Property owners, leasing brokers and acquisitions professionals without securitized credit responsibilities are unlikely to receive equivalent value. Smaller teams should confirm that the volume and importance of their bond analysis justify the learning, integration and subscription burden before beginning procurement.

    Will AI change how Intex is used?

    AI could make structured finance research easier by helping analysts find documents, explain deal terms, organize assumptions and investigate unusual outputs. It should not remove the need for controlled transaction models, documented inputs and expert review. Intex does not publicly describe enough about its AI roadmap to assess specific future capabilities. Analysis: Its defensible role is the calculation layer that represents contractual cash flow mechanics. AI may improve the interface around that layer, but buyers should be skeptical of any system that produces bond conclusions without showing assumptions, model versions and traceable results. During procurement, ask how the vendor plans to support natural language workflows, automated quality checks and model governance while preserving reproducibility and auditability.

    Related Reviews

    Compare Intex with other Financing & Lending tools BestCRE has scored: CompStak (76/100), Cherre (74/100), Google Gemini (70/100) and Oxane Partners (69/100). Browse every review in CRE Financing & Lending, the full Best CRE AI Tools directory, or the 20 CRE Sectors hub.
  • Zonda Review: Housing data and software for new home development

    Zonda Review: Housing data and software for new home development

    BestCRE 9AI Score

    70/100 · Contender

    Zonda ranks #238 of 450 commercial real estate AI tools scored on the 9AI Framework. Nine dimensions, each scored out of 10: CRE relevance, data quality, ease of adoption, output accuracy, integration fit, pricing transparency, support, innovation and market reputation.

    Zonda is a housing data, research and software company used primarily by homebuilders, land developers, building product manufacturers, lenders, investors and multifamily developers. Its core value sits early in the real estate workflow, when a principal or analyst is deciding where to buy land, what to build, how quickly a market may absorb supply and how a proposed community compares with nearby projects. That makes Zonda highly relevant to residential development and housing investment, although less directly applicable to office, retail, industrial and other conventional commercial property sectors.

    The platform brings several functions under one company: enterprise housing data, proprietary research, advisory services, digital sales tools and new home marketplaces. NewHomeSource serves the United States, while Livabl covers Canada. Zonda also offers interactive site maps, floor plans, renderings and virtual tours intended to support builders after a project moves from market analysis into consumer marketing. Buyers should therefore evaluate Zonda as a product family rather than assume every capability resides in one uniform interface or subscription.

    Zonda’s strongest proposition is specialization. General property databases can describe transactions, parcels and broad market conditions, but residential development requires additional detail about communities, lots, builders, product positioning, construction activity and new home competition. Zonda is organized around those questions. Analysis: this specialization can reduce the manual work required to assemble a market study, particularly for teams repeatedly screening land or benchmarking new communities across multiple metropolitan areas.

    The principal cautions are scope, commercial opacity and implementation fit. Public pricing is not available, so buyers must engage sales before they can compare cost with expected usage. The company also does not publicly provide enough detail to establish that every dataset, workflow and integration is included in a standard package. CoStar has completed its acquisition of Zonda, adding strategic weight and potential distribution benefits. Analysis: the transaction also makes future packaging, product overlap and integration direction important diligence topics for any buyer signing a multiyear agreement.

    What Zonda Does and How It Works

    Zonda’s data products help users examine housing markets at the level needed for development planning. The relevant workflow begins with market selection, proceeds through submarket and community comparison, and ends with assumptions about product, pricing, pace and land value. Enterprise data, proprietary research and advisory work can support these decisions with information focused on new home construction and builder activity. A land team can use that context to test whether projected demand and competitive supply support an acquisition thesis. An investment committee can then use the resulting evidence alongside internal underwriting rather than relying solely on brokerage narratives or broad economic indicators.

    The product family extends beyond analytical research. Zonda offers digital software for presenting communities and homes through interactive site maps, floor plans, renderings and virtual tours. These tools address the customer facing portion of the builder workflow, where buyers explore available homes, lots and designs. Zonda’s listing businesses, NewHomeSource and Livabl, distribute new construction inventory to prospective home shoppers in the United States and Canada. House plan and sponsorship offerings broaden the platform further. Analysis: this range is useful for large builders seeking fewer vendors, but a buyer should distinguish data subscriptions from marketing products and confirm which systems share data, permissions and reporting.

    Zonda also provides consulting for assignments such as market feasibility and growth planning. That human advisory layer matters because land and community decisions often require judgment that cannot be reduced to a dashboard. It may also help organizations without a large internal research group turn market information into an actionable recommendation. The tradeoff is that service led work can be harder to standardize, automate or compare with a pure software subscription. Zonda Land AI was described as forthcoming, with a waitlist available, rather than as a generally available product. Buyers should assess current production capabilities separately from announced AI functionality and request demonstrations using their own target markets, property types and decision criteria.

    9AI Framework: Dimension by Dimension Analysis

    CRE Relevance: 8/10

    Zonda earns an 8 for CRE relevance because its data and workflows directly support land acquisition, residential development, multifamily planning, housing investment and construction related lending. Its strongest use cases occur before and during development, including market selection, feasibility analysis, competitive positioning and community planning. Those are consequential commercial real estate decisions, even though the end product is often for sale housing rather than an income producing asset. The limitation is sector breadth. An office investor, industrial broker or retail asset manager will find less direct utility than a homebuilder or residential land team. Analysis: Zonda should be classified as CRE adjacent rather than a universal CRE system because its housing specialization is both its advantage and its boundary. Buyers with mixed portfolios should verify whether residential development activity represents enough of their workload to justify a dedicated platform.

    Data Quality and Sources: 9/10

    Zonda earns a 9 for data quality because the company is built around specialized housing intelligence rather than treating new construction as a minor subset of a general property database. Its offering combines enterprise data, proprietary research and consulting expertise, giving users several ways to interpret market conditions. Coverage of builders, communities and the broader homebuilding ecosystem is more relevant to development decisions than transaction records alone. However, buyers should not treat breadth as proof that every field is complete or current in every geography. The vendor does not publish comprehensive, market by market documentation covering update frequency, field level completeness, correction procedures and historical depth for all products. Analysis: the underlying specialization supports a high score, while responsible underwriting still requires sample testing. Prospective customers should select familiar markets, compare records with internal information and examine how Zonda handles planned, active, sold out and delayed communities.

    Ease of Adoption: 7/10

    Zonda earns a 7 for ease of adoption. The company organizes its offering around recognizable housing industry roles, including builders, developers, lenders and investors, which should make use cases easier to frame during implementation. Research, consulting and digital products can also help less technical teams obtain useful outputs without constructing their own data environment. The challenge is portfolio complexity. Data services, marketplaces, listings, advisory work and buyer facing software solve different problems, and public information does not establish a single onboarding path across all of them. Analysis: adoption should be manageable for an experienced land, research or strategy team, but enterprise value will depend on agreeing which decisions the platform supports and who owns each workflow. Buyers should request a role based implementation plan, training schedule, data dictionary and sample deliverables. They should also confirm whether access is browser based, export oriented or dependent on separate modules.

    Output Accuracy: 7/10

    Zonda earns a 7 for output accuracy. Its housing focus and combination of observed market information, research and expert advisory work provide a credible foundation for analysis. Even so, development outputs frequently depend on classifications, estimates, forecasts and assumptions rather than fully verified facts. A community opening, incentive change, construction delay or pricing revision can alter the conclusion of a market study quickly. The vendor does not publish a universal accuracy rate, error benchmark or independent audit covering all datasets and products. Analysis: Zonda outputs are suitable as decision support, not as an unquestioned source of truth. Users should preserve source dates, distinguish observed data from modeled conclusions and reconcile important fields against title information, municipal records, builder disclosures and local market contacts. For investment committee work, analysts should document where Zonda evidence materially affects absorption, price, cost or timing assumptions and run sensitivity cases around those inputs.

    Integration and Workflow Fit: 6/10

    Zonda earns a 6 for integration because its product family can touch research, acquisition, planning, marketing and sales workflows, but public integration detail is limited. Large customers may need data to move into underwriting models, business intelligence systems, customer relationship platforms, geographic information systems and internal data warehouses. The public product description does not establish a standard catalog of application programming interfaces, prebuilt connectors, supported data formats or synchronization intervals across all offerings. Analysis: buyers should assume integration scope is contract specific until demonstrated. A browser portal and manual exports may be adequate for occasional market research, while a national builder will need repeatable feeds, stable identifiers and governance controls. The CoStar acquisition creates a plausible path toward closer product connectivity, but future interoperability should not be treated as currently delivered. Contract diligence should cover export rights, field definitions, usage restrictions, refresh timing, authentication and implementation fees.

    Pricing Transparency: 3/10

    Zonda earns a 3 for pricing transparency. The company does not publish standard subscription prices, module prices, user tiers or advisory rates. Prospective customers are directed to contact sales, which prevents a buyer from estimating total cost before discovery and makes direct comparison with alternatives more difficult. The breadth of the portfolio may justify configured pricing because a local builder, national developer and data intensive investor require different products and coverage. That does not eliminate the need for commercial clarity during procurement. Analysis: buyers should request an itemized proposal separating data access, geographic coverage, users, exports, software modules, implementation, training, consulting and renewal terms. They should also ask how pricing changes when adding markets or business units and whether marketplace products are contracted separately. The low score reflects missing public information, not a conclusion that the product is expensive or provides poor value.

    Support and Reliability: 7/10

    Zonda earns a 7 for support. Its research, consulting, events and industry specialist positioning indicate that customers can access more than a self service software interface. That is valuable in housing analysis, where users may need help interpreting local competitive conditions or translating market evidence into a development recommendation. The company provides sales and contact channels, but it does not publicly disclose standardized support tiers, guaranteed response times, service level commitments or customer satisfaction measures across the product portfolio. Analysis: the advisory capability raises the likely support ceiling, while the absence of comparable service metrics limits the score. Buyers should identify whether their contract includes a named account contact, analyst access, technical support, training, data issue escalation and periodic business reviews. They should also clarify whether interpretation questions are covered by the subscription or billed as consulting, especially when internal teams expect frequent market specific guidance.

    Innovation and Roadmap: 7/10

    Zonda earns a 7 for innovation. Its combination of specialized housing data, research, digital community presentation tools and consumer marketplaces addresses more of the homebuilding process than a conventional market database. Interactive site maps, virtual tours and listing distribution connect analytical and commercial workflows, although buyers should confirm how tightly the individual products operate together. Zonda Land AI signals further investment in artificial intelligence for land related work, but it was presented as coming soon rather than generally available. Analysis: announced functionality deserves monitoring, not credit equal to a proven production system. The most persuasive innovation is presently the breadth of housing specific products and information, not an established AI advantage. Prospective customers should ask for live demonstrations, supported use cases, model inputs, human review controls and release status. They should also determine whether new AI features will be included in existing contracts or sold as additional modules.

    Market Reputation: 9/10

    Zonda earns a 9 for market reputation. The company is well established in the homebuilding ecosystem and states that the leading national builders use its services. Its portfolio includes recognized housing industry brands and serves builders, land developers, lenders, investors, manufacturers and multifamily developers. CoStar’s completed acquisition provides additional evidence that Zonda occupies a strategically important position in housing information and software. This score does not rely on an undisclosed customer count, and the vendor does not publish a complete current client roster or retention rate. Analysis: reputation is strongest among organizations connected to new home construction, where domain focus matters more than general name recognition across every CRE sector. Buyers should still obtain references matching their geography, company scale and chosen modules. A respected brand can reduce vendor risk, but it does not establish data fitness for a particular market or guarantee favorable post acquisition product decisions.

    9AI Score Card Zonda
    70
    70 / 100
    Solid Platform
    Housing Market Analytics
    Zonda
    Zonda combines new home market data, builder software, research, consulting and consumer marketplaces, making it unusually comprehensive for residential development decisions.
    9 Dimensions, Scored 1 to 10
    1. CRE Relevance
    8/10
    2. Data Quality & Sources
    9/10
    3. Ease of Adoption
    7/10
    4. Output Accuracy
    7/10
    5. Integration & Workflow Fit
    6/10
    6. Pricing Transparency
    3/10
    7. Support & Reliability
    7/10
    8. Innovation & Roadmap
    7/10
    9. Market Reputation
    9/10
    BestCRE.com, 9AI Framework v2 Reviewed October 2026

    Who Should Use Zonda

    Zonda is best suited to homebuilders, residential land developers and housing investors that repeatedly make market selection, acquisition and community positioning decisions. A national or regional builder can use specialized market intelligence to compare expansion opportunities, monitor competing communities and challenge assumptions about product and sales pace. Land teams with multiple sites under review should receive more value than organizations making an occasional acquisition because repeated decisions create more opportunities to reuse the data and institutionalize a screening process. Banks and mortgage lenders focused on housing may also benefit when evaluating builder exposure or local supply conditions.

    Multifamily developers and mixed residential investors are plausible buyers when new construction conditions materially influence their underwriting. Building product manufacturers may use housing activity and builder intelligence for territory planning and demand assessment. Analysis: the strongest buyer has a defined research workflow, an internal owner for the platform and enough transaction or development volume to test decisions against outcomes. Zonda also suits organizations that want both data and access to housing specialists. Before purchasing, these buyers should run a pilot in known markets, define the decisions Zonda will inform and confirm that the contracted geography, fields, exports and service level match those decisions.

    Who Should Not Use Zonda

    Zonda is a weaker fit for firms focused primarily on office, retail, hospitality, self storage or industrial assets. Those buyers generally need tenant, lease, sale, ownership and property operating data that sit outside Zonda’s central homebuilding mandate. A broadly diversified CRE team seeking one database across every property type may find CoStar or another general platform easier to standardize, even if Zonda remains stronger for a dedicated housing group. Small operators with infrequent land decisions may also struggle to justify a specialist subscription when public records, brokerage research and project specific consulting cover the requirement.

    It is also unsuitable for buyers demanding self service purchasing with public prices, since Zonda requires a sales conversation. Teams seeking a proven production AI system for automated land decisions should wait for evidence about Zonda Land AI’s availability, controls and performance. Analysis: organizations without a named platform owner, repeatable use case or process for validating third party data are unlikely to capture full value. No database replaces local diligence, entitlement review, engineering work or direct verification of a development site.

    Pricing and ROI Analysis

    Zonda does not publish standard prices for its enterprise data, research, advisory, digital software or listing products. It also does not publish a universal free trial, per user rate, geographic add on price or enterprise package. Buyers must contact the company for a proposal. Because the portfolio covers distinct functions, procurement should demand separate pricing for each module and service. The proposal should specify users, territories, data access, export rights, implementation, training, consulting hours, marketplace services, renewal increases and any minimum term. Without that breakdown, a bundled offer can obscure which products are producing value.

    Analysis: simple ROI math should begin with avoided research labor and improved decision quality. If a team saves 20 analyst hours per month and values that time internally at $100 per hour, the annual labor benefit is $24,000. That calculation is illustrative, not a Zonda claim, and excludes the potentially larger effect of rejecting a weak site or improving project positioning. Compare the estimated annual benefit with the complete contracted cost, including implementation and optional advisory work. A buyer should require a hurdle comfortably above break even because some value will depend on adoption and data coverage. The strongest business case ties Zonda to a recurring acquisition pipeline and records which decisions, hours and underwriting changes are attributable to the platform.

    Integration and CRE Tech Stack Fit

    Zonda can fit upstream of common CRE and homebuilder systems. Analysts may use its market intelligence before moving assumptions into Excel underwriting models, geographic information systems, business intelligence dashboards, investment committee materials or land pipeline tools. Its digital products may sit closer to customer relationship management, community websites and sales operations. Public information does not establish that all these connections are available through standard connectors. Buyers should map each required data movement and ask Zonda to demonstrate it with the exact contracted product.

    For enterprise deployment, the critical questions concern exports, application programming interfaces, identifiers, refresh schedules, permissions and data usage rights. A national builder should test whether communities, builders, parcels and markets can be matched consistently with internal records. Analysis: Zonda appears strongest as a specialized intelligence layer, but its value inside a broader technology stack depends on contract specific access and implementation. The CoStar ownership relationship may eventually affect interoperability and packaging. Buyers should base current architecture decisions only on functioning integrations demonstrated before signature.

    Competitive Landscape

    CoStar is the clearest alternative for organizations prioritizing broad commercial property coverage, ownership, sales, leasing and cross sector research. It already scored 81 in BestCRE’s category assessment. Zonda is more focused on new home construction, builders and residential development workflows. Following CoStar’s acquisition, buyers should ask whether the products will remain separately packaged and where datasets or workflows may converge. The practical choice is not simply brand versus brand. It is whether the core decision concerns commercial assets generally or housing development specifically.

    ATTOM offers property, deed, mortgage, foreclosure and parcel data that can suit teams building their own analytical applications or conducting property level research. HouseCanary and PriceHubble are stronger comparisons when automated residential valuations, property analytics or model driven housing intelligence are central requirements. Zonda is differentiated by its broader homebuilding orientation, including market research, advisory services, builder software and new home marketplaces. Analysis: Zonda is likely the better fit for a builder evaluating communities and land, while data engineering teams may prefer vendors whose delivery model centers on property data feeds or valuation services.

    Within the wider category, Green Street scored 80 for institutional commercial real estate research, while Placer.ai scored 81 for location and visitation intelligence. Neither is a direct replacement for Zonda’s new home specialization. A serious evaluation should use a real acquisition question and compare field coverage, update timing, workflow effort and resulting recommendation. Feature matrices alone will overstate similarity among these products.

    The Bottom Line

    Buy Zonda when housing development is a core business, the team evaluates land or communities repeatedly and specialized new construction intelligence can change underwriting or market strategy. Its domain depth, research capability and coverage of the builder workflow justify a shortlist position for residential principals, analysts and lenders. Require a pilot using familiar markets, validate decisive fields and negotiate explicit rights for exports, users and geography.

    Do not buy it as a generic CRE database or solely because forthcoming AI sounds promising. Pricing opacity, limited public integration detail and a residential focus require disciplined diligence. Analysis: Zonda’s acquisition by CoStar strengthens its strategic position but introduces a reason to examine future packaging and roadmap commitments. The purchase decision should rest on current contracted functionality and measurable workflow value. For the right housing organization, Zonda can be a primary intelligence source. For a diversified CRE firm, it is more likely a specialist complement.

    About BestCRE

    BestCRE.com is the definitive authority on commercial real estate AI, analysis, and investment intelligence. Every article advances the platform’s mission to help CRE professionals identify, evaluate, and adopt the best tools and strategies in the industry. We benchmark platforms using the 9AI Framework so CRE leaders can compare tools with clear evidence. Explore the category map at 20 CRE sectors for deeper coverage across the CRE stack.

    Frequently Asked Questions

    What is Zonda?

    Zonda is a housing data, research, consulting and software company serving homebuilders, land developers, investors, lenders, multifamily developers and building product manufacturers. Its products support market selection, land and community analysis, housing research, digital home merchandising and new construction listings. NewHomeSource is its United States marketplace, while Livabl serves Canada. Zonda is best understood as a portfolio of housing focused products rather than a single generic CRE database. CoStar completed its acquisition of the company in August 2026. Analysis: Zonda is CRE adjacent because it informs commercially significant land and development decisions, but its center of gravity is homebuilding rather than office, retail, industrial or other traditional commercial asset classes.

    How does Zonda compare with CoStar and ATTOM?

    Zonda is more specialized in new home construction, builder activity, residential land decisions and community marketing. CoStar is broader across commercial property types and is generally better aligned with ownership, transaction, lease and availability research across office, retail, industrial and multifamily markets. ATTOM centers more heavily on property, parcel, deed, mortgage and foreclosure data, making it relevant for users that want property level feeds or wish to build internal applications. Analysis: a homebuilder screening communities may prefer Zonda’s industry context, while a diversified brokerage may prefer CoStar and a data engineering team may favor ATTOM. Since CoStar now owns Zonda, buyers should ask how subscriptions, datasets and product roadmaps will relate, but should not assume integration that has not been demonstrated.

    How much does Zonda cost?

    Zonda does not publish standard subscription prices, user rates, module fees or advisory charges. Buyers must contact sales for a proposal based on their selected products, market coverage and requirements. Request itemized pricing for data, software modules, users, geographies, exports, implementation, training, consulting and renewal terms. Analysis: assess ROI against a documented baseline rather than a general promise of better intelligence. For example, saving 10 hours of analyst work each month at an internal cost of $100 per hour would equal $12,000 in annual labor value. That illustration is not a Zonda claim and does not account for decision quality. The purchase is easier to justify when Zonda informs a recurring pipeline of material land or development decisions.

    Who should use Zonda?

    Zonda is best suited to regional and national homebuilders, residential land developers, housing investors and lenders that make recurring decisions about market entry, site selection, community positioning and new supply. Multifamily developers may also benefit when for sale housing activity influences their demand or competitive analysis. Building product manufacturers can use housing and builder intelligence for market planning. Analysis: the ideal customer has a dedicated land, strategy or research function, a repeatable workflow and enough deal volume to spread the subscription cost across many decisions. Firms focused on office, industrial, retail or hospitality should consider a broader CRE platform first. Occasional users may obtain better economics from public data, brokerage research or a focused consulting engagement.

    What will the CoStar acquisition mean for Zonda?

    CoStar’s acquisition gives Zonda access to a larger real estate information company and may create opportunities for broader distribution, connected datasets and shared product development. Those outcomes remain prospective unless they are included in a current contract or demonstrated in a working product. Zonda has also announced Zonda Land AI as forthcoming, but buyers should distinguish a waitlist from general availability. Analysis: the key forward looking issue is whether CoStar preserves Zonda’s housing specialization while improving integration, or changes packaging and commercial terms as products converge. Prospective customers should ask for the current roadmap, planned migrations, data continuity commitments and treatment of new modules. Contract decisions should rely on capabilities available now, with future features documented separately.

    Related Reviews

    Compare Zonda with other Construction & Development tools BestCRE has scored: CompStak (76/100), Cherre (74/100), Nearmap (70/100) and Google Gemini (70/100). Browse every review in CRE Construction & Development, the full Best CRE AI Tools directory, or the 20 CRE Sectors hub.
PRIME 7.00%FED FUNDS 3.88%5-YR UST 4.74% ▲10-YR UST 4.95% ▲SOFR 30D 3.91%Updated Nov 5, 2026
Talk to a CRE Capital Advisor
Sizing a deal? | Curated capital network Tell Us About Your Deal (307) 439-0410