Category: CRE Underwriting & Deal Analysis

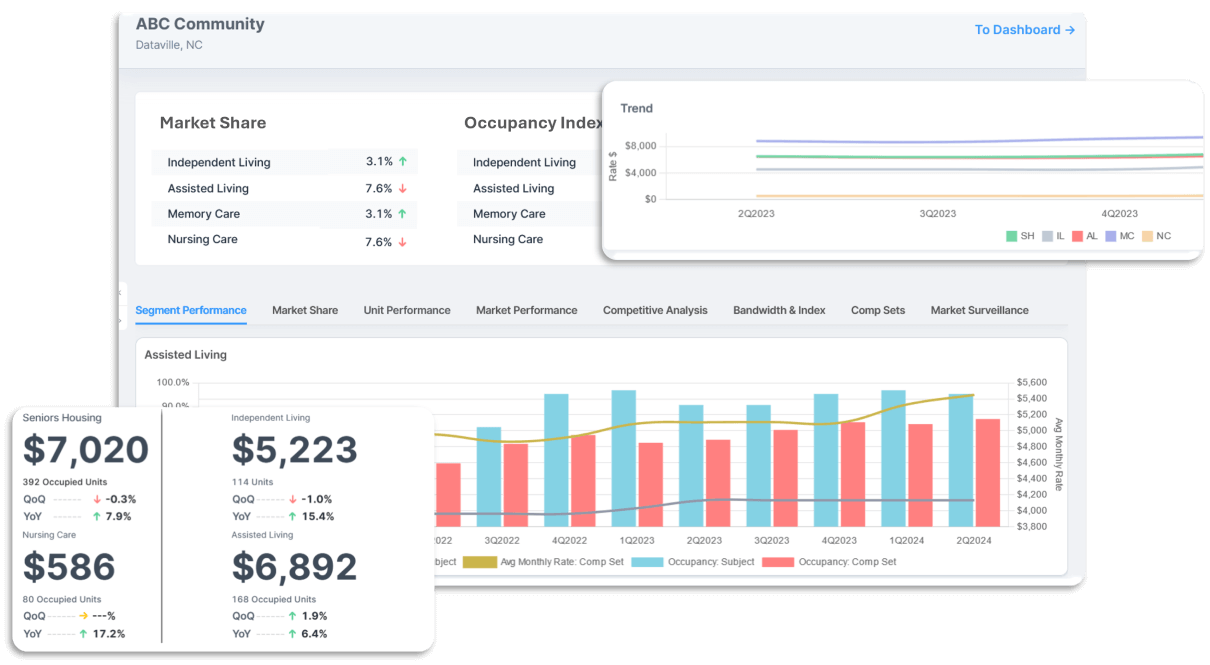
  • NIC MAP Vision Review: Senior housing market data for investment decisions

    NIC MAP Vision Review: Senior housing market data for investment decisions

    BestCRE 9AI Score

    70/100 · Contender

    NIC MAP Vision ranks #214 of 584 commercial real estate AI tools scored on the 9AI Framework. Nine dimensions, each scored out of 10: CRE relevance, data quality, ease of adoption, output accuracy, integration fit, pricing transparency, support, innovation and market reputation.

    NIC MAP Vision, now presented primarily under the NIC MAP brand, is a market intelligence platform built for senior housing and care real estate. Investors use it to compare markets and assets, lenders use it to test underwriting assumptions, developers use it to assess demand and construction pipelines, and operators use it to benchmark property performance. Its core workflow contribution is replacing fragmented market research with standardized property, occupancy, rent, supply and demographic information.

    The platform matters because senior housing cannot be evaluated adequately through conventional apartment or general commercial property data. Care type, resident needs, operator performance, local demographics, inventory composition and development pipelines can materially change an investment thesis. NIC MAP organizes those variables around senior housing rather than forcing analysts to adapt a broad property database. The company says its coverage includes more than 35,000 properties across the United States, giving users a substantial starting universe for screening and comparison.

    Its strongest position is as a reference source for market occupancy, supply and performance trends. That makes it particularly useful during market selection, acquisition screening, development feasibility and credit review. A buyer can move from a metropolitan overview into property comparisons without assembling every input manually. The platform also includes a CMBS financial dataset, extending its relevance to debt and transaction research, although buyers should confirm the fields, history and export rights included in their proposed subscription.

    BestCRE analysis: NIC MAP Vision is one of the clearest examples of a vertical CRE data product earning its place through specialization rather than feature breadth. It should not be treated as a complete underwriting system, operating platform or universal property database. Its value depends on whether senior housing is important enough to the buyer’s portfolio to justify a dedicated source. For firms active in the sector, the evidence suggests a serious diligence product. For occasional users, price, coverage and workflow fit require closer examination.

    What NIC MAP Vision Does and How It Works

    NIC MAP Vision centralizes market and property intelligence used to evaluate senior housing opportunities. Users can examine occupancy, asking rents or rates, inventory, absorption, construction activity, ownership, operators and local demand indicators. The practical mechanic is comparison: an analyst selects a market, property set or competitive area, reviews standardized observations, and tests whether an asset’s performance or development assumptions are credible relative to peers. Side by side market analysis can reduce the spreadsheet work required to normalize inconsistent broker packages and operator disclosures.

    For development and investment work, the platform connects existing supply with planned inventory and demographic demand. That helps users identify markets where population growth may support additional capacity, then examine whether the pipeline already absorbs that opportunity. Operators can use property and market benchmarks to find performance gaps, while vendors and healthcare providers can use ownership, operator and location data for account targeting or partnership planning. Its published market fundamentals report draws from over 15,000 senior housing and care properties in 214 metropolitan markets, illustrating the type of sector benchmark the underlying data can support.

    The product should be understood as decision support, not an automated investment committee. Occupancy and rate comparisons can sharpen an underwriting case, but they do not independently establish property condition, staffing stability, care quality, regulatory exposure or achievable cash flow. Data frequency, field definitions and coverage can also vary by market and property type, so serious users should inspect source methodology and sample depth before treating a result as representative. BestCRE analysis: the platform’s best use is to establish market context, challenge sponsor assumptions and direct deeper diligence toward the variables most likely to change a deal.

    9AI Framework: Dimension by Dimension Analysis

    CRE Relevance: 10/10

    NIC MAP Vision is CRE native and unusually specific within the sector. Its data maps directly to senior housing acquisition, development, lending, operating and market selection decisions. Occupancy, rates, inventory, absorption, construction pipelines, demographics, ownership and operator information are not peripheral research inputs here. They are central to underwriting and portfolio strategy. The inclusion of care property coverage and CMBS financial information further connects the platform to healthcare real estate and debt analysis. BestCRE analysis: the maximum score is justified because the product is designed around identifiable commercial property workflows and serves participants who own, finance, develop or operate physical assets. Its narrow sector focus limits applicability outside senior housing, but that does not reduce its relevance within the category. Buyers seeking a general CRE database should view specialization as a boundary, while sector specialists should view it as the main advantage.

    Data Quality and Sources: 8/10

    The platform’s strongest asset is the depth and continuity of its senior housing dataset. Longitudinal occupancy, rate, inventory and construction information allows users to distinguish a temporary movement from a structural market pattern. Standardized property and market fields also support comparisons that would be difficult to produce consistently from individual offering memoranda. The vendor publicly describes more than two decades of historical market information and 16,000 or more rate and occupancy comparables. BestCRE analysis: those characteristics support a high score, but buyers still need field level diligence. They should ask how properties enter the database, how frequently each measure is refreshed, how estimates are distinguished from reported values, and where coverage becomes thin. A large national universe does not guarantee equal sample quality in every local submarket, care segment or competitive set. Data licensing and permissible downstream use also need contractual confirmation.

    Ease of Adoption: 6/10

    NIC MAP Vision organizes research around recognizable senior housing questions, including market comparison, deal evaluation, supply pipelines and operating benchmarks. That should shorten adoption for analysts already familiar with occupancy, inventory and rate terminology. The platform’s audience specific positioning also suggests that investors, lenders, developers and operators can begin from workflows relevant to their roles rather than navigating a generic property database. BestCRE analysis: adoption is likely easier at the research layer than at the organizational layer. Users still need agreement on competitive sets, market boundaries, care categories and acceptable underwriting uses. Teams should establish when NIC MAP data overrides, supplements or merely checks information supplied by an operator or broker. Training requirements, onboarding duration and implementation services are not published in sufficient detail to assume a uniform experience, and with no trial or self serve sign up published the score is held at 6. A controlled pilot using several familiar markets is the safest way to measure usability and analyst time savings.

    Output Accuracy: 7/10

    NIC MAP Vision provides standardized observations and benchmarks, which can improve consistency compared with manually assembled market surveys. Its historical perspective is especially valuable when analysts need to assess whether current occupancy, rent or construction conditions depart from established patterns. Accuracy, however, must be separated from decision validity. A correctly reported market average may still be a poor comparison for a property with different care levels, age, quality, unit mix or operator profile. BestCRE analysis: the score of 7 recognizes a credible sector dataset, without published error rates, while preserving room for verification at the asset level. Buyers should test known properties against platform records, document the dates associated with each field and examine how missing observations are handled. They should also distinguish reported data from modeled demand or forward projections. The platform can make an underwriting process more disciplined, but it cannot eliminate judgment about competitive positioning or future operating performance.

    Integration and Workflow Fit: 6/10

    NIC MAP Vision can fit naturally into a research workflow through exports and analyst review, but the vendor does not publish enough technical detail to treat it as an open data infrastructure layer. Public information emphasizes the platform and its decision workflows more than APIs, warehouse connectors, identity standards or packaged integrations with underwriting and CRM systems. The CMBS dataset may expand its usefulness for debt research, although access format and linkage methods should be confirmed during procurement. BestCRE analysis: the integration score is therefore moderate. A buyer that mainly needs browser based analysis and spreadsheet output may find the available workflow sufficient. A firm seeking automated ingestion into a data lake, proprietary scoring model or portfolio dashboard should request documentation, sample exports, update schedules and licensing terms before committing. The decisive question is not whether data can leave the interface, but whether it can do so reliably, repeatedly and within contractual rights.

    Pricing Transparency: 4/10

    NIC MAP Vision does not publish standard subscription prices, plan thresholds or data licensing fees on its public website. Prospective customers are directed toward a consultation, which means a buyer cannot estimate total cost without entering a sales process. The final quote may vary with user count, modules, markets, coverage, exports or permitted uses, but the vendor does not publicly explain the pricing formula in enough detail for direct comparison. BestCRE analysis: this materially limits pricing transparency and caps the score below the framework threshold. Enterprise data products often require scoped contracts, yet buyers still benefit from published starting prices or clear packaging. Procurement teams should request an itemized proposal that separates platform access, additional seats, datasets, historical depth, implementation, support, exports and renewal increases. They should also confirm whether internal presentations, investment memoranda, portfolio models and client deliverables are permitted uses under the license.

    Support and Reliability: 7/10

    NIC MAP positions its service around consultation and industry expertise, and its public customer commentary references responsiveness and delivery. That is directionally encouraging for a specialized product because users often need help interpreting definitions, coverage and competitive sets, not merely resolving login problems. The platform also publishes market research that can help customers understand broader sector conditions. However, the vendor does not publish detailed service levels, support hours, response commitments, onboarding schedules or named success coverage for each subscription tier. BestCRE analysis: support appears credible but cannot receive a top score without clearer evidence about contracted service. Buyers should ask who handles data questions, how suspected errors are investigated, whether methodology specialists are available and what assistance is included during implementation. A useful pilot should include at least one support case involving a disputed property field, because the quality and speed of that response reveal more than a generic product demonstration.

    Innovation and Roadmap: 7/10

    NIC MAP Vision’s innovation lies primarily in sector specialization, longitudinal data and the combination of market, property, demographic and financial context. It is not necessary for the product to depend on novel generative AI to improve a difficult CRE workflow. A well maintained reference dataset, designed around senior housing decisions, can create more defensible value than an experimental interface. The platform also supports forward looking work through demand indicators and development pipeline analysis. BestCRE analysis: the score reflects meaningful analytical differentiation without assuming capabilities the vendor has not publicly documented. Public materials do not provide enough technical detail about machine learning, automated forecasting, natural language analysis or model governance to judge those areas highly. Buyers should evaluate the product on coverage, methodology and workflow speed rather than on an AI label. Future gains are most likely to come from easier interrogation, stronger interoperability and clearer connection between market signals and asset level decisions.

    Market Reputation: 8/10

    NIC MAP has a long standing position in senior housing research and is widely recognized among investors, lenders, developers, operators and industry advisers. Its historical market series and recurring sector benchmarks give it a reference role that newer entrants would find difficult to reproduce quickly. The company states that its information is used by more than 8,000 senior housing stakeholders, although buyers should interpret that as a vendor reported measure rather than a count of paying customer organizations. BestCRE analysis: the platform earns a high reputation score because it is associated with a defined professional market, a durable dataset and repeated use in investment and operating discussions. It stops short of 9 or 10, which are reserved for dominant cross sector incumbents, because public brand recognition does not substitute for contract specific validation. Buyers should still request references resembling their own organization, especially if they need smaller market coverage, enterprise integration, lender workflows or extensive redistribution rights.

    9AI Score Card NIC MAP Vision
    76
    70 / 100
    Solid Platform
    CRE Market Analytics
    NIC MAP Vision
    NIC MAP Vision gives senior housing investors, lenders, developers and operators a specialized benchmark for occupancy, rents, supply, demand and property performance.
    9 Dimensions, Scored 1 to 10
    1. CRE Relevance
    10/10
    2. Data Quality & Sources
    8/10
    3. Ease of Adoption
    6/10
    4. Output Accuracy
    7/10
    5. Integration & Workflow Fit
    6/10
    6. Pricing Transparency
    4/10
    7. Support & Reliability
    7/10
    8. Innovation & Roadmap
    7/10
    9. Market Reputation
    8/10
    BestCRE.com, 9AI Framework v2 Reviewed October 2026

    Who Should Use NIC MAP Vision

    NIC MAP Vision is best suited to senior housing investors, acquisition teams and lenders that repeatedly evaluate properties across multiple markets. These buyers can use consistent occupancy, rate, supply and demand information to screen opportunities, challenge offering materials and build comparable market sections for investment or credit memoranda. Developers assessing site feasibility are another strong fit because pipeline and demographic context can expose markets where apparent demand is already being addressed by planned inventory. Healthcare real estate teams expanding beyond medical office properties may also value a purpose built view of senior living supply.

    Operators with regional or national portfolios should consider the product when they need external benchmarks for property performance or strategic market planning. Research teams, valuation professionals and vendors serving senior housing may also benefit from ownership and operator intelligence. BestCRE analysis: the economic case becomes strongest when several professionals reuse the same data across acquisitions, development, finance and operations. A buyer should have enough transaction or portfolio volume to make standardized research a recurring process rather than an occasional project. The ideal customer also has an analyst or research lead responsible for methodology, permissions and consistent competitive set construction.

    Who Should Not Use NIC MAP Vision

    Firms with little or no senior housing exposure should not buy NIC MAP Vision as their primary CRE intelligence platform. Its specialization is an advantage only when the sector matters to the portfolio. A generalist brokerage, industrial investor or retail operator will probably receive broader utility from CoStar or another cross sector property database. Small teams evaluating one isolated opportunity may be better served by targeted third party research, local market interviews and operator diligence, depending on subscription cost.

    The product is also a weaker fit for buyers seeking a complete financial underwriting, asset management or operational care system. Market data can inform assumptions, but it does not replace a property model, accounting system, resident platform or physical diligence. Teams requiring an extensively documented API or automated warehouse feed should not assume NIC MAP will meet that need without written technical confirmation. BestCRE analysis: if the purchase case depends mainly on automation rather than proprietary senior housing coverage, another data architecture may deserve priority.

    Pricing and ROI Analysis

    NIC MAP Vision does not publish subscription prices, standardized packages or a public rate card. Buyers must schedule a consultation to receive a proposal. That approach prevents a reliable public estimate of annual cost and makes competitive comparison harder. A proposal should specify included markets, datasets, historical access, seats, exports, onboarding, support, renewal terms and internal distribution rights. Firms should also ask whether the CMBS dataset is included or separately licensed. Any cost figure offered without a vendor quote would be speculation.

    Analysis: calculate return using avoided research hours and decisions improved, not vague claims about better intelligence. If an acquisition team reviews 40 opportunities annually and the platform saves four analyst hours on each, the direct benefit is 160 hours multiplied by the firm’s fully loaded hourly cost. Add any avoided spending on separate market studies, then compare that total with the quoted subscription and implementation cost. Do not assign value to a prevented bad investment unless the firm can document how the data changed a real decision. A pilot should record time spent before and after adoption, data gaps found, assumptions revised and work products reused across teams.

    Integration and CRE Tech Stack Fit

    NIC MAP Vision fits most clearly between external market research and internal underwriting. Analysts can use its benchmarks to set or challenge assumptions, then carry approved findings into spreadsheet models, investment committee materials, portfolio dashboards or credit files. Ownership and operator information may also support CRM research and business development. The practical fit depends on export formats, field definitions and licensing permissions, all of which should be reviewed before designing a recurring workflow.

    Public technical information does not establish the availability or scope of an API, packaged data warehouse connector or native integrations with common CRE systems. Buyers should therefore avoid assuming automated interoperability. BestCRE analysis: start with a controlled export into the firm’s existing model, test record matching and document every manual transformation. If enterprise ingestion is required, request technical documentation, update cadence, identifiers, sample files, authentication requirements and permitted storage duration in writing. Cherre may be the more relevant alternative when data integration and normalization are the primary problem.

    Competitive Landscape

    CoStar is the most obvious alternative for firms wanting broad commercial property coverage, transaction context and prospecting tools across many asset classes. It has greater cross sector utility, but senior housing teams should compare the depth, definitions and historical consistency of its care property data directly with NIC MAP. Placer.ai approaches market selection from location intelligence and observed visitation patterns. It can help explain trade areas and consumer behavior, but it is not a substitute for specialized occupancy, rate and senior housing supply benchmarks.

    Cherre competes more as a data management and connectivity layer than as a direct senior housing reference source. It is worth considering when the buyer’s main challenge is combining internal and external property information across systems. In that case, NIC MAP data could potentially serve as an input rather than a replacement, subject to technical access and licensing. General demographic providers and local market studies may also supplement any of these products, particularly in thinly covered areas.

    BestCRE analysis: sector specialists should begin with NIC MAP Vision, then test alternatives against a fixed set of known assets and markets. Generalists should reverse that order, starting with CoStar and adding NIC MAP only if senior housing volume justifies dedicated coverage. The decisive comparison should examine property coverage, history, update frequency, definitions, export rights and analyst time, not the number of features shown in a demonstration.

    The Bottom Line

    Buy NIC MAP Vision if senior housing is a recurring investment, lending, development or operating focus and your team needs a common market benchmark. Its specialized dataset addresses variables that general CRE platforms can treat inconsistently or too broadly. Make the purchase contingent on validation in several familiar markets, clear licensing terms and a proposal showing exactly which data and services are included.

    Do not buy it merely to add another research portal. Assign an owner, define the decisions it will support and measure whether it reduces research time or changes underwriting assumptions. BestCRE analysis: NIC MAP Vision is a category leader for senior housing intelligence, but opaque pricing and limited public integration detail prevent an unconditional recommendation. For the right sector specialist, it belongs on the shortlist. For a generalist or occasional buyer, the business case must be proven through a scoped trial.

    About BestCRE

    BestCRE.com is the definitive authority on commercial real estate AI, analysis, and investment intelligence. Every article advances the platform’s mission to help CRE professionals identify, evaluate, and adopt the best tools and strategies in the industry. We benchmark platforms using the 9AI Framework so CRE leaders can compare tools with clear evidence. Explore the category map at 20 CRE sectors for deeper coverage across the CRE stack.

    Frequently Asked Questions

    What is NIC MAP Vision?

    NIC MAP Vision is a commercial real estate market intelligence platform focused on senior housing and care properties. It provides property, market, occupancy, rate, inventory, construction, demographic, ownership and operator information for investors, lenders, developers, operators and related service providers. The product is now presented primarily under the NIC MAP brand. Its role is to give analysts a standardized basis for comparing markets and testing deal assumptions that may otherwise depend on broker packages, operator disclosures and manually assembled surveys. It also includes a CMBS financial dataset. BestCRE analysis: buyers should treat it as a specialized research and benchmarking source, not as a complete underwriting, accounting, resident management or asset management system.

    How does NIC MAP Vision compare with CoStar?

    NIC MAP Vision is narrower than CoStar but more deliberately organized around senior housing. Its value centers on sector specific occupancy, rates, inventory, absorption, construction pipelines and care property comparisons. CoStar covers a much wider range of commercial real estate and may be more useful to firms working across office, industrial, retail, multifamily and other property types. The right choice depends on portfolio concentration. BestCRE analysis: a dedicated senior housing investor should test NIC MAP first because specialized definitions and history may matter more than broad coverage. A diversified CRE firm may prefer CoStar as its primary platform and consider NIC MAP as a specialist addition. Buyers should compare both products using the same known markets, properties and underwriting questions.

    How much does NIC MAP Vision cost?

    NIC MAP Vision does not publish standard prices, subscription tiers or a public starting rate. Prospective customers must request a consultation and obtain a scoped proposal. Pricing may depend on coverage, datasets, users, exports or licensing rights, but the vendor does not publicly provide enough detail to confirm the formula. Buyers should request an itemized quote covering seats, markets, historical data, onboarding, support, renewal increases and permitted internal use. They should also confirm whether specialized financial data is included. BestCRE analysis: compare the final quote with documented analyst hours saved and third party research avoided. Without those measurements, a buyer cannot distinguish productive data spending from another underused software subscription.

    Who should use NIC MAP Vision?

    NIC MAP Vision suits organizations that make repeated decisions about senior housing properties or markets. The strongest buyer profiles are acquisition teams comparing opportunities, lenders validating underwriting assumptions, developers testing demand and planned supply, and operators benchmarking portfolio performance. Healthcare real estate investors, valuation teams, researchers and vendors targeting senior living owners may also find useful intelligence. BestCRE analysis: the product is most defensible when several people reuse the same data across multiple decisions. A firm evaluating only one senior housing asset may not generate enough recurring value to justify a subscription. General CRE teams without meaningful exposure to the sector should begin with a broader property platform and use specialist research only when a transaction requires it.

    Will NIC MAP Vision add more AI and predictive analytics?

    The vendor’s public positioning emphasizes market data, benchmarks and forward looking intelligence, but it does not publish enough technical detail to confirm a specific roadmap for generative AI, machine learning features or automated investment recommendations. Buyers should not base a current purchase on capabilities that have not been released or contractually described. BestCRE analysis: the most valuable future development would be easier natural language interrogation of the dataset, clearer model documentation and stronger connections between market signals and asset level underwriting. Any predictive feature should show its source data, assumptions, update date and uncertainty. For procurement today, evaluate the platform on current coverage, history, workflow speed, exports and decision usefulness, then ask the vendor to demonstrate rather than describe planned analytics.

    Related Reviews

    Compare NIC MAP Vision with other Market Analytics & Data tools BestCRE has scored: CompStak (76/100), Green Street (73/100), Mercator.ai (72/100) and OpenAI Advanced Data Analysis (72/100). Browse every review in CRE Market Analytics & Data, the full Best CRE AI Tools directory, or the 20 CRE Sectors hub.


  • ATTOM Review: National property data for APIs analytics and AI

    ATTOM Review: National property data for APIs analytics and AI

    BestCRE 9AI Score

    70/100 · Contender

    ATTOM ranks #240 of 450 commercial real estate AI tools scored on the 9AI Framework. Nine dimensions, each scored out of 10: CRE relevance, data quality, ease of adoption, output accuracy, integration fit, pricing transparency, support, innovation and market reputation.

    ATTOM is a property data and analytics provider based in Irvine, California. Its primary buyers include investors, lenders, real estate technology companies and enterprise data teams that need standardized records across a national footprint. In a commercial real estate workflow, ATTOM can replace the slow assembly of assessor, deed, mortgage, foreclosure, boundary and neighborhood information from numerous local sources. The platform is most relevant before underwriting, during portfolio monitoring and when a software company needs property intelligence embedded inside its own product.

    The product is better understood as data infrastructure than as a finished CRE operating system. ATTOM supplies property records, derived analytics and delivery mechanisms, while the customer determines how those elements enter acquisition models, risk systems, prospecting tools or AI applications. Delivery options include an API, bulk licensing, cloud platforms and an MCP server. ATTOM also markets valuation, rental, comparable-sales, market, location and property-risk analytics, alongside specialized AI agents.

    That breadth is the principal attraction. A buyer can source ownership, tax, property characteristics, deeds, mortgages, foreclosure events, permits, parcel boundaries, schools, demographics and points of interest from one vendor. ATTOM publicly states that its data covers more than 160 million United States properties. However, broad property coverage is not the same as deep commercial asset intelligence. Teams still need to test whether the required fields, histories and entity relationships are sufficiently complete for their target markets and property types.

    BestCRE’s analysis is that ATTOM is a strong data foundation for technically capable organizations, especially those operating across many jurisdictions. It is less compelling for a principal who wants an immediately usable acquisition interface, verified tenant information or institutional CRE transaction context without internal engineering. Pricing is not publicly posted, which also makes procurement harder to evaluate before a sales process. The buying decision should therefore rest on a field-level coverage test, permitted-use review and implementation estimate, not on the length of the dataset catalog.

    What ATTOM Does and How It Works

    ATTOM collects and standardizes property information that originates across fragmented public and commercial sources. Its catalog includes assessor and tax records, physical property characteristics, geocodes, ownership, deeds, mortgage records, sales prices, foreclosure data and building permits. It also supplies geographic and contextual layers such as parcel, school and neighborhood boundaries, demographics and points of interest. Customers can use these fields to enrich an address, verify an asset, screen a market, monitor a portfolio or prefill an underwriting workflow.

    Access is designed for several technical operating models. The Property Data API supports application queries and record retrieval, while bulk licensing and file delivery serve teams that maintain internal warehouses or run large recurring analyses. Cloud delivery through Snowflake and Databricks can reduce file movement for customers already working in those environments. The MCP server is intended to make governed property information accessible to compatible AI systems and agents. ATTOM Nexus provides a discovery environment where prospective users can examine datasets and coverage before implementation, although access conditions and any associated cost are not publicly detailed.

    Above the underlying records, ATTOM offers modeled and derived products. These include an automated valuation model, a rental valuation model, comparable sales, sales trends, school ratings, neighborhood information, default propensity and natural hazard indicators. Its advertised AI agents address property and place questions, data analysis and report generation. These tools can shorten the path from a raw record to a usable response, but buyers should distinguish sourced facts from modeled estimates and generated narrative. BestCRE’s analysis is that production use requires field definitions, timestamps, confidence rules and audit trails to remain visible downstream. ATTOM can supply many ingredients for an enterprise property intelligence layer, but the customer remains responsible for workflow design, exception handling and final investment decisions.

    9AI Framework: Dimension by Dimension Analysis

    CRE Relevance: 7/10

    ATTOM earns a 7 for CRE relevance. Its ownership, tax, deed, mortgage, foreclosure, permit, boundary and location data can support acquisition screening, underwriting inputs, portfolio surveillance and loan analysis. Nationwide normalization is particularly useful when a CRE organization operates across counties with inconsistent public systems. The limitation is product orientation. ATTOM serves the broader property and housing market, and much of its public positioning is residential. It does not present itself as a complete commercial transaction, leasing, tenant, building operations or asset management platform. BestCRE’s analysis is that the fit depends heavily on the workflow. It can be central infrastructure for a proptech company or lender, yet only a supplemental source for an acquisitions team that needs institutional sales context, rent rolls, tenants and broker intelligence.

    Data Quality and Sources: 8/10

    ATTOM earns an 8 for data quality because it offers a broad, structured catalog spanning property, ownership, mortgage, transaction, foreclosure, boundary and neighborhood domains. The availability of historical public records, geocodes and parcel information supports cross checking and entity resolution. ATTOM Nexus is also positioned as a way to examine coverage before deployment, which is valuable in a category where national claims can obscure local gaps. Still, public records inherit recording delays, jurisdictional differences and source errors. Modeled outputs introduce additional assumptions. The vendor does not publicly provide one universal field-level completeness or freshness guarantee that applies across every dataset and county. BestCRE’s analysis is that buyers should request samples for representative counties, measure populated fields, compare known assets and document update intervals before assigning production authority to the data.

    Ease of Adoption: 6/10

    ATTOM earns a 6 for ease of adoption. Multiple delivery options let sophisticated customers choose an API, bulk files, cloud access or an MCP connection rather than redesigning their architecture around one channel. The discovery environment can also help teams inspect data before committing engineering resources. Adoption is nevertheless more involved than subscribing to a finished analytics application. A customer may need address matching, schema mapping, identity resolution, data storage, monitoring and business rules before users see value. Licensing restrictions must also be translated into application behavior and user permissions. BestCRE’s analysis is that a data engineering team can make ATTOM productive, but a small brokerage or principal without technical staff may face a significant implementation burden. The vendor does not publish a standard implementation timetable, so buyers should obtain a written deployment plan.

    Output Accuracy: 7/10

    ATTOM earns a 7 for output accuracy. Recorded deeds, assessor attributes, mortgage documents and similar fields can provide a defensible factual base when source dates and jurisdictions are preserved. Derived valuation, rental, risk and AI outputs can accelerate analysis, but they should not be treated as equally authoritative. Automated estimates may be less dependable for unusual commercial assets, thinly traded locations or properties with material conditions that public records do not capture. Generated reports can also present a confident narrative even when underlying fields are incomplete. BestCRE’s analysis is that ATTOM is suitable for screening and evidence gathering, with human review required for investment, credit and appraisal conclusions. Buyers should test known outcomes, retain source lineage and set escalation rules for missing or conflicting records. Public accuracy metrics are not published uniformly across all products.

    Integration and Workflow Fit: 9/10

    ATTOM earns a 9 for integration. The vendor offers API access, bulk delivery, file options, Snowflake, Databricks and an MCP server, covering most common enterprise data patterns. This allows a customer to use transactional queries in an application, load licensed records into a warehouse or expose approved property context to AI agents. The architecture is more flexible than products that confine analysis to a proprietary interface. Integration breadth does not eliminate integration work, however. Customers must map identifiers, manage refreshes, control entitlements and reconcile ATTOM records with CRM, loan, asset management and geographic systems. BestCRE’s analysis is that ATTOM’s delivery design is one of its strongest competitive features. Before contracting, technical teams should confirm endpoints, quotas, schemas, cloud-sharing arrangements, versioning policy and whether every required dataset is available through the preferred channel.

    Pricing Transparency: 3/10

    ATTOM earns a 3 for pricing transparency. The vendor does not publish standard subscription prices, usage tiers, API rates, bulk licensing fees or cloud delivery charges. That may reflect legitimate variation in datasets, geography, volume, refresh frequency, permitted uses and redistribution rights, but it prevents buyers from estimating cost without entering a sales process. It also makes direct comparison with alternative sources more time consuming. BestCRE’s analysis is that procurement should request a detailed quote separating data rights, delivery, implementation, support, overages and renewal terms. Buyers should also ask whether testing access is free, whether historical depth changes the fee and whether generated or enriched outputs may be stored or shared. ATTOM can still offer attractive economics at scale, but public information is insufficient to judge value for a particular customer.

    Support and Reliability: 7/10

    ATTOM earns a 7 for support. The company emphasizes customer and technical assistance, and an enterprise data implementation normally requires both. Its range of delivery methods suggests experience working with developers, analysts and data operations teams rather than only end users. Public resources also include market research, articles, webinars, case studies, white papers and a glossary. However, ATTOM does not publicly state universal response targets, named support tiers or service commitments that would let a buyer compare support quality before contracting. BestCRE’s analysis is that support should be evaluated through the contract and reference process. Buyers should request an escalation path, onboarding responsibilities, schema-change notice periods, data-issue remediation procedures and availability expectations. A technically complex deployment warrants a named owner and clear boundaries between implementation help, data investigation and custom engineering.

    Innovation and Roadmap: 8/10

    ATTOM earns an 8 for innovation. Its MCP server and specialized AI agents show a credible effort to make property records usable inside emerging agent workflows, rather than merely attaching an AI label to a conventional search interface. Cloud delivery, APIs and bulk access also give customers practical ways to combine the same data foundation with their own models and applications. The valuation, rental, market and risk layers extend the offering beyond raw public records. BestCRE’s analysis is that the most meaningful innovation is governed access to structured property context, not report generation by itself. Execution still matters. Buyers need evidence that agents cite source fields, respect permissions and handle uncertainty. The vendor does not publish enough standardized performance evidence to determine how its AI outputs compare across commercial property types, so pilots should focus on repeatability and traceability.

    Market Reputation: 8/10

    ATTOM earns an 8 for market reputation. It is an established property data name with visible research, industry coverage and products used across real estate, mortgage, government, insurance, technology and financial services. Its public positioning and extensive dataset catalog indicate a mature enterprise supplier rather than an early product seeking its first repeatable use case. Media organizations also use ATTOM information in housing market coverage. Even so, reputation in broad property data should not be confused with category leadership in every segment of institutional CRE. ATTOM does not publish a complete customer count, retention rate or independently audited satisfaction measure. BestCRE’s analysis is that buyers can reasonably place ATTOM on a serious enterprise shortlist, but should still obtain references whose property types, jurisdictions, delivery method and licensing needs resemble their own.

    9AI Score Card ATTOM
    70
    70 / 100
    Solid Platform
    Property Data Intelligence
    ATTOM
    ATTOM is best suited to technical teams that need nationwide property records delivered through APIs, bulk files, cloud platforms or an MCP server.
    9 Dimensions, Scored 1 to 10
    1. CRE Relevance
    7/10
    2. Data Quality & Sources
    8/10
    3. Ease of Adoption
    6/10
    4. Output Accuracy
    7/10
    5. Integration & Workflow Fit
    9/10
    6. Pricing Transparency
    3/10
    7. Support & Reliability
    7/10
    8. Innovation & Roadmap
    8/10
    9. Market Reputation
    8/10
    BestCRE.com, 9AI Framework v2 Reviewed October 2026

    Who Should Use ATTOM

    ATTOM is best suited to property technology developers, institutional investors, lenders and data teams that need normalized records across many United States jurisdictions. It is particularly relevant when an organization is building an address-level search product, enriching a CRM, screening collateral, monitoring foreclosure or mortgage activity, or assembling a property intelligence warehouse. Teams using Snowflake or Databricks may value receiving data closer to their existing analytical environment, while application developers can work through the API.

    The strongest buyer has engineers or data analysts who can evaluate fields, integrate identifiers and maintain quality controls. Portfolio managers operating across markets may also benefit when local sourcing has become inconsistent or labor intensive. AI product teams are another plausible fit because the MCP server and agent products provide paths to property context. BestCRE’s analysis is that these teams should choose ATTOM when national breadth, delivery flexibility and machine-readable records matter more than a polished CRE transaction interface. A paid pilot should represent the buyer’s actual counties, asset types and use cases.

    Who Should Not Use ATTOM

    ATTOM is not the natural first purchase for a small brokerage, owner or acquisitions team seeking a ready-made system for deal discovery, tenant research, leasing intelligence or relationship management. Such buyers may find that the data requires more engineering and interpretation than their workflow can support. Teams focused only on a few local markets may also obtain deeper information from specialized regional sources, public systems or a CRE-specific platform.

    It is also a weaker fit when the core requirement is institutional commercial sales comparables, verified company occupancy, rent rolls, lease terms or property operations. Those needs extend beyond ATTOM’s central public-record and property-data strengths. Buyers that require self-serve pricing before evaluation will encounter another obstacle because standard rates are not published. BestCRE’s analysis is that an organization should not buy ATTOM merely to claim an AI capability. It should have a defined data problem, a measurable workflow and staff who can govern the resulting information.

    Pricing and ROI Analysis

    ATTOM does not publish standard prices for its API, bulk licensing, cloud delivery, MCP server or AI agents. Pricing likely depends on the selected datasets, record volume, geography, delivery method, update frequency and rights to display, store or redistribute information, but the vendor does not publish a universal formula. Buyers should request a quote that separates recurring data access, implementation, support, overages and any fees tied to historical records or derived products. Contract review should focus closely on permitted uses, retention and redistribution.

    BestCRE’s analysis: calculate ROI using avoided data work and measurable workflow improvement. If a team currently spends 80 analyst hours each month collecting and normalizing records, and its fully loaded labor cost is $75 per hour, the addressable labor cost is $6,000 monthly. A deployment that removes half of that work creates $3,000 in monthly capacity before considering faster underwriting or improved coverage. Compare the annualized benefit with the complete first-year cost, including engineering, quality assurance and storage. This illustration is analysis, not ATTOM pricing or a promised saving.

    Integration and CRE Tech Stack Fit

    ATTOM fits best as a property data layer beneath a CRE application stack. API calls can enrich records inside underwriting, lending, CRM or portfolio systems. Bulk files can feed a warehouse, while Snowflake and Databricks delivery can support analysis where enterprise data already resides. The MCP server creates another route for approved AI systems to query property context. Customers should use stable internal property identifiers rather than relying only on addresses.

    Implementation should begin with schema and licensing review. Teams need to map ATTOM fields to parcel, loan, contact and asset records, then define refresh schedules and conflict rules. A production design should preserve source dates and separate recorded facts from modeled values or generated text. BestCRE’s analysis is that ATTOM integrates well technically, but business integration remains the customer’s responsibility. Confirm whether required datasets share identifiers, whether historical changes are delivered and how API or schema changes are communicated.

    Competitive Landscape

    Cotality, formerly associated with the CoreLogic brand, is the closest broad property-data comparison and has already scored 91 in this BestCRE category. Buyers should compare field coverage, valuation products, risk information, licensing and service within the precise jurisdictions they operate. ATTOM may appeal more strongly to API-first and AI-oriented product teams because it prominently offers cloud delivery, an MCP server and specialized agents. The deciding evidence should come from matched property samples, not catalog breadth alone.

    Reonomy, an Altus Group product, is a more CRE-specific alternative for commercial property intelligence, ownership discovery and prospecting. It may suit brokers and acquisitions professionals who want an application centered on commercial assets rather than a general property data foundation. Cherre is an alternative for organizations prioritizing data integration, normalization and governance across multiple real estate sources. Its role can overlap with ATTOM’s infrastructure value, although the products approach the problem from different starting points.

    Regrid is worth considering when parcel boundaries, spatial data and land records are the primary requirement. It may offer a more focused parcel-centered proposition, while ATTOM spans a wider mix of mortgage, foreclosure, transaction, valuation and neighborhood information. BestCRE’s analysis is that ATTOM wins consideration through breadth and delivery flexibility. It loses ground when a buyer needs a CRE-native user workflow, public price discovery or a narrowly specialized dataset with greater local depth.

    The Bottom Line

    Put ATTOM on the shortlist if your organization needs a national property data foundation and has the technical capacity to integrate it. Its breadth, API options, cloud delivery and AI access model are credible advantages for lenders, investors and proptech builders. Require a representative data sample and test completeness, freshness, identifiers and modeled outputs against known assets before negotiating a full license.

    Do not select ATTOM solely for its dataset count or AI positioning. The material questions are whether its fields answer your commercial workflow, whether licensing permits the intended product and whether implementation costs preserve the business case. BestCRE’s analysis is that ATTOM is a strong CRE-adjacent infrastructure choice, but not a substitute for specialized leasing, tenant, transaction or asset management systems.

    About BestCRE

    BestCRE.com is the definitive authority on commercial real estate AI, analysis, and investment intelligence. Every article advances the platform’s mission to help CRE professionals identify, evaluate, and adopt the best tools and strategies in the industry. We benchmark platforms using the 9AI Framework so CRE leaders can compare tools with clear evidence. Explore the category map at 20 CRE sectors for deeper coverage across the CRE stack.

    Frequently Asked Questions

    What is ATTOM property data?

    ATTOM is a United States property data and analytics provider. It organizes assessor and tax information, physical property characteristics, ownership, deeds, mortgages, sales, foreclosures, permits, boundaries, schools, neighborhoods and related contextual data. Customers can receive information through an API, bulk files, cloud platforms or an MCP server. ATTOM also offers derived products such as automated valuations, rental estimates, comparable sales, market analytics and risk indicators. For commercial real estate users, it is best viewed as a data foundation that can support underwriting, portfolio monitoring, prospecting and application development. It is not a complete CRE operating platform, and teams seeking lease, tenant or institutional transaction intelligence may need other sources.

    How does ATTOM compare with Reonomy and Cotality?

    ATTOM and Cotality both compete as broad property data suppliers, with records and analytics that can serve real estate, lending, insurance and technology workflows. A useful comparison should test the exact fields, counties, histories, valuation outputs and licensing rights required by the buyer. Reonomy is more explicitly centered on commercial real estate intelligence and may be easier for brokers or acquisitions teams that want ownership research and prospecting in a ready-made interface. ATTOM’s relative strength is its range of delivery options, including API, bulk, cloud and MCP access. BestCRE’s analysis is that technical product teams may prefer ATTOM’s infrastructure orientation, while CRE professionals seeking an end-user workflow may favor Reonomy. No vendor should be chosen without matched asset testing.

    How much does ATTOM cost?

    ATTOM does not publish standard pricing for its Property Data API, bulk data licenses, cloud delivery, MCP server or AI agents. Buyers must contact the company for a quote. The final cost may vary with selected datasets, geography, usage volume, update frequency, delivery method and rights to retain, display or redistribute the data, although ATTOM does not publish one universal pricing formula. Ask for a complete first-year and renewal estimate that separates licensing, onboarding, support, usage limits and overage charges. Also confirm whether a representative evaluation dataset is available before commitment. BestCRE’s analysis is that the absence of public rates is a meaningful procurement weakness because buyers cannot screen affordability or compare alternatives without a sales process.

    Who should use ATTOM?

    ATTOM best suits lenders, institutional investors, property technology companies and enterprise data teams that require standardized property records across many United States markets. Strong use cases include enriching an application, screening collateral, monitoring ownership or mortgage events, building a property warehouse and supplying governed context to an AI assistant. The ideal customer has engineers or analysts who can map schemas, reconcile identifiers, monitor updates and apply licensing controls. A smaller CRE team can still benefit, but only if it has a clear workflow and adequate implementation resources. ATTOM is less suitable for buyers seeking an immediate replacement for a brokerage database, leasing platform, rent roll system or asset management application. BestCRE’s analysis is that technical readiness matters almost as much as data need.

    Will ATTOM AI agents improve CRE underwriting?

    ATTOM’s AI direction could improve early underwriting by making property facts, market context and derived analytics easier to query and summarize. Its MCP server may also help compatible AI systems reach approved data without relying on copied reports or unstructured searches. The forward-looking opportunity is faster evidence gathering with clearer links to structured records. The risk is that generated narrative can conceal missing fields, stale public records or model uncertainty, especially for unusual commercial assets. BestCRE’s analysis is that buyers should treat agents as an analytical interface, not an autonomous investment authority. A pilot should measure source traceability, repeatability, exception handling and time saved on real deals. ATTOM does not publish enough universal performance evidence to assume equal results across CRE property types.

    Related Reviews

    Compare ATTOM with other Market Analytics & Data tools BestCRE has scored: CompStak (76/100), Placer.ai (74/100), Orbital (63/100) and SheetGod (48/100). Browse every review in CRE Market Analytics & Data, the full Best CRE AI Tools directory, or the 20 CRE Sectors hub.

  • Rockport VAL Review: Commercial property valuation and cash flow modeling

    Rockport VAL Review: Commercial property valuation and cash flow modeling

    BestCRE 9AI Score

    74/100 · Contender

    Rockport VAL ranks #143 of 450 commercial real estate AI tools scored on the 9AI Framework. Nine dimensions, each scored out of 10: CRE relevance, data quality, ease of adoption, output accuracy, integration fit, pricing transparency, support, innovation and market reputation.

    Rockport VAL is commercial real estate valuation and cash flow modeling software for fee appraisers, review appraisers, lenders, investment sales teams, property owners, investors, mortgage brokers, and consultants. Its job is to replace or supplement the spreadsheets and established modeling applications used to convert lease, expense, financing, and market assumptions into property cash flows and valuations. The product is CRE-native, not a general financial model adapted to real estate.

    The practical appeal is focus. Rockport positions VAL as an alternative to ARGUS Enterprise, particularly for professionals who need institutional income property analysis without adopting a broader asset management platform. The workflow centers on building property assumptions, modeling tenant and operating cash flows, testing scenarios, and producing valuation conclusions. That makes it relevant to both appraisal production and the internal review work performed by lenders and investors.

    VAL also sits inside a wider Rockport product family covering lending, servicing, budgeting, and calculation services. Rockport makes its calculation engine available through REST API calls, including connections from internal systems and Microsoft Excel models. The open architecture is meaningful for firms that want validated CRE calculations inside an existing workflow rather than another isolated desktop model. Valcre is a named integration partner, strengthening the product’s fit for appraisal firms.

    BestCRE analysis: VAL appears most compelling as a lighter, appraiser-friendly modeling layer for organizations that find ARGUS too burdensome or want programmatic access to CRE calculations. Its limitations are commercial and evidentiary rather than conceptual. Rockport does not publish VAL pricing, implementation costs, model validation results, or detailed adoption metrics for the product. A buyer should therefore treat the demonstration, sample-property testing, and contract review as essential parts of diligence.

    What Rockport VAL Does and How It Works

    Rockport VAL models the economics of commercial income property. Users enter or import property details, lease assumptions, contractual rent changes, reimbursements, operating expenses, market leasing assumptions, capital costs, and exit assumptions. The software then calculates property cash flows and supports valuation and scenario analysis. This is the core work behind appraisal conclusions, acquisition underwriting, investment sales opinions, lender reviews, and periodic portfolio valuation. The value is not simply producing a discounted cash flow. It is organizing interdependent CRE assumptions in a repeatable model.

    The product’s appraiser orientation matters because appraisal work requires more than a single return calculation. Analysts need to explain assumptions, reconcile contractual and market economics, examine alternative cases, and move information into review or reporting workflows. VAL is positioned for fee and review appraisers as well as investors and brokers, suggesting a shared analytical model across parties. Public product information does not establish every supported property type, report format, import template, or edge case, so firms should test their most complicated leases and reimbursement structures during evaluation.

    A second mechanism is access to Rockport’s calculation capabilities through REST API calls. This can allow an internal platform, data pipeline, or Excel-based process to request CRE calculations without forcing every step into a separate user interface. BestCRE analysis: that architecture can reduce duplicate entry and make standardized calculations easier to govern across teams. It does not automatically solve source-data quality, assumption approval, or model-risk controls. Buyers must determine which VAL functions are exposed, how authentication and versioning work, what audit information is returned, and whether API access carries separate fees.

    9AI Framework: Dimension by Dimension Analysis

    CRE Relevance: 9/10

    A score of 9 reflects unusually direct alignment with commercial real estate valuation. VAL is designed around income property cash flow modeling, scenario analysis, and valuation rather than generic financial planning. Its stated audiences include fee appraisers, review appraisers, lenders, investment sales professionals, owners, investors, brokers, and consultants. Those are the people who create, challenge, or consume CRE valuation models. The broader Rockport product family also addresses lending, servicing, budgeting, and portfolio workflows, which gives VAL credible industry context. BestCRE analysis: the product loses one point because public information does not clearly document the full property-type coverage, specialized lease treatments, or jurisdiction-specific appraisal requirements. Buyers with hotels, healthcare assets, ground leases, development projects, or unusually complex reimbursements should verify coverage with representative files before standardizing on it.

    Data Quality and Sources: 7/10

    A score of 7 recognizes that VAL provides a structured environment for property, lease, expense, market, and valuation assumptions, which is generally safer than loosely controlled spreadsheets. Structured inputs can improve consistency and make reviews easier, but software cannot make weak source data reliable. Public information does not establish proprietary market-data coverage, automated cleansing rates, validation benchmarks, or the frequency of any third-party data updates. Rockport also states a data pledge, but buyers should read the operative contract and security documentation rather than relying on a policy label. BestCRE analysis: VAL’s data quality will depend heavily on the firm’s import process, field mapping, approval controls, and source systems. During diligence, buyers should trace several leases from source document to final cash flow and identify where transformations, defaults, or manual overrides occur.

    Ease of Adoption: 7/10

    A score of 7 indicates a product that appears more approachable than the category’s heaviest incumbent, while still requiring serious CRE knowledge. Rockport presents VAL as an alternative to established cash flow modeling software and provides training and system requirements resources. Its appraiser focus should reduce the mismatch that occurs when a generic modeling tool is forced into appraisal practice. The Valcre relationship may also help appraisal firms connect modeling with report production. BestCRE analysis: lighter weight does not mean instant deployment. Firms must still configure standards, migrate templates, train reviewers, test complex assets, and decide how old models will be retained. Public information does not disclose typical implementation duration, training hours, or migration effort. Buyers should ask users with different experience levels to rebuild the same property and compare time, errors, and review comments.

    Output Accuracy: 8/10

    A score of 8 reflects Rockport’s emphasis on CRE calculation systems and the product’s purpose-built approach to property cash flows and valuation. A centralized calculation engine can promote consistent treatment of assumptions across users and systems. API access also creates an opportunity to use the same calculation logic in internal applications and Excel workflows. Still, no valuation platform can guarantee an accurate opinion of value because results depend on lease abstracts, market assumptions, discount rates, terminal capitalization rates, and analyst judgment. The vendor does not publish independent accuracy studies, model validation reports, or error rates for VAL. BestCRE analysis: the right test is reconciliation. Prospective buyers should run known properties through VAL and the incumbent model, investigate every material variance, document rounding and timing conventions, and confirm that exported reports preserve the assumptions necessary for review.

    Integration and Workflow Fit: 8/10

    A score of 8 is supported by Rockport’s explicit technology offering around REST API access to CRE calculations and by VAL’s integration relationship with Valcre. This is stronger than the closed-file approach common in older valuation tools. API access can support internal underwriting systems, data platforms, and controlled Excel models, while Valcre can connect appraisal analysis with assignment and report workflows. The open posture is a genuine differentiator, but public product information does not provide a complete connector catalog, API schema, rate limits, sandbox terms, or implementation pricing. BestCRE analysis: buyers should distinguish between an available API and a production-ready integration for their exact process. Ask Rockport to demonstrate data moving into the model, calculations being invoked, exceptions being handled, and results returning with identifiers and audit context intact.

    Pricing Transparency: 5/10

    A score of 5 is the maximum permitted when a vendor does not publish pricing. Rockport directs prospective customers to sales rather than listing subscription fees, user tiers, API charges, onboarding costs, support packages, or contract minimums. That approach may accommodate different firm sizes and configurations, but it prevents buyers from estimating total cost before entering a sales process. It also makes direct comparison with ARGUS Enterprise, Valcre, Bowery Valuation, or an internal spreadsheet workflow harder. BestCRE analysis: request a written cost schedule covering licenses, implementation, training, data migration, integrations, calculation volume, environments, renewals, and termination assistance. Buyers should also clarify whether occasional reviewers require paid seats and whether archived models remain accessible after cancellation. Commercial flexibility may be available, but it is not publicly documented.

    Support and Reliability: 8/10

    A score of 8 reflects Rockport’s visible emphasis on long-term client relationships, dedicated VAL sales and customer service contact information, training resources, and experience serving demanding CRE institutions. The company publishes named testimonials for its broader organization, including comments about domain expertise and responsiveness. Those signals are relevant because valuation software often requires help with modeling conventions rather than generic technical support. However, the vendor does not publish VAL-specific response-time commitments, support hours, customer satisfaction measures, escalation procedures, or the scope of included training. BestCRE analysis: buyers should evaluate support with realistic modeling questions during the trial or demonstration period. Contract diligence should cover severity definitions, response targets, calculation disputes, release notices, training access, and responsibility for integration failures. Strong relationship language is useful, but enforceable service terms matter more.

    Innovation and Roadmap: 7/10

    A score of 7 reflects a practical form of innovation rather than an unproven artificial intelligence claim. VAL combines purpose-built CRE valuation modeling with programmatic access to calculation services, allowing firms to place established real estate logic inside their own systems and Excel processes. That architecture is relevant in a market still shaped by desktop files, manual rekeying, and closed models. The product also presents a credible alternative to a long-standing category incumbent. Public information does not show that VAL uses generative AI, autonomous appraisal production, proprietary predictive models, or a novel market-data network. BestCRE analysis: this restraint is not inherently negative. Valuation buyers should favor explainable calculations and controlled assumptions. The innovation score would rise with published API documentation, clearer workflow automation, stronger interoperability evidence, and independently demonstrated reductions in modeling or review effort.

    Market Reputation: 8/10

    A score of 8 reflects Rockport’s established position in commercial real estate technology, its association with founder Rick Trepp, and its work across lending, servicing, valuation, budgeting, and calculation systems. The company publishes named institutional testimonials for the broader Rockport relationship and presents a product portfolio built for sophisticated CRE organizations. That history gives VAL more credibility than a new valuation application without domain lineage. At the same time, product-level evidence is thinner than company-level reputation. Rockport does not publish VAL customer counts, retention figures, market share, or a detailed roster of active valuation users. BestCRE analysis: buyers should request references matching their own role, asset mix, and implementation pattern. A lender using an API and a fee appraiser producing reports face different operational risks, so reputation should be confirmed within the relevant workflow.

    9AI Score Card Rockport VAL
    74
    74 / 100
    Solid Platform
    CRE Valuation Software
    Rockport VAL
    Rockport VAL gives appraisers and investment professionals a focused alternative to ARGUS for income property cash flow modeling, valuation, and scenario analysis.
    9 Dimensions, Scored 1 to 10
    1. CRE Relevance
    9/10
    2. Data Quality & Sources
    7/10
    3. Ease of Adoption
    7/10
    4. Output Accuracy
    8/10
    5. Integration & Workflow Fit
    8/10
    6. Pricing Transparency
    5/10
    7. Support & Reliability
    8/10
    8. Innovation & Roadmap
    7/10
    9. Market Reputation
    8/10
    BestCRE.com, 9AI Framework v2 Reviewed October 2026

    Who Should Use Rockport VAL

    VAL should make the shortlist for fee appraisal and review appraisal firms seeking a focused income property model, especially when ARGUS Enterprise feels too broad, expensive, or operationally heavy. It is also relevant to lenders that need repeatable valuation reviews, investment sales teams building defensible cash flows, and owners or investors comparing acquisition and disposition scenarios. Firms already using Valcre have a particularly clear reason to examine the integration and determine whether it reduces movement between valuation analysis and appraisal reporting.

    The strongest buyer profile has experienced CRE analysts, documented modeling standards, and a desire to connect calculations with other systems. An internal technology team can make more use of Rockport’s REST API, while a centralized valuation group can benefit from consistent calculation logic. BestCRE analysis: buyers should prefer VAL when explainability, scenario control, and appraisal-friendly operation matter more than acquiring a broad asset management suite. A successful deployment still needs an accountable model owner, tested templates, role-based review procedures, and a plan for reconciling historical models.

    Who Should Not Use Rockport VAL

    VAL is less suitable for teams seeking a fully automated appraisal service, a proprietary market-data terminal, or an AI system that derives valuation assumptions without analyst involvement. It is a calculation and workflow product, not a substitute for inspection, lease abstraction, market research, or professional judgment. Small teams with simple assets and infrequent valuation needs may find a governed spreadsheet adequate, depending on audit, collaboration, and reporting requirements.

    Firms deeply standardized on ARGUS Enterprise should not switch solely because VAL appears lighter. Conversion risk, client file expectations, staff familiarity, and historical model compatibility may outweigh interface or API benefits. Buyers needing a published price, immediate self-service purchasing, or a clearly documented connector marketplace may also be frustrated. BestCRE analysis: if Rockport cannot demonstrate the buyer’s hardest lease structures, required outputs, and integration path using representative data, the firm should retain its incumbent or conduct a limited pilot rather than authorize a portfolio-wide change.

    Pricing and ROI Analysis

    Rockport does not publish VAL subscription prices, license tiers, implementation charges, training fees, API pricing, or contract minimums. Prospective buyers must contact sales for a proposal. A useful quote should separate user licenses from onboarding, migration, integration, support, and any volume-based calculation charges. It should also state renewal terms, price increases, environment fees, reviewer access, data export rights, and the treatment of archived models. Without those details, a low initial license price can understate the total cost of ownership.

    Analysis: a simple ROI test starts with annual labor savings, avoided software expense, and reduced correction work. If ten analysts each save two hours per month, the firm saves 240 hours annually. Multiply those hours by the firm’s fully loaded hourly cost, then add any measurable reduction in incumbent licensing or outsourced modeling expense. Compare that benefit with the complete first-year cost and the recurring annual cost. Do not count theoretical automation benefits unless a pilot demonstrates them. The same analysis should include migration time, training, parallel testing, integration maintenance, and the cost of retaining legacy software during transition.

    Integration and CRE Tech Stack Fit

    VAL fits best in a CRE stack where valuation assumptions originate in appraisal, underwriting, property, or data systems and calculated results must move into reports or review processes. Rockport offers REST API access to calculation capabilities and identifies Valcre as an integration partner. The company also describes calls from Microsoft Excel models, which can help firms retain familiar analyst interfaces while centralizing selected calculation logic.

    BestCRE analysis: the integration proposition is credible but must be proven at field level. Buyers should map the system of record for properties, spaces, leases, expenses, market assumptions, scenarios, and valuation results. They should then test identifiers, validation errors, overrides, calculation versions, and audit history across the full round trip. Public information does not disclose packaged connections to every common CRE data, accounting, or document system. Firms using Yardi, MRI, or other platforms should confirm VAL-specific connectivity rather than assuming integrations available elsewhere in Rockport’s portfolio apply to this product.

    Competitive Landscape

    ARGUS Enterprise is the clearest alternative. It remains a familiar standard for institutional commercial property cash flow modeling and benefits from a large base of trained users and established file expectations. VAL’s case is a more focused, appraiser-friendly experience and a more open approach to calculation access. BestCRE analysis: firms exchanging ARGUS files with clients or counterparties should quantify compatibility and conversion requirements before changing platforms. Familiarity can be an operational asset even when the incumbent feels cumbersome.

    Valcre addresses appraisal workflow, data collection, valuation, and report production, and it is also a Rockport integration partner. Buyers should determine whether they need Valcre, VAL, or both, since complementary positioning can still create overlapping functions and separate commercial terms. Bowery Valuation is another relevant name, but its technology-supported appraisal service model differs from buying modeling software for internal analysts. The right comparison depends on whether the buyer wants software, an appraisal provider, or an integrated production workflow.

    For acquisition and portfolio teams, internally governed Excel models remain the practical fourth competitor. Spreadsheets offer flexibility and low marginal software cost, but they create version, review, and consistency problems as teams scale. VAL earns consideration when standardized CRE calculations and API access justify adopting a controlled platform. A representative-property pilot should decide the contest, not a feature checklist.

    The Bottom Line

    Put Rockport VAL on the shortlist if the organization needs institutional CRE cash flow modeling but wants an appraiser-oriented alternative to ARGUS Enterprise. Its strongest differentiators are purpose-built valuation mechanics, fit across appraisal and investment workflows, and access to CRE calculations through an API. The Valcre relationship adds practical relevance for appraisal firms.

    Do not buy from the demonstration alone. Require a pilot using difficult real properties, reconcile results against the incumbent, inspect the audit trail, and obtain a complete commercial proposal. BestCRE analysis: VAL is a credible choice for firms prepared to govern models and integrations, but its unpublished pricing and limited public product-level evidence make reference calls and contractual diligence mandatory. Choose it when the tested workflow is measurably easier without sacrificing calculation control.

    About BestCRE

    BestCRE.com is the definitive authority on commercial real estate AI, analysis, and investment intelligence. Every article advances the platform’s mission to help CRE professionals identify, evaluate, and adopt the best tools and strategies in the industry. We benchmark platforms using the 9AI Framework so CRE leaders can compare tools with clear evidence. Explore the category map at 20 CRE sectors for deeper coverage across the CRE stack.

    Frequently Asked Questions

    What is Rockport VAL?

    Rockport VAL is commercial real estate software for property cash flow modeling, valuation, and scenario analysis. It is designed for fee appraisers, review appraisers, lenders, investment sales professionals, owners, investors, mortgage brokers, and consultants. Users build an income property model from lease, expense, market, capital, and exit assumptions, then analyze the resulting cash flows and value conclusions. Rockport positions it as an alternative to established CRE modeling products such as ARGUS Enterprise. VAL is part of a broader Rockport product family covering lending, servicing, budgeting, and calculation technology. It should be evaluated as an analytical platform, not as a source of automatically correct assumptions or a replacement for appraisal judgment.

    How does Rockport VAL compare with ARGUS Enterprise?

    Both products address commercial property cash flow modeling and valuation. ARGUS Enterprise has broad institutional familiarity, an established user community, and file conventions that many counterparties already expect. Rockport VAL is positioned as a lighter, appraiser-friendly alternative, with REST API access to calculation capabilities as an important point of differentiation. BestCRE analysis: VAL may suit firms prioritizing appraisal workflow and integration flexibility, while ARGUS may remain preferable when external file exchange and existing staff proficiency dominate the decision. Buyers should rebuild several representative properties in both products, reconcile cash flows and valuation outputs, compare review effort, and test the movement of models between clients and internal systems before deciding.

    How much does Rockport VAL cost?

    Rockport does not publish VAL pricing. The vendor does not provide public subscription rates, implementation fees, API charges, training costs, user tiers, or contract minimums. Buyers must contact sales and request a tailored proposal. The proposal should identify first-year and recurring costs separately, including licenses, onboarding, model migration, integrations, support, test environments, calculation volume, renewal increases, and data export. BestCRE analysis: compare the complete cost with documented analyst time savings, eliminated incumbent licenses, and reduced correction work. Use a pilot to establish those benefits rather than accepting estimates. Buyers should also ask whether reviewers and occasional users need paid seats and what access remains available after the agreement ends.

    Who should use Rockport VAL?

    Rockport VAL best suits CRE professionals who routinely build or review income property cash flows. That includes fee and review appraisers, lender valuation teams, investment sales analysts, acquisition groups, property owners, investors, mortgage brokers, and consultants. It is particularly relevant to firms that want a more focused alternative to ARGUS Enterprise or need CRE calculation capabilities inside internal systems and Excel-based processes. Organizations using Valcre should investigate the available integration. BestCRE analysis: the ideal customer has experienced analysts, standardized assumptions, a defined review process, and someone accountable for model governance. Teams wanting automated market conclusions, a proprietary data terminal, or a fully outsourced appraisal service should consider other products or service providers.

    Will Rockport VAL add more AI and automation?

    Rockport does not publish a detailed public roadmap specifying future artificial intelligence features for VAL. Buyers should not assume that generative AI, automated lease abstraction, predictive valuation, or autonomous appraisal production will be added on a particular schedule. The current strategic opportunity is more grounded: connect structured CRE inputs, calculation services, scenario analysis, and review workflows while keeping assumptions explainable. BestCRE analysis: future automation would be most valuable if it reduces data entry and identifies inconsistencies without obscuring calculation logic or professional judgment. During procurement, ask for the product roadmap, release process, customer input mechanism, API versioning policy, and contractual treatment of new modules. Evaluate the product on capabilities available now, not on an undated roadmap.

    Related Reviews

    Compare Rockport VAL with other Valuation & Appraisal tools BestCRE has scored: V7 Go (73/100), Hover (71/100), CRE Agents (63/100) and ZipSmart.ai (63/100). Browse every review in CRE Valuation & Appraisal, the full Best CRE AI Tools directory, or the 20 CRE Sectors hub.

  • ARGUS Enterprise Review: Institutional CRE cash flow modeling and valuation

    ARGUS Enterprise Review: Institutional CRE cash flow modeling and valuation

    BestCRE 9AI Score

    77/100 · Contender

    ARGUS Enterprise ranks #101 of 450 commercial real estate AI tools scored on the 9AI Framework. Nine dimensions, each scored out of 10: CRE relevance, data quality, ease of adoption, output accuracy, integration fit, pricing transparency, support, innovation and market reputation.

    ARGUS Enterprise is Altus Group’s commercial real estate cash flow forecasting and valuation software, used primarily by institutional investors, asset managers, appraisers and lenders. It changes the underwriting workflow by placing lease economics, operating assumptions, capital costs and valuation calculations inside a standardized property model. For teams trading complex income-producing assets, the practical attraction is not simply discounted cash flow functionality. It is the ability to exchange, inspect and revise a model that many counterparties already recognize.

    The product is especially established in workflows where individual leases materially affect value. Analysts can model contractual rent steps, expirations, renewal assumptions, downtime, tenant improvements, leasing commissions, recoveries and market leasing scenarios. Those assumptions flow into property cash forecasts and valuation outputs. This makes ARGUS Enterprise more specialized than a spreadsheet, but it does not remove judgment from underwriting. The model is only as defensible as the lease interpretation, market assumptions and review controls behind it.

    Its institutional position creates a meaningful network effect. Buyers, sellers, lenders, appraisers and consultants can work from the same model format instead of translating every property into a proprietary workbook. Analysis: this compatibility is ARGUS Enterprise’s strongest buying argument. An organization may prefer another interface or reporting layer, yet still need ARGUS files because its investment partners, valuation teams or transaction counterparties expect them.

    ARGUS Enterprise now sits within the broader ARGUS Intelligence Platform, where Altus is adding portfolio management, operational data connections and ARGUS Assist. Altus describes ARGUS Assist as an agentic AI capability for valuations, forecasts and comparisons. Buyers should distinguish the proven Enterprise modeling engine from the newer intelligence layer during procurement. Confirm which capabilities are included, how existing models migrate, what review evidence AI generated work provides and whether the proposed platform configuration matches the team’s actual valuation process.

    What ARGUS Enterprise Does and How It Works

    ARGUS Enterprise builds property level cash flows from lease and market assumptions. An analyst enters tenancy details, contractual rents, escalation structures, lease dates, expense recoveries and renewal assumptions, then adds operating expenses, capital items and market leasing parameters. The software projects income and costs across the selected holding period. It can then support discounted cash flow analysis and other valuation views, allowing analysts to examine how property value responds to changes in leasing, market and exit assumptions.

    The mechanics are particularly useful for multitenant properties because the model treats lease events separately rather than applying one blended growth rate to the entire asset. Expirations, vacancy periods, free rent, tenant improvements, commissions and renewal probabilities can be reflected in projected cash flows. Analysts can compare scenarios and inspect period level results. The software organizes complexity, but it does not verify that an abstracted lease term is correct or that a market rent assumption is reasonable. Those remain human review responsibilities.

    At the platform level, Altus is connecting Enterprise models with ARGUS Asset Manager and ARGUS Portfolio Manager. The stated objective is to move from isolated valuation files toward continuously updated asset and portfolio analysis. ARGUS Assist adds a natural language and specialized agent layer intended to generate valuations, forecasts and comparisons more quickly. Analysis: the direction is strategically sensible because institutional owners often struggle to aggregate property models and reconcile them with operating data. Buyers should still test the actual workflow using their own files, asset types and approval controls. Ask Altus to demonstrate source traceability, assumption changes, exception handling and export fidelity before treating AI produced analysis as investment committee ready.

    9AI Framework: Dimension by Dimension Analysis

    CRE Relevance: 10/10

    ARGUS Enterprise earns 10 for CRE relevance because the product is built specifically around the economics of income-producing commercial property. Its core objects and assumptions reflect leases, tenants, recoveries, market leasing, operating costs, capital expenditure and exit valuation rather than generic financial planning. That specialization matters most for office, retail, industrial and other assets where individual lease events shape cash flow. The software also fits recognizable acquisition, appraisal, lending and asset management workflows. Analysis: few products are more directly embedded in institutional property valuation. The limitation is not relevance but scope. ARGUS Enterprise is a valuation and forecasting engine, not a complete transaction, accounting or property management system. Buyers still need surrounding tools and disciplined processes for lease abstraction, source document control, approvals, actuals and portfolio reporting.

    Data Quality and Sources: 8/10

    ARGUS Enterprise earns 8 for data quality. The modeling structure can preserve detailed lease, market and expense assumptions, while Altus is positioning the wider ARGUS Intelligence Platform around proprietary CRE data and connected operational information. However, Enterprise models commonly depend on data entered, imported or reviewed by the customer. A detailed schema does not guarantee a correct rent roll, faithful lease abstraction or current market assumption. Analysis: the product supports high quality valuation data, but the outcome depends heavily on governance before and after information reaches the model. Buyers should test validation rules, field lineage, update procedures and exception reports with representative assets. Altus does not publicly provide enough product level evidence to assign a higher score for completeness or error rates. Teams should also establish who owns each assumption and how changes are approved.

    Ease of Adoption: 6/10

    ARGUS Enterprise earns 6 for ease of adoption. Its familiar position in institutional CRE can simplify collaboration because experienced analysts, appraisers and counterparties may already understand the model format. The tradeoff is a substantial conceptual and operational learning curve. Users need knowledge of lease structures, recovery mechanics, market leasing and valuation conventions as well as product navigation. Analysis: this is not software that an occasional user should expect to master through interface intuition alone. Adoption is easier when a firm has trained internal champions, standardized templates and formal model review procedures. Buyers should budget for training, model conversion, permissions and quality assurance, particularly while Altus moves customers toward the ARGUS Intelligence Platform. A pilot should measure the time required for new analysts to build, audit and revise a representative property rather than relying on a polished demonstration.

    Output Accuracy: 8/10

    ARGUS Enterprise earns 8 for output accuracy because it provides a structured, repeatable engine for projecting property cash flows from explicit assumptions. Users can inspect lease events and valuation inputs instead of relying on an unexplained headline estimate. Its widespread use by valuation professionals also encourages shared conventions and review familiarity. Accuracy, however, is conditional rather than automatic. Incorrect lease dates, recovery methods, renewal assumptions or terminal inputs can produce precise but misleading results. Analysis: the defensibility of ARGUS comes from transparent modeling structure and reviewable assumptions, not from independent knowledge of the right value. Buyers should require input reconciliation, change logs, scenario review and secondary approval for material models. The newer AI capabilities deserve separate testing for traceability and reproducibility. Altus does not publish a universal model accuracy rate, and such a number would have limited meaning across different properties and assumptions.

    Integration and Workflow Fit: 7/10

    ARGUS Enterprise earns 7 for integration. Its file format is widely exchanged in institutional valuation workflows, which provides practical interoperability even when formal system connections are limited. Within Altus’s product family, Enterprise models can connect to asset and portfolio management capabilities, and Altus offers integration services intended to keep CRE data and forecasts current. Analysis: this is a credible foundation, but buyers should not assume that every accounting, property management, data warehouse or investment management system connects without configuration. Public product information does not provide a complete, standardized list of supported connectors, implementation effort or synchronization behavior. Procurement teams should request architecture documentation and test field mapping, identifiers, update frequency, permissions and error handling. Exporting a model is useful, but it is not equivalent to governed, bidirectional integration across the investment stack.

    Pricing Transparency: 4/10

    ARGUS Enterprise earns 4 for pricing transparency because Altus does not publish straightforward package prices on its public website. Buyers must contact the vendor for a proposal, making it difficult to compare total cost before a sales process. The relevant cost may extend beyond licenses to training, implementation, integration, model migration and adjacent ARGUS Intelligence Platform modules. Analysis: enterprise pricing can reasonably vary by users and scope, but the absence of public starting prices or a clear packaging matrix reduces buyer visibility. Procurement teams should request an itemized quote that separates Enterprise access, platform modules, data services, support, training and implementation. They should also clarify renewal increases, minimum commitments, environment charges and the treatment of occasional users. The score recognizes that quote based pricing is common in institutional software, while still penalizing the effort required to discover a realistic total cost.

    Support and Reliability: 8/10

    ARGUS Enterprise earns 8 for support. Altus publicly provides customer support channels, a support community, software downloads, guides, onboarding resources and access to support representatives. The product’s long presence in institutional CRE also means buyers can find experienced users and third party training in the broader market. Analysis: that ecosystem reduces implementation risk compared with a young specialist product, especially for firms hiring analysts who already know ARGUS. Support quality can still depend on contract level, region, issue complexity and the organization’s internal expertise. Altus does not publish comprehensive response and resolution performance for all customers. Buyers should negotiate severity definitions, response targets, escalation paths and migration assistance, then speak with comparable clients about actual service. Dedicated internal model ownership remains important because vendor support cannot decide a firm’s valuation policy or correct weak source data.

    Innovation and Roadmap: 8/10

    ARGUS Enterprise earns 8 for innovation, supported by ISO/IEC 42001 certification for its AI management systems and an ARGUS Assist agent layer trained on 30 years of proprietary CRE data. The core product’s value comes from mature CRE modeling rather than novelty, but Altus is extending it through the ARGUS Intelligence Platform, connected asset and portfolio capabilities and ARGUS Assist. The agent based direction could reduce the effort required to produce comparisons, forecasts and valuation analysis, particularly for users who lack deep technical knowledge. Analysis: this is a meaningful evolution of an established system, though buyers should separate announced capability from proven workflow improvement. AI generated results need traceable inputs, clear assumption changes and repeatable review controls before institutional teams can rely on them. The score therefore recognizes a credible product direction without treating the newer layer as fully validated across every asset class and operating environment. A controlled pilot should compare speed, error detection and reviewer effort against the existing Enterprise process.

    Market Reputation: 10/10

    ARGUS Enterprise earns 10 for market reputation. It is the de facto valuation model format in institutional commercial real estate and is recognized across investment, appraisal and lending workflows. That position lowers counterparty friction and gives buyers access to a broad labor pool familiar with the product. Altus Group is a publicly traded company on the Toronto Stock Exchange under the symbol AIF, providing more corporate visibility than a privately held early stage vendor. Analysis: reputation is a decisive advantage here because model acceptance can matter as much as interface preference. It should not prevent due diligence. Market position does not guarantee favorable pricing, easy implementation or correct analysis. Buyers should evaluate current product direction, contractual terms and support performance rather than purchasing solely because ARGUS is customary. Even with that qualification, no lower score would accurately reflect its standing in institutional CRE valuation.

    9AI Score Card ARGUS Enterprise
    77
    77 / 100
    Solid Platform
    CRE Valuation Software
    ARGUS Enterprise
    ARGUS Enterprise is the common institutional format for property cash flows, making model compatibility its strongest advantage and disciplined input review its central requirement.
    9 Dimensions, Scored 1 to 10
    1. CRE Relevance
    10/10
    2. Data Quality & Sources
    8/10
    3. Ease of Adoption
    6/10
    4. Output Accuracy
    8/10
    5. Integration & Workflow Fit
    7/10
    6. Pricing Transparency
    4/10
    7. Support & Reliability
    8/10
    8. Innovation & Roadmap
    8/10
    9. Market Reputation
    10/10
    BestCRE.com, 9AI Framework v2 Reviewed October 2026

    Who Should Use ARGUS Enterprise

    ARGUS Enterprise is best suited to institutional owners, investment managers, appraisal firms and lenders that model income-producing properties with material lease complexity. It is particularly compelling when transaction counterparties, valuation advisers or credit teams routinely request ARGUS files. Firms underwriting office, retail or industrial assets can benefit from modeling individual lease events, recoveries, tenant costs and market leasing assumptions inside a recognized framework. Larger teams can also gain from standardized templates, review procedures and a common model vocabulary across acquisitions, asset management and valuation.

    The strongest buyer has recurring valuation volume, trained analysts and a clear governance process. Portfolio owners considering the wider ARGUS Intelligence Platform should evaluate Enterprise alongside asset and portfolio aggregation rather than as an isolated desktop calculation tool. Analysis: the economic case improves when model compatibility saves repeated translation work, when detailed lease scenarios influence decisions, or when counterparties expect an ARGUS deliverable. Buyers should appoint an internal owner for templates, permissions, assumption standards and quality control. The product supports disciplined analysis, but it does not create that discipline by itself.

    Who Should Not Use ARGUS Enterprise

    Small owners with simple rent structures, limited transaction volume and no counterparty requirement for ARGUS files may find the product excessive. A controlled spreadsheet or lighter underwriting application can be easier to learn and cheaper to operate when the portfolio contains only a few straightforward assets. Teams seeking an automated valuation with minimal inputs should also look elsewhere. ARGUS Enterprise expects detailed assumptions and knowledgeable review, so it is poorly matched to buyers who cannot maintain reliable lease and operating data.

    It is also a weaker fit for organizations whose primary need is deal pipeline management, lease administration, property accounting or source document extraction. Those functions require surrounding systems or specialized products. Buyers wanting fully published self-service pricing will encounter friction because Altus does not publish standard Enterprise prices. Analysis: firms should not adopt ARGUS merely to signal institutional sophistication. If counterparties do not require its files and detailed lease modeling will not change decisions, the training, governance and integration burden may outweigh the benefit.

    Pricing and ROI Analysis

    Altus does not publish standard ARGUS Enterprise pricing on its public website. Prospective customers must request a quote, and the final commercial structure may depend on user count, modules, deployment scope, services and contract terms. Buyers should ask for a complete cost schedule covering licenses, ARGUS Intelligence Platform access, implementation, data migration, integrations, training, support and renewal terms. They should also confirm whether read-only, occasional and external users require separate entitlements. Without those details, a headline proposal cannot be compared reliably with alternatives.

    Analysis: use simple ROI math before buying. Add the annual software, implementation, training and internal administration costs, then divide that total by the fully loaded hourly cost of the analysts and reviewers who will use it. The result is the number of labor hours the product must save each year to break even. For example, if the verified annualized cost is C and the relevant hourly labor cost is H, required hours saved equal C divided by H. Then test whether reduced model translation, faster scenario work and fewer review corrections can credibly deliver those hours. Do not include speculative AI savings until a pilot demonstrates them on representative assets.

    Integration and CRE Tech Stack Fit

    ARGUS Enterprise fits most naturally between lease and property data sources on one side and investment reporting, valuation review and portfolio analysis on the other. Its practical advantage is the recognized model file that can move among owners, appraisers, lenders and transaction counterparties. Inside the Altus ecosystem, ARGUS Asset Manager and ARGUS Portfolio Manager are intended to connect property models with operational information and portfolio scenarios. Altus also offers integration services, but public information does not establish a universal connector catalog or standard implementation timeline.

    Buyers should map the required flow field by field before signing. Confirm how property and tenant identifiers are matched, which system owns actuals, how lease changes enter the model and whether updates are one-way or bidirectional. Test exports, permissions, failed records and audit evidence using real assets. Analysis: file compatibility makes ARGUS valuable in a fragmented CRE stack, but file exchange should not be mistaken for automated data governance. Firms pursuing the broader Intelligence Platform should also confirm how existing Enterprise models, templates and approvals behave after migration.

    Competitive Landscape

    Rockport VAL is the closest direct alternative for appraisal and valuation teams that want detailed property modeling with a different workflow and technology environment. redIQ is particularly relevant for multifamily acquisitions and data standardization, where extracting and normalizing operating information may matter more than producing the conventional institutional ARGUS file. Dealpath is a stronger choice when the central problem is deal pipeline, approvals and investment management workflow rather than lease level cash flow modeling. Pereview Software competes more directly around asset and portfolio management, reporting and data control.

    Analysis: ARGUS Enterprise wins when counterparties expect its file format, when lease detail drives value and when a firm wants access to the deepest established user ecosystem. Rockport VAL deserves a serious trial when appraisal production and usability are the priority. redIQ can be more appropriate for multifamily teams focused on rent rolls and operating statements. Dealpath or Pereview may sit alongside ARGUS rather than replace it because they address different layers of the investment process.

    Buyers should run the same properties through shortlisted products and score setup time, assumption visibility, scenario speed, reviewer effort, export fidelity and total cost. The decisive question is whether the organization needs an accepted valuation model, a workflow system, a portfolio data layer or some combination. Purchasing a category leader does not eliminate the need to define that requirement.

    The Bottom Line

    Choose ARGUS Enterprise when detailed lease based valuation and institutional model compatibility are essential. Its position as the common exchange format can justify the training and governance burden for active investors, appraisers and lenders. Require a pilot that uses representative assets, includes junior and senior reviewers, and tests file exchange with real counterparties. The purchase decision should rest on reduced translation work, repeatable modeling and defensible review, not simply on market convention.

    Do not sign until Altus provides an itemized total cost, a migration plan and a clear account of which Enterprise, Intelligence Platform and ARGUS Assist capabilities are included. Analysis: ARGUS remains the safest operational choice for many institutional valuation teams, but it is not automatically the best economic choice for smaller or simpler portfolios. Treat the AI layer as a separately tested enhancement, while treating the established cash flow engine and format compatibility as the proven core.

    About BestCRE

    BestCRE.com is the definitive authority on commercial real estate AI, analysis, and investment intelligence. Every article advances the platform’s mission to help CRE professionals identify, evaluate, and adopt the best tools and strategies in the industry. We benchmark platforms using the 9AI Framework so CRE leaders can compare tools with clear evidence. Explore the category map at 20 CRE sectors for deeper coverage across the CRE stack.

    Frequently Asked Questions

    What is ARGUS Enterprise used for in commercial real estate?

    ARGUS Enterprise is commercial real estate software for forecasting property cash flows and estimating value. Institutional investors, asset managers, appraisers and lenders use it to model leases, rent changes, recoveries, operating expenses, capital costs, market leasing assumptions and exit scenarios. It is particularly useful for multitenant income-producing properties where individual lease expirations and renewal assumptions can materially change projected performance. The software converts those inputs into period level forecasts and discounted cash flow outputs that analysts can review and revise. Analysis: its defining advantage is not merely calculation capability, which spreadsheets and other products can provide. It is the institutional familiarity of the ARGUS model format, which allows property analyses to move among buyers, sellers, appraisers and lenders with less translation.

    How does ARGUS Enterprise compare with Excel and other valuation software?

    ARGUS Enterprise provides a purpose-built structure for CRE leases, recoveries, market leasing and property valuation, while Excel offers greater flexibility but requires teams to design and maintain their own logic and controls. ARGUS can make complex lease events more consistent and easier for experienced counterparties to inspect. Excel may remain sufficient for simple assets or custom analyses. Rockport VAL is a direct valuation alternative, while redIQ emphasizes multifamily data workflows. Dealpath and Pereview address broader deal or asset management needs and may complement rather than replace ARGUS. Analysis: choose based on the workflow bottleneck. ARGUS is strongest when counterparties expect its files and lease detail drives value. A comparative pilot should measure setup time, error detection, scenario work, reviewer effort and export fidelity.

    How much does ARGUS Enterprise cost?

    Altus does not publish standard ARGUS Enterprise prices on its public website. Buyers must request a quote, and the total cost may include licenses, platform modules, implementation, migration, integrations, training and support. Ask for each component separately, along with minimum commitments, renewal terms and rules for occasional or read-only users. Analysis: calculate break-even effort by dividing the annualized total cost by the fully loaded hourly cost of the employees who build and review models. That produces the number of labor hours the organization must save each year. Test whether faster scenario analysis, less model translation and fewer review corrections can realistically supply those hours. Do not count anticipated savings from ARGUS Assist until a controlled pilot verifies them on the buyer’s own properties.

    Who should use ARGUS Enterprise?

    ARGUS Enterprise best suits institutional property owners, investment managers, appraisal firms and lenders that repeatedly value income-producing commercial assets. It is especially relevant for office, retail and industrial portfolios with multiple leases, recovery structures, renewal scenarios and material tenant costs. Organizations that regularly exchange models with transaction counterparties or valuation advisers gain additional value from the recognized ARGUS file format. The ideal customer has trained analysts, reliable lease data and formal review controls. Small owners with a handful of simple assets may not need the product’s depth. It is also not a substitute for deal pipeline management, property accounting, lease administration or document extraction. Analysis: the purchase is justified when detailed property modeling and counterparty compatibility materially improve decisions or reduce recurring translation work.

    Will ARGUS Assist change how teams use ARGUS Enterprise?

    ARGUS Assist could make ARGUS workflows faster by letting users generate valuations, forecasts and comparisons through specialized AI agents within the ARGUS Intelligence Platform. The likely value is reduced navigation and analysis time, especially when users need to compare scenarios across models or portfolios. The important question is not whether the assistant can produce an answer, but whether reviewers can trace its inputs, assumption changes and calculation path. Analysis: institutional teams should introduce it through a controlled process with approved use cases, representative assets and human signoff. Compare its outputs with the existing Enterprise workflow, record corrections and measure reviewer time. Altus does not publish enough product level evidence to assume uniform accuracy or savings across all property types. The established Enterprise engine should remain the control point until testing supports broader use.

    Related Reviews

    Compare ARGUS Enterprise with other Valuation & Appraisal tools BestCRE has scored: V7 Go (73/100), Hover (71/100), Valuebase (70/100) and Bowery Valuation (69/100). Browse every review in CRE Valuation & Appraisal, the full Best CRE AI Tools directory, or the 20 CRE Sectors hub.

  • Terrakotta.ai Review: AI-powered site feasibility and design-planning insights for commercial developers.

    Terrakotta.ai Review: AI-powered site feasibility and design-planning insights for commercial developers.

    BestCRE 9AI Score

    71/100 · Contender

    Terrakotta.ai ranks #214 of 450 commercial real estate AI tools scored on the 9AI Framework. Nine dimensions, each scored out of 10: CRE relevance, data quality, ease of adoption, output accuracy, integration fit, pricing transparency, support, innovation and market reputation.

    Terrakotta.ai is an artificial intelligence platform built specifically for commercial real estate, with a primary use case focused on AI for site feasibility and design-planning insights. Founded by a team with roots in Y Combinator’s W24 batch, the company has positioned itself as a Tier 2, CRE-native database solution that aims to accelerate early-stage deal analysis. In the highly competitive landscape of underwriting software, principal investors and development analysts constantly seek tools that can synthesize zoning codes, parcel data, and construction viability without requiring weeks of manual research. Terrakotta attempts to solve this exact bottleneck by applying machine learning models to public records and spatial data, allowing users to evaluate potential development sites quickly.

    Evaluating Terrakotta requires looking past the standard startup marketing to understand its actual utility for institutional and mid-market firms. As of March 2026, the platform operates on a paid model, though exact pricing details remain unpublished, which immediately introduces a hurdle for teams needing transparent procurement processes. While peers like Cotality and HelloData have established themselves with scores in the low 90s by offering highly transparent, proven platforms, Terrakotta is still building its track record. The software promises to automate the extraction of critical site constraints and design parameters, turning raw municipal data into actionable feasibility reports. For a development shop attempting to underwrite dozens of parcels a week, this capability could significantly reduce initial diligence costs. However, because the company is a relatively unproven startup, prospective buyers must carefully weigh the platform’s innovative approach against the inherent risks of adopting early-stage technology for critical underwriting tasks.

    What Terrakotta.ai does and how it works

    Terrakotta functions as an automated diligence engine that evaluates commercial parcels for development viability and design constraints. Users begin by utilizing the platform’s map-based polygon selection tool or by inputting specific property addresses. Once a site is identified, the software deploys AI agents to scrape and synthesize data from municipal zoning codes, tax records, and public GIS databases. Instead of an analyst spending hours reading through local ordinances to determine setback requirements, floor area ratios, and height limits, Terrakotta aggregates these parameters into a centralized dashboard. The system then cross-references these regulatory constraints with physical site characteristics to generate preliminary feasibility models.

    Beyond basic zoning extraction, the platform incorporates design-planning insights by simulating potential massing and layout options. The AI engine processes the gathered constraints and provides visual or quantitative estimates of how much buildable square footage a specific parcel can support. This includes analyzing variables such as parking requirements, environmental overlays, and historical district restrictions. By automating the compilation of these disparate data points, the software allows acquisitions teams to immediately filter out sites that do not meet their specific investment mandates. The output is typically a standardized feasibility report that analysts can export and incorporate into their broader underwriting models.

    The mechanics of the platform rely heavily on its ability to parse unstructured public data using natural language processing. When a local municipality updates its zoning text, Terrakotta’s models attempt to interpret the new rules and apply them to the site analysis. Users can adjust certain assumptions within the interface, testing different development scenarios such as multifamily versus mixed-use to see how the regulatory constraints shift. While the tool handles the heavy lifting of data aggregation, it is designed to supplement rather than replace the judgment of a trained architect or development professional, serving primarily as a top-of-funnel filter for site selection.

    9AI Framework: the score, dimension by dimension

    Dimension Score
    CRE Relevance 9/10
    Data Quality and Sources 8/10
    Ease of Adoption 8/10
    Output Accuracy 8/10
    Integration and Workflow Fit 7/10
    Pricing Transparency 4/10
    Support and Reliability 6/10
    Innovation and Roadmap 8/10
    Market Reputation 6/10
    Composite 9AI Score 71/100

    CRE Relevance: 9/10

    Terrakotta is explicitly designed for the commercial real estate sector, earning its classification as a CRE-native database. The platform ignores residential or general-purpose data scraping in favor of hyper-specific commercial zoning codes, parcel boundaries, and development constraints. Its architecture reflects a deep understanding of what acquisitions teams and developers actually need during the initial stages of site selection. By focusing strictly on site feasibility and design-planning insights, the tool aligns perfectly with the daily workflows of commercial dealmakers. The developers have clearly prioritized industry-specific terminology and metrics, ensuring that the interface speaks the language of commercial underwriting rather than generic data analysis. In practice: Development analysts will find the platform’s focus on floor area ratios and setback constraints immediately applicable to their daily pipeline evaluations.

    Data Quality and Sources: 8/10

    The accuracy of any feasibility tool depends entirely on the underlying data, and Terrakotta pulls from a vast array of public municipal databases and GIS systems. The platform generally succeeds in aggregating complex zoning texts and parcel dimensions, though the inherent inconsistencies in local government data can occasionally introduce errors. Because it relies on machine learning to interpret unstructured ordinances, the quality of the output is heavily dependent on the specific market being analyzed. Tier 1 cities with digitized records yield highly reliable insights, whereas secondary markets with outdated municipal websites may produce less dependable results. The AI models are trained to flag ambiguous regulatory language, prompting the user to verify the information manually. In practice: Users must still spot-check the AI-generated zoning summaries against primary municipal sources before making binding financial commitments.

    Ease of Adoption: 8/10

    Implementing Terrakotta requires minimal technical expertise, as the cloud-based interface is designed to be intuitive for non-technical real estate professionals. New users can typically navigate the map-based selection tools and generate their first feasibility reports within a few hours of logging in. The platform avoids overly complex configuration screens, opting instead for a straightforward workflow that guides the user from site selection to final output. However, teams will need to invest some time in understanding how the AI interprets specific local codes, and training staff to recognize the tool’s limitations is essential. The onboarding process is generally straightforward, though the lack of extensive documentation for edge cases can occasionally frustrate power users. In practice: An associate or analyst can start running preliminary site evaluations on their first day of using the software.

    Output Accuracy: 8/10

    When evaluating standard development parcels in major metropolitan areas, Terrakotta delivers highly precise feasibility metrics and design parameters. The natural language processing engine excels at extracting explicit numerical constraints like height limits and parking ratios from zoning documents. However, the accuracy can degrade when dealing with highly nuanced overlay districts, subjective architectural review board guidelines, or conflicting municipal statutes. The software is intelligent enough to provide confidence scores for its extracted data, which helps analysts gauge how much manual verification is required. While it significantly reduces the margin of error associated with manual data entry, it is not infallible. In practice: The generated feasibility reports serve as an excellent baseline for underwriting but require a final review by a seasoned development professional to ensure complete accuracy.

    Integration and Workflow Fit: 7/10

    Terrakotta offers a reasonable degree of compatibility with the standard commercial real estate technology stack, though it lacks the deep, native connections found in more mature platforms. Users can export feasibility data and massing insights into standard formats like CSV or PDF, making it relatively simple to pull the numbers into Excel-based underwriting models. The platform provides basic API access for enterprise clients who wish to connect the site analysis directly into their proprietary CRM or deal management systems. However, it does not currently offer out-of-the-box integrations with major industry software like Argus or Yardi, which means some manual data transfer is still necessary for complex financial modeling. In practice: Analysts will primarily use the tool as a standalone research environment, exporting the final metrics into their existing Excel templates.

    Pricing Transparency: 4/10

    Procuring software for a commercial real estate firm requires clear financial expectations, and Terrakotta falls short in this critical area. As of Q1 2026, the company operates on a paid model but does not publish its pricing tiers, subscription costs, or implementation fees on its website. Prospective buyers must engage directly with the sales team to receive a custom quote, a process that adds unnecessary friction to the evaluation phase. This opaque approach makes it difficult for mid-sized firms to determine if the platform fits within their annual technology budgets before committing to demonstrations. Compared to industry peers that openly list their licensing costs, this lack of clarity is a significant drawback. In practice: Decision-makers must initiate a formal sales process simply to discover if the tool is financially viable for their organization.

    Support and Reliability: 6/10

    As a relatively unproven startup, Terrakotta’s support infrastructure is still maturing and lacks the extensive resources of established enterprise vendors. Users generally interact directly with the founding team or a small group of customer success managers when issues arise. While this can result in highly personalized and enthusiastic assistance, it also means that response times may vary significantly depending on the team’s current workload. The platform does not currently offer 24/7 global support or dedicated technical account managers for standard tier clients. The knowledge base and self-serve documentation are adequate for basic troubleshooting but often lack detailed guidance for complex zoning interpretation errors. In practice: Users should expect dedicated but occasionally delayed support, typical of an early-stage company scaling its operations.

    Innovation and Roadmap: 8/10

    The development trajectory for Terrakotta is highly promising, driven by a nimble engineering team that frequently pushes updates to the core AI engine. The company has clearly outlined its intentions to expand its coverage of municipal databases and improve the sophistication of its design-planning algorithms. Recent updates have focused on enhancing the natural language models to better understand obscure zoning variances and historical preservation constraints. The founders actively solicit feedback from early adopters, and user-requested features often appear in the platform within a matter of weeks. This rapid iteration cycle suggests that the tool will continue to evolve and capture more complex aspects of site feasibility. In practice: Early adopters will benefit from a rapidly improving feature set and the ability to influence the product’s future development direction.

    Market Reputation: 6/10

    Terrakotta is currently navigating the challenging transition from a promising Y Combinator startup to a recognized staple in the commercial real estate technology ecosystem. Within early-adopter circles, the platform is viewed as an intriguing solution to the tedious process of site feasibility analysis. However, among institutional investors and large-scale developers, the brand remains largely unknown. The company has not yet accumulated the critical mass of public case studies, enterprise deployments, or third-party validations required to achieve a top-tier reputation. While the initial feedback from current users is generally positive regarding the core technology, the broader market remains cautiously optimistic but hesitant to fully commit. In practice: Buyers are investing in the potential of the technology and the vision of the founders rather than a long-established track record of enterprise success.

    Who should use Terrakotta.ai

    Terrakotta is best suited for teams that spend excessive amounts of time manually researching municipal codes and evaluating raw land or redevelopment sites.

    Development Analysts: Professionals tasked with screening dozens of parcels weekly will benefit immensely from the automated extraction of zoning constraints and buildable area estimates.

    Land Acquisitions Managers: Teams focused on sourcing off-market development opportunities can use the platform to quickly disqualify sites that fail to meet strict regulatory or physical parameters.

    Urban Planners and Architects: Early-stage design professionals can utilize the tool to generate baseline feasibility reports before committing significant billable hours to a prospective project.

    Mid-Market Development Firms: Companies lacking the budget for a massive dedicated research team can use the AI to punch above their weight in site selection efficiency.

    Who should look elsewhere

    Despite its capabilities in site analysis, Terrakotta is not a universal solution for all commercial real estate professionals, particularly those focused on stabilized assets.

    Core-Plus and Value-Add Investors: Teams acquiring existing, fully stabilized properties will find little use for a tool dedicated to ground-up development feasibility and zoning constraints.

    Institutional Debt Funds: Lenders focused on cash flow analysis and debt service coverage ratios will not benefit from design-planning insights or massing simulations.

    Property Managers: Professionals handling the day-to-day operations of existing buildings have no operational need for site selection or municipal code extraction software.

    Firms Requiring Proven Enterprise Software: Organizations with strict procurement guidelines mandating long-established vendors will struggle to approve an unproven startup without published pricing.

    Pricing and ROI

    Evaluating the financial commitment required for Terrakotta is challenging because the vendor does not publish its pricing on its public website. As of Q1 2026, prospective buyers must engage in a direct sales consultation to receive a custom quote tailored to their specific market coverage and user headcount. This lack of pricing transparency is typical for early-stage enterprise software but remains a frustrating hurdle for analysts attempting to budget for new underwriting tools. Without transparent tiers, firms cannot easily compare the cost against established peers like Cotality or HelloData without investing time in discovery calls.

    Despite the hidden costs, the ROI math for a development shop can be compelling if the software performs as advertised. Consider an acquisitions team where a junior analyst spends approximately 15 hours per week manually reading zoning codes, cross-referencing parcel maps, and building preliminary feasibility models for potential sites. At a fully loaded cost of $65 per hour, this manual research costs the firm roughly $3,900 per month. If Terrakotta can automate 70% of this top-of-funnel diligence, it effectively returns over 40 hours of analyst capacity per month, equating to nearly $2,700 in saved labor costs. If the custom subscription price falls below this threshold, the platform pays for itself purely in reclaimed human capital, allowing the team to underwrite a higher volume of deals.

    Integration and CRE tech stack fit

    In the context of a modern commercial real estate tech stack, Terrakotta functions primarily as an independent research application rather than a deeply embedded core system. The platform does not offer native, plug-and-play integrations with heavyweight financial modeling tools like Argus Enterprise or comprehensive property management systems like Yardi Voyager. Instead, it relies on standard data export functionalities, allowing users to download feasibility metrics, zoning summaries, and design parameters into CSV or PDF formats. This means analysts will still need to manually input the AI-generated constraints into their proprietary Excel underwriting models to complete their financial projections.

    For firms utilizing modern CRM platforms like Salesforce or Dealpath to manage their acquisition pipelines, Terrakotta provides basic API access. This allows technical teams to build custom webhooks that push site feasibility summaries directly into a deal record. However, setting up these connections requires internal IT resources. Ultimately, the software sits at the very top of the technology funnel, operating as a standalone environment where initial site selection occurs before the surviving deals are manually transitioned into the firm’s primary underwriting and deal management software.

    Competitive landscape

    The market for AI-driven commercial real estate analysis is expanding rapidly, and Terrakotta faces stiff competition from several highly rated platforms. When evaluating site feasibility and underwriting tools, buyers must consider established alternatives that offer different strengths. Cotality (BestCRE Score: 91) and HelloData (BestCRE Score: 91) represent the top tier of the market. Cotality provides exceptionally transparent pricing and a highly reliable data infrastructure that appeals to institutional investors, while HelloData excels in automated document extraction and market data aggregation. Both offer a more proven track record than Terrakotta.

    CompStak (BestCRE Score: 88) remains a dominant force for teams needing granular lease and sales comp data rather than pure zoning and feasibility analysis. If a firm’s primary bottleneck is determining market rents rather than buildable square footage, CompStak is the superior choice. Cherre (BestCRE Score: 86) offers a massive, interconnected data warehouse approach, making it ideal for enterprise organizations with heavy data engineering needs, though it requires significantly more technical expertise to implement than Terrakotta’s out-of-the-box interface.

    For firms interested in predictive analytics, Akkio (BestCRE Score: 86) and RETS AI (BestCRE Score: 86) provide powerful machine learning capabilities. Akkio allows users to build custom prediction models without writing code, which is excellent for forecasting market trends but lacks Terrakotta’s specific focus on municipal zoning codes and design-planning insights. Ultimately, Terrakotta differentiates itself by hyper-focusing on the physical and regulatory constraints of development sites, whereas its peers generally focus on financial comps, market data, or general-purpose predictive modeling.

    The bottom line

    Terrakotta is a highly specialized, early-stage tool that solves a very specific problem for a very specific user. If your firm focuses on ground-up development and your analysts are drowning in municipal zoning codes and parcel maps, this platform is worth the friction of a direct sales process. The ability to instantly generate site feasibility constraints using AI can significantly increase the volume of deals your team can screen. However, you must accept the realities of adopting software from an unproven startup: pricing is opaque, support will be highly personalized but potentially inconsistent, and the AI will occasionally misinterpret complex local ordinances. For value-add investors or firms demanding established enterprise reliability, the platform is too immature and narrowly focused to justify the investment. Commit to Terrakotta only if you are willing to trade the safety of a legacy vendor for the speed of an aggressive, single-purpose AI diligence engine.

    Frequently asked questions

    Does Terrakotta integrate directly with Argus Enterprise?

    No, the platform does not currently offer a native integration with Argus Enterprise. Users must export their site feasibility data and design-planning metrics into standard formats like CSV, and then manually input those constraints into their Argus or Excel-based financial models.

    How much does Terrakotta cost for a small acquisitions team?

    The company does not publish its pricing tiers publicly. Prospective buyers must contact their sales department to receive a custom quote based on market coverage and the number of user licenses required. You cannot purchase a subscription directly through their website.

    Can Terrakotta analyze residential single-family housing markets?

    The platform is specifically classified as a CRE-native database and focuses entirely on commercial real estate. It is designed to analyze commercial zoning codes, multifamily development constraints, and mixed-use site feasibility rather than individual single-family home valuations or residential flipping metrics.

    How accurate is the AI when reading local zoning codes?

    The natural language processing models are highly accurate for standard numerical constraints like floor area ratios and height limits in major metropolitan areas. However, analysts must manually verify the data when dealing with complex overlay districts, subjective design guidelines, or outdated municipal records.

    Is Terrakotta suitable for core-plus or stabilized asset investors?

    No. The software is built specifically for site feasibility and design-planning insights, making it valuable for ground-up developers and land acquisitions teams. Investors focused on acquiring fully stabilized, cash-flowing properties will not find the zoning and massing features useful for their underwriting.

    Does the platform offer an API for custom CRM connections?

    Yes, the software provides basic API access for enterprise clients. This allows technical teams to build custom connections to push site feasibility reports and zoning data directly into modern deal management platforms like Dealpath or Salesforce, though it requires internal IT resources to configure.

    Related Reviews

    Compare Terrakotta.ai with other Underwriting & Deal Analysis tools BestCRE has scored: Crexi (78/100), redIQ (71/100), Sytes CRE (68/100) and AgentiCRE (64/100). Browse every review in CRE Underwriting & Deal Analysis, the full Best CRE AI Tools directory, or the 20 CRE Sectors hub.
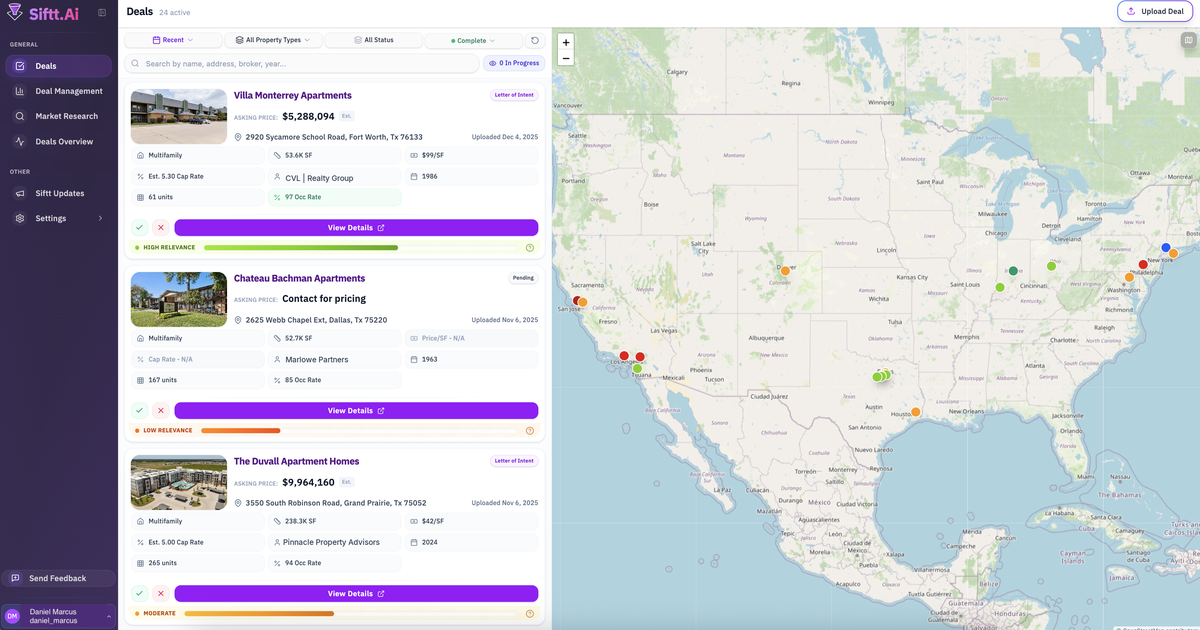
  • Sytes CRE Review: AI-driven tenant expansion marketplace and site submission portal for commercial real estate

    Sytes CRE Review: AI-driven tenant expansion marketplace and site submission portal for commercial real estate

    BestCRE 9AI Score

    68/100 · Niche

    Sytes CRE ranks #359 of 584 commercial real estate AI tools scored on the 9AI Framework. Nine dimensions, each scored out of 10: CRE relevance, data quality, ease of adoption, output accuracy, integration fit, pricing transparency, support, innovation and market reputation.

    Sytes CRE operates as a tenant expansion marketplace equipped with AI site submission portals, categorized within the BestCRE master database as a Tier 2 CRE-native application. In the commercial real estate underwriting and deal analysis sector, the friction of matching expanding retail or industrial tenants with viable sites remains a highly manual process. Brokers and principals traditionally rely on fragmented email threads, static PDF flyers, and disconnected spreadsheets to evaluate potential locations against specific tenant requirements. Sytes CRE attempts to centralize this workflow by providing a dedicated environment where site submissions are ingested, parsed, and evaluated automatically against predefined tenant criteria.

    Our analysis indicates that this platform is primarily built to serve tenant representation brokers, in-house real estate teams for expanding brands, and landlords seeking to pitch their available spaces directly to active requirements. By deploying artificial intelligence to read and categorize inbound site submissions, the software reduces the administrative burden of initial deal screening. However, as a Tier 2 solution with annual paid plans, prospective buyers must evaluate whether the volume of their expansion requirements justifies the implementation of a specialized portal. The platform competes in a crowded ecosystem of deal analysis tools, though it carves out a specific niche by focusing strictly on the site submission and tenant expansion use case rather than general property underwriting. For teams managing high-velocity rollouts in August 2026, the utility of a centralized intake system is clear, provided the execution matches the premise.

    What Sytes CRE does and how it works

    Sytes CRE functions primarily as an inbound funnel for commercial real estate site selection, replacing the traditional email inbox with a structured, AI-assisted portal. When a tenant or their broker has an active market requirement, they generate a unique submission link through the platform. This link is distributed to the brokerage community, landlords, and developers, directing them to a standardized intake form. Instead of manually extracting data from attached marketing brochures, the system uses natural language processing to parse uploaded documents, extracting key variables such as square footage, clear height, zoning, asking rent, and co-tenancy details.

    Once the data is ingested, the platform acts as a matching engine. The software compares the extracted site attributes against the tenant’s hard and soft requirements, assigning a preliminary fit score to each submission. This allows the real estate committee or lead broker to filter out non-compliant sites instantly, focusing their underwriting efforts only on locations that meet the baseline criteria. The dashboard provides a Kanban-style view of the pipeline, where users can track the status of each site from initial review through to lease negotiation and committee approval.

    Furthermore, the platform serves as a centralized communication hub. Users can request additional information, schedule tours, and share feedback with the submitting parties directly within the interface. Our analysis shows that this reduces the likelihood of lost information and creates a permanent audit trail for every rejected or advanced site. While it does not perform deep financial modeling or complex cash flow analysis, its mechanical focus is on accelerating the top-of-funnel deal flow for tenant expansion, ensuring that viable opportunities are identified and actioned before competitors can secure them.

    9AI Framework: the score, dimension by dimension

    Dimension Score
    CRE Relevance 9/10
    Data Quality and Sources 6/10
    Ease of Adoption 8/10
    Output Accuracy 7/10
    Integration and Workflow Fit 6/10
    Pricing Transparency 7/10
    Support and Reliability 6/10
    Innovation and Roadmap 7/10
    Market Reputation 5/10
    Composite 9AI Score 68/100

    CRE Relevance: 9/10

    Sytes CRE is entirely dedicated to the commercial real estate sector, specifically targeting the nuanced workflow of tenant site selection. Unlike generic project management or form-building software, the platform’s data models are built around industry-standard metrics such as triple net leases, tenant improvement allowances, and specific zoning classifications. The AI models are trained to recognize standard CRE marketing collateral, meaning they can accurately identify property types and lease terms without requiring extensive user configuration. This deep vertical focus ensures that the tool speaks the language of brokers and real estate directors immediately upon deployment. In practice: Users will find that the platform requires minimal customization to handle standard retail, industrial, or office site submissions.

    Data Quality and Sources: 6/10

    As a marketplace and submission portal, the platform’s data quality is inherently dependent on the inputs provided by third-party submitters. However, the software employs validation checks and AI parsing to standardize this inbound information, reducing the formatting inconsistencies typically found in broker marketing packages. Our analysis notes that while the AI accurately extracts explicit data points like asking rent or square footage, it may struggle with nuanced lease stipulations hidden in complex brochures. The system does not appear to enrich submissions with external, proprietary market data, meaning users must rely strictly on the provided materials, and Sytes publishes no extraction accuracy figures, which holds this score at 6. In practice: Analysts must still manually verify critical lease terms extracted by the AI before presenting a site to the real estate committee.

    Ease of Adoption: 8/10

    The platform is designed for immediate utility, relying on a web-based portal architecture that requires no local installation. For the primary user, the tenant rep or real estate director, setting up a requirement page and generating a submission link takes only minutes. The true test of adoption lies with the external brokers and landlords who must use the portal to submit sites. Because the interface mimics familiar web forms and allows for simple drag-and-drop document uploads, friction for external users is kept to a minimum. Training requirements for internal staff are low, as the dashboard relies on standard pipeline management visuals. In practice: Teams can deploy the software and begin receiving structured site submissions within a single business day.

    Output Accuracy: 7/10

    The core output of Sytes CRE is the parsed data extracted from marketing flyers and the resulting match scores against tenant criteria. Based on standard optical character recognition and natural language processing capabilities, the extraction of structured data such as numbers and addresses is highly reliable. However, accuracy decreases when dealing with unstructured, highly stylized marketing PDFs where critical information is embedded in graphics or unconventional layouts. The match scoring logic is deterministic and reliable, provided the underlying data was extracted correctly. Users must treat the AI extraction as a first pass rather than an infallible record. In practice: Deal teams should expect a high success rate on basic site metrics but will need to correct misread qualitative data occasionally.

    Integration and Workflow Fit: 6/10

    As a Tier 2 application, Sytes CRE currently operates largely as a standalone portal rather than a deeply integrated component of a broader enterprise tech stack. While it successfully centralizes the site submission process, our analysis indicates limited native integrations with major CRE underwriting platforms like Argus or enterprise CRM systems like Salesforce. Users looking to move a qualified site from the Sytes pipeline into a complex financial model will likely need to rely on manual data exports or flat file transfers. The lack of published API documentation suggests that custom integrations will require significant internal development resources. In practice: The tool functions best as an isolated top-of-funnel filter rather than an interconnected node in a fully automated underwriting workflow.

    Pricing Transparency: 7/10

    Sytes CRE publishes its tenant plan pricing, with a free Tenant tier, Pro 7 at $499 per month and Pro 15 at $999 per month, each billed on an annual contract, while enterprise and national agreements are quoted per organization. Tenants can read baseline costs on the pricing page, and only enterprise and national buyers need a sales conversation. Annual prepayment, the absence of a trial period, and quote-only enterprise terms keep this score at 7 rather than higher. The published tenant plans differ mainly by seat count, with 7 user seats on Pro 7 and 15 user seats plus 15 view-only partner accounts on Pro 15. In practice: Buyers can budget from the published plans and should still ask how costs will scale as their expansion pipeline grows.

    Support and Reliability: 6/10

    Categorized as a Tier 2 startup within the BestCRE database, Sytes CRE carries the standard risks associated with emerging software vendors. While early-stage companies often provide highly responsive, white-glove support to their initial client base, their capacity to maintain this level of service at scale remains unproven. There are no published service level agreements regarding uptime or guaranteed response times for technical issues. Users relying on the platform for time-sensitive site acquisitions must weigh the risk of potential portal downtime against the efficiency gains. The lack of a broad, established user community also limits peer-to-peer troubleshooting options. In practice: Early adopters should secure explicit support commitments and dedicated account management clauses during their contract negotiations.

    Innovation and Roadmap: 7/10

    The application of AI to inbound site submissions represents a logical and highly practical evolution of CRE technology. Sytes CRE is positioned well to expand its capabilities, potentially moving from simple data extraction to predictive analytics regarding site success based on historical performance. While their current roadmap is not publicly detailed, the foundational architecture of a structured marketplace allows for future integrations with demographic data providers or automated preliminary underwriting modules. The focus on solving a specific, painful workflow rather than building a generic AI wrapper indicates a disciplined product strategy. In practice: Clients can expect incremental improvements to the AI parsing engine and deeper filtering capabilities as the platform matures.

    Market Reputation: 5/10

    As an unproven startup in the highly competitive CRE tech landscape, Sytes CRE is still building its brand equity. It does not yet possess the widespread name recognition of established data providers or enterprise software suites. However, within the specific niche of tenant representation and retail expansion, tools that effectively reduce administrative overhead are quickly gaining traction. The company’s reputation will ultimately hinge on its ability to deliver accurate AI parsing consistently and convince the broader brokerage community to adopt its submission portals over traditional email. Currently, independent verified reviews are sparse. In practice: Buyers are investing in the product’s immediate utility rather than relying on the vendor’s established track record or long-term market dominance.

    Who should use Sytes CRE

    Sytes CRE serves a specific segment of the commercial real estate market focused on volume and velocity. The platform is best suited for teams that suffer from inbox fatigue and struggle to standardize the data they receive from external brokers.

    In-house Real Estate Directors: Corporate teams managing aggressive national rollouts for retail, fast-casual dining, or medical concepts who need to process hundreds of site submissions monthly.

    Tenant Representation Brokers: Advisory teams handling multiple active mandates that require a professional, branded intake process to filter noise and focus on viable locations.

    Franchise Development Teams: Organizations that need a centralized repository to evaluate sites submitted by regional franchisees against corporate brand standards.

    Who should look elsewhere

    Because the software is highly specialized for the site submission workflow, it lacks the broader functionality required by other real estate disciplines. Teams looking for deep financial modeling or proprietary market data will find the platform insufficient.

    Investment Sales Brokers: Professionals focused on disposition and capital markets who require complex cash flow analysis and buyer matching rather than tenant site selection.

    Acquisition Analysts: Institutional investors underwriting value-add multifamily or office assets, as the tool does not provide Argus-style financial projections.

    General Practice Appraisers: Valuation professionals who need access to verified lease comparables and historical sales data, which this platform does not supply.

    Pricing and ROI

    Sytes CRE publishes tenant plan pricing, starting with a free Tenant tier and paid Pro plans at $499 and $999 per month on annual contracts. Our analysis indicates that software in this Tier 2 tenant expansion category typically charges either an annual platform fee based on the number of active requirements or a per-seat license for internal users. Because enterprise and national agreements are quoted per organization, larger buyers must engage directly with the sales team to determine the financial commitment.

    When calculating the return on investment, buyers should focus on the administrative hours saved during the initial site screening phase. If a junior analyst earns $85,000 annually and spends twenty hours a week manually extracting data from PDF flyers into a pipeline spreadsheet, the hard cost of that manual labor is approximately $42,500 per year. If Sytes CRE can automate eighty percent of that extraction and filtering process, the platform yields over $34,000 in recovered productivity. This time can be redirected toward deeper underwriting on qualified sites or negotiating lease terms. To justify the software expense, the custom annual fee must fall significantly below this recovered labor cost, while also factoring in the soft benefits of faster response times and a reduced risk of missing a prime location due to inbox clutter.

    Integration and CRE tech stack fit

    In the context of a modern commercial real estate technology stack, Sytes CRE functions primarily as an isolated, top-of-funnel application. Our analysis reveals that the platform currently lacks a deep ecosystem of native API connections to industry-standard tools. For teams utilizing advanced underwriting software, the transition of data from a Sytes CRE submission into a financial model will likely require manual export via CSV or Excel formats.

    Similarly, integration with enterprise customer relationship management systems is limited. While the platform manages the lifecycle of a site submission internally, syncing that progress back to a master database requires workarounds. Buyers should anticipate using the software as a standalone portal where the initial screening occurs, before migrating the surviving deals into their primary underwriting or project management environments. For organizations with dedicated IT resources, custom integrations might be achievable, but the lack of published developer documentation means this will require a bespoke effort. The platform fits best in a stack where the site selection team operates somewhat independently from the broader corporate accounting or capital markets infrastructure.

    Competitive landscape

    The landscape for commercial real estate underwriting and deal analysis is dense, though Sytes CRE occupies a distinct niche by focusing heavily on the tenant expansion and site submission workflow. When evaluating this platform, buyers must consider how it stacks up against broader AI and data tools already scored by BestCRE.

    For teams heavily focused on data extraction and AI-driven underwriting, HelloData (Scored 91) offers a more comprehensive suite of tools for extracting insights from appraisals and offering memorandums, making it a stronger choice for acquisition teams. Cotality (Scored 91) provides exceptional workflow automation and data structuring, often serving as a more integrated solution for enterprise brokerages compared to Sytes CRE’s standalone portal approach.

    If the primary goal is accessing verified market data rather than just processing inbound submissions, CompStak (Scored 88) remains the superior choice for lease comparables and market analytics. Cherre (Scored 86) excels in enterprise data connection, offering the deep integration capabilities that Sytes CRE currently lacks. For organizations looking to build custom predictive models on top of their deal flow, Akkio (Scored 86) provides a flexible, no-code AI environment that outpaces the deterministic matching engine found here. Finally, RETS AI (Scored 86) competes closely in the document parsing space, offering specialized extraction for real estate documents that may appeal to a broader range of asset classes beyond retail and industrial tenant expansion. Sytes CRE wins on its hyper-specific workflow, but loses on broader utility.

    The bottom line

    Sytes CRE is a purpose-built tool that solves a highly specific problem: the chaotic, email-driven process of tenant site selection. It is not a comprehensive underwriting suite, nor does it provide proprietary market data. Buyers should not purchase this software expecting it to replace their financial modeling tools or enterprise CRM. However, for tenant representation brokers and in-house real estate directors managing high-volume expansion mandates, the platform offers immediate, tangible relief from administrative bloat. The decision to adopt hinges entirely on your deal velocity. If your team reviews five sites a month, the annual plan pricing and implementation effort are likely unjustified. If you are fielding fifty to a hundred submissions across multiple markets, the AI-driven parsing and centralized portal will generate an immediate return on investment by recovering lost analyst hours. Proceed with a pilot program to test the AI extraction accuracy against your specific asset class before committing to a long-term enterprise contract.

    Frequently asked questions

    Does Sytes CRE provide its own market data or lease comparables?

    No, the platform does not supply proprietary market data. It functions strictly as an ingestion and parsing tool for the information submitted by third-party brokers and landlords. Users must rely on external databases to verify the asking rents and terms presented in the site submissions.

    Can the software underwrite complex cash flows or property valuations?

    The platform is not built for deep financial modeling. It evaluates sites based on physical attributes and baseline lease terms to determine a preliminary fit. For complex cash flow projections or investment underwriting, users must export the data to dedicated financial software.

    How does the AI handle poorly scanned or handwritten marketing flyers?

    While the natural language processing engine is trained on standard commercial real estate documents, its accuracy drops significantly when processing low-resolution scans or unconventional layouts. Deal teams should expect to manually correct data extraction errors when submitters upload non-standard or heavily stylized PDF brochures.

    Is the pricing based on the number of users or the number of active requirements?

    The vendor publishes its tenant plan pricing, including paid plans at $499 and $999 per month on annual contracts, and quotes enterprise and national agreements per organization. Based on our analysis of similar Tier 2 platforms, buyers should expect published plans tiered by the number of internal user seats, with enterprise and national agreements quoted separately per organization.

    Does Sytes CRE integrate directly with enterprise CRM platforms like Salesforce?

    The software currently lacks a deep ecosystem of native, plug-and-play integrations with major enterprise CRM systems. Moving data from the submission portal into a broader corporate database typically requires manual exports or the allocation of internal IT resources to develop custom API connections.

    Do external brokers need to pay for a license to submit sites?

    No, the platform is designed to remove friction for external submitters. Landlords and listing brokers can access the custom submission links and upload their site details without purchasing a license or creating a paid account, ensuring maximum participation from the brokerage community.

    Related Reviews

    Compare Sytes CRE with other Underwriting & Deal Analysis tools BestCRE has scored: Crexi (78/100), redIQ (71/100), Siftt AI (70/100) and Cadastral (68/100). Browse every review in CRE Underwriting & Deal Analysis, the full Best CRE AI Tools directory, or the 20 CRE Sectors hub.

  • Siftt AI Review: AI-powered deal screening and underwriting automation for commercial real estate acquisitions

    Siftt AI Review: AI-powered deal screening and underwriting automation for commercial real estate acquisitions

    BestCRE 9AI Score

    70/100 · Contender

    Siftt AI ranks #240 of 450 commercial real estate AI tools scored on the 9AI Framework. Nine dimensions, each scored out of 10: CRE relevance, data quality, ease of adoption, output accuracy, integration fit, pricing transparency, support, innovation and market reputation.

    Siftt AI is an artificial intelligence platform purpose-built for commercial real estate acquisitions and underwriting, designed to automate document extraction and deal screening. The company operates as a Tier 2 CRE-Native database tool, focusing strictly on the acquisition pipeline rather than broad market analytics. According to our BestCRE Master Database Record, Siftt AI targets accelerated underwriting through Offering Memorandum (OM) extraction, BuyBox matching, and an AI copilot interface. Co-founded by Maayan and emerging as a specialized solution for investment firms, the platform aims to solve the acute pain point of inbox overload by triaging inbound broker blasts and scoring them against a firm’s specific investment criteria.

    As of August 2026, the commercial real estate sector is flooded with general-purpose AI wrappers, making specialized, workflow-specific tools highly sought after. Siftt AI positions itself directly in the path of the acquisitions analyst, intercepting deals before they require hours of manual data entry. By reading unstructured documents like OMs, rent rolls, and T12 financials, the software attempts to turn static PDFs into structured, actionable intelligence. While older platforms focus on historical lease comps or macroeconomic trends, Siftt AI is entirely forward-looking, analyzing the deals currently sitting in a buyer’s pipeline. The critical question for any principal or analyst evaluating this software is whether its document extraction accuracy and scoring algorithms actually replace manual triage, or simply add another software layer to an already complex technology stack.

    What Siftt AI does and how it works

    Siftt AI functions as an automated intake and triage system for commercial real estate acquisition teams. The core mechanic begins when a deal arrives via email. Instead of an analyst manually downloading the Offering Memorandum and searching for key metrics, Siftt AI ingests the documents and uses natural language processing to extract the critical data points. This includes property details, financial summaries, tenant rosters, and asking prices. The platform then structures this unstructured data into a standardized format, eliminating the initial data entry phase of the underwriting process.

    Once the data is extracted, the software applies its BuyBox matching algorithm. Users configure their specific investment criteria, such as asset class, geographic focus, target cap rate, vintage, and deal size, within the platform. Siftt AI compares the extracted deal metrics against these parameters and assigns a fit score. Deals are automatically tagged with verdicts like kill, watch, pursue, or priority. This visual pipeline tracking allows acquisitions directors to immediately see which opportunities warrant deep underwriting and which should be discarded, effectively filtering out the noise of high-volume broker blasts.

    Beyond extraction and scoring, the platform features an AI copilot designed for interactive deal analysis. Analysts can query the copilot about specific nuances within the OM, asking questions like “What are the near-term lease expirations?” or “Are there any environmental concerns mentioned in the disclosures?” The copilot retrieves answers directly from the source documents, providing citations for easy verification. This interactive layer serves as an assistant during the preliminary underwriting phase, helping teams validate assumptions and identify red flags without having to read hundreds of pages of marketing materials. The entire system is built to accelerate the time from deal receipt to initial decision.

    9AI Framework: the score, dimension by dimension

    Dimension Score
    CRE Relevance 9/10
    Data Quality and Sources 7/10
    Ease of Adoption 8/10
    Output Accuracy 8/10
    Integration and Workflow Fit 7/10
    Pricing Transparency 4/10
    Support and Reliability 6/10
    Innovation and Roadmap 8/10
    Market Reputation 6/10
    Composite 9AI Score 70/100

    CRE Relevance: 9/10

    Unlike generic large language models that struggle with the specific terminology of commercial real estate, Siftt AI is explicitly trained on industry-standard documents like Offering Memorandums, rent rolls, and operating statements. The platform understands the difference between a triple-net lease and a gross lease, and it correctly parses complex capital stacks and trailing twelve-month financials. This deep domain specificity means users do not have to spend time engineering complex prompts to get the AI to understand basic property metrics. The entire user interface is designed around the standard acquisition workflow, reflecting a clear understanding of how investment teams actually evaluate opportunities. In practice: Analysts can upload standard broker packages and expect the system to accurately identify Net Operating Income without needing to explain what the acronym means.

    Data Quality and Sources: 7/10

    Siftt AI relies entirely on the data provided by the user, meaning its quality is directly tied to the accuracy of the inbound broker documents. It does not bring a massive proprietary dataset of historical lease comps or property records to the table. However, its ability to accurately extract and structure the data trapped within user-uploaded PDFs is highly effective. The platform excels at pulling text and tables from OMs, though it can occasionally struggle with heavily stylized or poorly scanned financial documents. Because it acts as a processor rather than a provider of external market data, users must remain vigilant about the underlying assumptions baked into the broker’s pro forma. In practice: The software accurately digitizes the numbers you feed it, but it will not independently verify if the broker’s rent growth assumptions are realistic.

    Ease of Adoption: 8/10

    The platform is designed with a highly intuitive, visual pipeline interface that mimics modern project management software, making it immediately familiar to younger analysts. Setting up the BuyBox criteria takes only a few minutes, and the drag-and-drop document upload process requires zero technical training. The AI copilot uses natural language, so users can interact with it just as they would with consumer-grade chatbots. While configuring custom data exports to specific Excel underwriting models requires some initial mapping, the baseline functionality works out of the box. The learning curve is minimal, allowing teams to see value on the first day of deployment. In practice: A new acquisitions associate can begin screening deals and generating summaries within an hour of receiving their login credentials.

    Output Accuracy: 8/10

    When extracting standard metrics like square footage, year built, and asking price from text-heavy OMs, Siftt AI performs with high precision. The natural language processing engine is highly capable of identifying key terms even when brokers use varying terminology. Table extraction for rent rolls and T12s is generally reliable, though heavily nested or merged cells in PDF tables can sometimes cause alignment issues that require manual correction. The BuyBox matching algorithm correctly flags deals that violate hard constraints, preventing wasted time on obvious misfits. The AI copilot provides accurate answers based strictly on the uploaded documents, minimizing the risk of hallucinated data. In practice: Users will trust the system for initial triage and high-level summaries, but will still manually verify the extracted rent roll before finalizing a binding letter of intent.

    Integration and Workflow Fit: 7/10

    Siftt AI fits neatly into the very front end of the commercial real estate technology stack. It serves as the intake valve, sitting between the email inbox and the deep underwriting models. The platform offers basic export capabilities, allowing analysts to push structured data into standard Excel templates or CSV files. However, direct API connections to enterprise resource planning systems or legacy property management software are currently limited. The tool works best as a standalone triage environment where deals are scored and debated before the surviving opportunities are manually advanced into the firm’s primary database or complex financial models. In practice: Firms will use Siftt AI as their primary deal screening dashboard, but will still rely on standard Excel exports to move the data into their proprietary underwriting templates.

    Pricing Transparency: 4/10

    Siftt AI operates on a paid, enterprise-style pricing model and does not publish its software tiers or base costs on its website. This lack of public pricing forces prospective buyers into a sales motion just to determine if the tool fits their budget. For a platform targeting acquisitions teams that value rapid screening and efficiency, the opaque pricing strategy creates unnecessary friction during the procurement process. While enterprise pricing is common for tools that require custom onboarding or data mapping, the absence of even a starting baseline makes it difficult for smaller shops to evaluate feasibility prior to a demo. In practice: Buyers must engage directly with the sales team to get a custom quote, which will likely scale based on deal volume or the number of active user seats.

    Support and Reliability: 6/10

    As a relatively new entrant in the commercial real estate technology space, Siftt AI is still establishing its long-term support infrastructure. The founding team is highly responsive, often providing direct, hands-on assistance during onboarding and troubleshooting. However, the company lacks the massive, global support teams found at legacy software providers. Documentation is adequate for core features, but edge cases involving complex document extraction failures may require direct intervention from their engineering team. Uptime has been stable, but the startup nature of the business means buyers are betting on the team’s continued growth and ability to scale customer success operations alongside their user base. In practice: Users will receive highly personalized, fast support from core team members, but cannot rely on a 24/7 enterprise call center for immediate weekend resolutions.

    Innovation and Roadmap: 8/10

    The development trajectory for Siftt AI is highly focused on deepening its automated underwriting capabilities. The company is actively iterating on its document parsing engines to handle increasingly complex and poorly formatted financial statements. Future updates are expected to enhance the AI copilot, moving it from a simple query tool to a proactive assistant that flags underwriting inconsistencies and suggests alternative scenarios. The roadmap also indicates a push toward better integration with third-party market data sources, which would allow the system to cross-reference broker claims against independent market realities. The pace of feature releases is rapid, reflecting an agile engineering culture. In practice: Buyers are investing in a platform that will likely look significantly more advanced in twelve months, particularly regarding its ability to automate complex financial modeling tasks.

    Market Reputation: 6/10

    Siftt AI is building a strong, albeit niche, reputation among forward-thinking acquisitions teams and boutique investment firms. It is frequently discussed in commercial real estate AI communities as a practical solution for deal triage, often compared favorably against manual inbox management. However, as an unproven startup, it lacks the widespread brand recognition and institutional trust enjoyed by older, established data providers. Larger private equity firms and institutional investors may view the platform with cautious optimism, waiting for more extensive case studies and long-term viability signals before committing to enterprise-wide deployments. The current user base is highly enthusiastic, but relatively small. In practice: The software is highly regarded by early adopters for solving a specific pain point, but it has not yet achieved default-status across the broader commercial real estate industry.

    Who should use Siftt AI

    Siftt AI is purpose-built for teams drowning in inbound deal flow who need a faster way to separate viable opportunities from irrelevant noise. It delivers the highest value to organizations that spend excessive hours on preliminary data entry.

    High-volume acquisition teams: Firms receiving dozens of broker blasts weekly that need to quickly score deals against a strict buy box.

    Lean investment boutiques: Small shops without an army of junior analysts to manually read every Offering Memorandum that hits the inbox.

    Brokerage evaluation teams: Investment sales brokers who need to quickly parse seller financials to determine if an asset is worth pitching.

    Value-add syndicators: Sponsors who rely on rapid triage to find mispriced assets before competitors can complete their initial underwriting.

    Who should look elsewhere

    This platform is highly specialized for the intake and triage phase of acquisitions. It will not serve firms looking for broad market analytics or complete, end-to-end property management solutions.

    Macro-level market researchers: Analysts looking for historical lease comps, market trends, or demographic data, as the tool relies on user-uploaded documents.

    Firms with minimal deal flow: Investors who only evaluate one or two highly targeted off-market deals a month will not see a return on the automation features.

    Property managers: Operations teams looking for tenant communication tools, work order tracking, or facility maintenance software.

    Pricing and ROI

    Siftt AI operates on a paid, enterprise-tier model and does not publish its pricing publicly. Prospective buyers must engage with the sales team to receive a custom quote, which is typically structured around the volume of deals processed or the number of active user seats required by the firm. This opaque pricing strategy is common among specialized commercial real estate software, but it requires firms to commit time to a discovery process before understanding the financial commitment.

    When calculating the return on investment, buyers should focus strictly on analyst hours saved during the preliminary screening phase. If a junior analyst spends an average of 45 minutes downloading an OM, finding the rent roll, extracting the trailing twelve-month financials, and checking those metrics against the firm’s buy box, a firm processing 40 deals a month is spending roughly 30 hours on pure data entry. By automating this extraction and scoring process, Siftt AI theoretically returns those 30 hours to the analyst for deeper, more critical underwriting tasks. To justify the enterprise cost, the firm must value that recovered time higher than the software’s annual licensing fee, or prove that the accelerated screening process allows them to submit competitive offers faster than rival buyers.

    Integration and CRE tech stack fit

    In a modern commercial real estate technology stack, Siftt AI occupies the very top of the acquisition funnel. It is designed to sit between your email client and your primary underwriting models. The platform excels at standardizing unstructured data, allowing users to export the extracted metrics via CSV or basic Excel formats. This makes it relatively straightforward to map Siftt AI’s outputs into proprietary Excel pro formas, provided your firm uses consistent data structures.

    However, deep, bi-directional API integrations with enterprise databases or legacy pipeline management tools are currently limited. You will not find native, out-of-the-box connectors for heavy enterprise resource planning systems. Instead, Siftt AI functions best as an isolated triage environment. Deals are ingested, scored, and debated within the Siftt AI dashboard. Once an opportunity passes the initial screening and is marked for pursuit, the data is typically exported and manually uploaded into the firm’s primary deal tracking software. It is a highly effective intake valve, but it requires a disciplined export process to ensure data flows smoothly into the rest of your tech stack.

    Competitive landscape

    The market for AI-driven commercial real estate underwriting and deal screening has become highly competitive, with several distinct approaches to the problem. Siftt AI competes directly with other triage-and-score platforms, but buyers must also weigh it against established data providers and broader AI platforms.

    HelloData (Scored 91) and Cotality (Scored 91) represent the top tier of automated deal analysis. HelloData excels in automated underwriting and document extraction, offering highly accurate parsing that directly rivals Siftt AI’s core functionality. Cotality provides a similarly strong AI-driven approach to deal screening, often with more transparent pricing and established integration pathways. Firms evaluating Siftt AI must demo these two platforms to compare extraction accuracy on their specific document types.

    For firms that want external market data injected into their screening process, CompStak (Scored 88) remains a formidable alternative. While Siftt AI relies strictly on the documents you upload, CompStak brings a massive proprietary database of crowdsourced lease and sales comps, allowing for immediate cross-referencing of broker claims. Cherre (Scored 86) offers a different angle, focusing heavily on data connection and warehousing, making it a better fit for enterprise firms needing to unify disparate data streams rather than just screen inbound OMs.

    Finally, general-purpose predictive platforms like Akkio (Scored 86) and specialized tools like RETS AI (Scored 86) offer alternative ways to model outcomes. Siftt AI differentiates itself from these by remaining hyper-focused on the visual pipeline and the specific workflow of reading a broker blast, scoring it against a buy box, and providing an AI copilot for immediate document querying.

    The bottom line

    Siftt AI is a highly capable, specialized tool for commercial real estate acquisition teams suffering from deal fatigue. It successfully automates the most tedious part of the investment process: reading dense Offering Memorandums and manually typing metrics into a screening model. The visual pipeline and strict buy box matching provide immediate clarity to an otherwise chaotic inbox. However, its lack of published pricing and its status as an unproven startup mean buyers must be willing to engage in a custom sales process and bet on the founding team’s long-term viability. If your firm processes a high volume of inbound deals and your analysts are bogged down by data entry, Siftt AI offers a clear, immediate return on investment. If you only look at a handful of targeted deals a month, the automation will not justify the enterprise cost.

    Frequently asked questions

    Does Siftt AI provide market comps or historical lease data?

    No. Siftt AI functions strictly as a document extraction and deal screening tool. It analyzes the specific financial documents and OMs you upload into the system, but it does not provide an external database of market comparables, historical property records, or macroeconomic trends to supplement your underwriting.

    Can Siftt AI read scanned PDFs or only native text documents?

    The platform utilizes advanced optical character recognition to read and parse scanned PDFs, including complex tables like rent rolls and trailing twelve-month financials. However, heavily distorted, watermarked, or poorly scanned documents may require manual correction after extraction to ensure the data maps correctly to your underwriting model.

    How much does Siftt AI cost?

    Siftt AI does not publish its pricing publicly on its website. It operates on a paid, enterprise-tier model, requiring prospective buyers to contact their sales team directly for a custom quote. Pricing is typically structured around your firm’s deal volume and the number of active user seats.

    Does the platform integrate directly with Excel?

    Siftt AI allows users to export all extracted deal metrics into standard Excel and CSV formats. While it does not currently feature a live, bi-directional Excel add-in for real-time syncing, the structured exports can be easily mapped into your firm’s proprietary underwriting templates with minimal formatting.

    What is the BuyBox matching feature?

    The BuyBox is a set of custom investment criteria you define within the platform, such as target cap rate, asset class, geography, and deal size. Siftt AI automatically scores every inbound deal against these specific parameters to determine its overall fit, flagging it for pursuit or rejection.

    Is Siftt AI suitable for property management operations?

    No. The platform is strictly designed for the acquisitions and underwriting phase of the commercial real estate lifecycle. It does not include operational features for tenant communication, work order tracking, lease administration, or daily facility management, making it unsuitable for dedicated property management teams.

    Related Reviews

    Compare Siftt AI with other Underwriting & Deal Analysis tools BestCRE has scored: Crexi (78/100), redIQ (71/100), Terrakotta.ai (71/100) and Archer (70/100). Browse every review in CRE Underwriting & Deal Analysis, the full Best CRE AI Tools directory, or the 20 CRE Sectors hub.

  • REHQ Review: An all-in-one prospecting platform for commercial real estate deal origination

    REHQ Review: An all-in-one prospecting platform for commercial real estate deal origination

    BestCRE 9AI Score

    62/100 · Niche

    REHQ ranks #494 of 584 commercial real estate AI tools scored on the 9AI Framework. Nine dimensions, each scored out of 10: CRE relevance, data quality, ease of adoption, output accuracy, integration fit, pricing transparency, support, innovation and market reputation.

    REHQ is a commercial real estate prospecting and deal management platform designed to centralize property data, owner contact information, and direct outreach campaigns. According to BestCRE’s master database, REHQ operates on a paid subscription model and primarily focuses on CRE prospecting, including property map searches, owner contacts, and outreach execution. Founded by a producing broker, the software attempts to solve a structural problem in the brokerage and investment acquisition space: the fragmentation of data gathering and outbound communication. Analysts and principals typically stitch together multiple systems, a property database for zoning and square footage, a skip-tracing service for phone numbers and emails, and a separate customer relationship management (CRM) tool for power dialing or email sequences. REHQ collapses these functions into a single interface.

    At its core, the system provides nationwide property records alongside entity resolution tools that attempt to pierce LLC structures to find the actual decision-makers. While the premise is highly relevant to acquisition teams and brokers, our analysis indicates that the platform is still establishing its footprint against more entrenched data providers. As of August 2026, the company positions itself as an operating system for dealmakers, focusing heavily on off-market deal origination. However, buyers evaluating this tool must weigh the convenience of an all-in-one prospecting engine against the inherent limitations of aggregated contact data, which often requires manual verification. The platform serves as a direct pipeline generator rather than a pure analytical underwriting tool, making its actual value dependent on the user’s commitment to consistent outbound sales activity.

    What REHQ does and how it works

    REHQ functions primarily as an outbound sales engine tailored specifically for commercial real estate assets. The platform architecture is divided into three main operational phases: property discovery, contact resolution, and campaign execution. During the discovery phase, users navigate a map-based interface to filter properties based on physical and financial characteristics. You can isolate parcels by zoning type, acreage, total square footage, and historical sale dates. This allows acquisition teams to build highly targeted lists, such as industrial properties over 50,000 square feet that have not traded in the last ten years.

    Once a target list is assembled, the software’s contact resolution engine takes over. Instead of forcing users to export a list of LLCs to a third-party skip tracer, REHQ attempts to map the corporate entity to a human owner. It provides associated phone numbers, email addresses, and mailing coordinates. Our analysis notes that while this consolidation saves time, the underlying data relies on public records and third-party aggregators, meaning bounce rates and disconnected numbers will still occur at standard industry frequencies. The system does not eliminate the friction of bad data; it merely accelerates the process of finding it.

    The final component is the outreach execution suite. REHQ includes built-in communication tools such as power dialing, automated email sequencing, SMS texting, and direct mail fulfillment. Users can load their verified lists directly into a multi-touch campaign without leaving the browser. The platform tracks pipeline performance, logging calls and monitoring email open rates to quantify prospecting efforts. By keeping the data and the outreach mechanism in one environment, REHQ reduces the administrative drag of moving spreadsheets between different software silos. It is a workflow accelerator designed for high-volume outbound prospectors who need to move quickly from identifying a parcel to dialing the owner’s phone number.

    9AI Framework: the score, dimension by dimension

    Dimension Score
    CRE Relevance 8/10
    Data Quality and Sources 7/10
    Ease of Adoption 7/10
    Output Accuracy 7/10
    Integration and Workflow Fit 6/10
    Pricing Transparency 4/10
    Support and Reliability 6/10
    Innovation and Roadmap 6/10
    Market Reputation 5/10
    Composite 9AI Score 62/100

    CRE Relevance: 8/10

    REHQ is largely native to the commercial real estate sector, avoiding the pitfalls of generic sales software that fails to understand property-level data. The architecture is built around parcels, zoning codes, and LLC ownership structures, which are the fundamental units of CRE deal-making. Unlike horizontal CRMs, it does not require heavy customization to track square footage or asset classes. The platform inherently understands the difference between a tenant and a fee-simple owner, aligning closely with the daily requirements of an investment sales broker or an acquisitions analyst, although its database spans 160 million-plus US properties, well beyond the commercial universe. In practice: CRE professionals will find the data fields and workflow logic immediately applicable to off-market deal sourcing without needing costly administrative setup.

    Data Quality and Sources: 7/10

    The platform aggregates nationwide property records and owner contact information, which presents a mixed reality regarding data fidelity. Property-level data, such as lot size and transaction history, is generally reliable as it pulls from standardized county assessor feeds. However, the contact resolution aspect, which attempts to tie LLCs to phone numbers and emails, is inherently volatile. Our analysis shows that all skip-tracing aggregators suffer from decay, and REHQ is not immune to incorrect numbers or outdated corporate officer lists. Users must approach the contact data as a high-probability starting point rather than an absolute truth. In practice: Analysts should expect to supplement the provided contact details with manual verification for high-priority targets, as bounce rates will mirror standard industry averages.

    Ease of Adoption: 7/10

    Transitioning to a unified prospecting system requires a behavioral shift for teams accustomed to fragmented workflows. REHQ mitigates this by offering a straightforward, map-based interface that mimics consumer real estate applications. The learning curve is primarily associated with the outreach tools, setting up email sequences and configuring the power dialer. Because the system is designed to replace multiple distinct tools, the initial setup involves migrating existing lists and establishing new daily habits for the sales team. However, the consolidation ultimately reduces the technical burden of managing API connections between separate data and email platforms. In practice: A dedicated broker or analyst can reach basic operational competency within a week, provided they commit to using the built-in communication tools.

    Output Accuracy: 7/10

    When evaluating an outreach platform, output accuracy translates to the correct execution of communication sequences and the exactness of pipeline reporting. REHQ performs well in automating the mechanical tasks of outbound sales, such as triggering follow-up emails on specific days or logging call durations. The mapping interface accurately reflects the physical boundaries and zoning overlays of the requested queries. However, the accuracy of the strategic output depends entirely on the quality of the list built by the user. The software will faithfully execute a campaign, even if the underlying targeting is flawed. In practice: The system delivers precise execution of automated tasks, but users remain responsible for auditing their search parameters to ensure they are contacting the correct demographic.

    Integration and Workflow Fit: 6/10

    As an all-in-one platform, REHQ is designed to absorb functions rather than connect to them, which creates a complex integration profile. It seeks to replace your existing CRM, skip-tracer, and email marketing tool. For firms with deeply entrenched enterprise systems like Salesforce, adopting REHQ might create a siloed environment where prospecting data lives separately from institutional client records, although the vendor says leads can be pushed into a firm’s own CRM. The platform is best suited for independent teams or boutique firms that do not have rigid, legacy tech stacks. Details regarding open APIs or native bidirectional syncs with major enterprise CRMs are not published. In practice: Buyers should view this as a standalone operating system for deal origination rather than a modular plugin for an existing enterprise architecture.

    Pricing Transparency: 4/10

    REHQ operates on a paid subscription model, with a 14-day free trial on all plans, and team plans are customized through a demo. Prospective buyers must engage with the sales team to obtain a quote. This lack of transparency requires firms to invest time in discovery calls before understanding if the tool fits their operational budget. We penalize vendors in this category when they obscure their entry-level costs, as it prevents analysts from conducting preliminary financial modeling. It remains unclear if the cost scales by the number of users, the volume of skip-traced contacts, or the amount of direct mail sent. In practice: Analysts must prepare for a traditional enterprise sales cycle and should explicitly ask about hidden costs related to data exports or communication volume limits.

    Support and Reliability: 6/10

    As a Tier 2, CRE-native startup, REHQ is still scaling its customer success infrastructure. While the platform was founded by industry practitioners who understand the specific pain points of brokers, the company does not publish formal service level agreements (SLAs) or guaranteed response times. Early-stage platforms often provide highly personalized, founder-led support, which is excellent for early adopters but can become strained as the user base expands. Buyers should not expect the 24/7 global support desks offered by legacy data conglomerates. Support is likely handled during standard US business hours. In practice: Users will likely receive competent, industry-literate assistance, but they should anticipate occasional delays typical of a growing, independent software vendor.

    Innovation and Roadmap: 6/10

    The company is actively positioning itself as an AI-powered tool, though the specific applications of artificial intelligence within the platform appear focused on workflow automation and data parsing rather than predictive market analytics. The roadmap likely centers on improving the entity resolution algorithms and expanding the capabilities of the automated outreach sequences. As a newer entrant, REHQ has the agility to ship features quickly based on user feedback, avoiding the bureaucratic development cycles of older competitors. However, long-term feature delivery is contingent on the company’s continued capital efficiency and market penetration. In practice: Buyers are investing in the current prospecting functionality, with the expectation of incremental improvements to contact accuracy and campaign automation over the next twelve months.

    Market Reputation: 5/10

    REHQ is building a localized but enthusiastic reputation among independent brokers and boutique investment firms who prioritize aggressive outbound sales. It is not yet a household name among institutional core-plus funds or global brokerage conglomerates. The firm’s messaging resonates heavily with professionals frustrated by the manual labor of off-market deal sourcing. Because it is a newer, Tier 2 provider, it lacks the decades of validated trust held by legacy data platforms. However, early indicators suggest strong loyalty from users who actually execute high-volume cold calling and direct mail campaigns. In practice: The tool is highly regarded by individual producers and scrappy acquisition teams, but it will require internal championing to get approval from institutional procurement departments.

    Who should use REHQ

    REHQ is optimized for high-volume outbound dealmakers who view real estate acquisition as a numbers game requiring consistent daily activity.

    Investment sales brokers who spend hours daily cold-calling off-market property owners.

    Boutique acquisition teams looking to replace a fragmented stack of property databases, skip tracers, and email software.

    Independent developers seeking vacant land or underutilized parcels who need direct access to entity decision-makers.

    Sales development representatives (SDRs) in CRE who require a structured daily workflow for power dialing and follow-ups.

    Who should look elsewhere

    This platform is not designed for institutional underwriters, passive investors, or teams that rely strictly on inbound deal flow.

    Institutional analysts who need deep demographic, macroeconomic, or predictive rent growth modeling.

    Firms with strictly enforced, heavily customized enterprise CRM environments that prohibit siloed data.

    Professionals who only analyze on-market deals provided by established brokerage memorandums.

    Users expecting a magic bullet for contact data who are unwilling to manually verify numbers when public records fail.

    Pricing and ROI

    REHQ has a public pricing page that advertises a 14-day free trial on all plans. The company utilizes a paid subscription model, with customized team plans arranged through a demonstration. Based on the platform’s architecture, costs likely scale based on user seats, the volume of skip-traced contacts, or the consumption of outreach credits such as SMS segments or direct mail pieces. Buyers must clarify these variables during the sales process to avoid unexpected operational expenses.

    To calculate the return on investment, an analyst must measure the cost of the subscription against the consolidated expenses of their current tech stack. If a broker currently spends $300 per month on a property database, $150 on a skip-tracing service, and $100 on a specialized sales CRM, the break-even point for REHQ is roughly $550 per month. Beyond software consolidation, the true ROI metric is the reduction in administrative hours. If the platform saves an analyst ten hours a week in list formatting and manual data entry, and that time is redirected into active power dialing, the origination of a single off-market transaction will cover the software’s cost for several years.

    Integration and CRE tech stack fit

    Integrating REHQ into an existing commercial real estate tech stack requires careful consideration of data boundaries. Because REHQ functions as an all-in-one prospecting operating system, it naturally competes with existing CRMs and email marketing platforms. If your firm mandates the use of a central database for all client interactions, adopting REHQ may create a parallel system where prospecting activity is hidden from management until a deal is officially originated.

    The platform is highly self-contained, meaning it handles the property research, the contact discovery, and the outreach execution internally. For boutique shops, this is an advantage, allowing them to discard disparate subscriptions. For larger organizations, the lack of published, native bidirectional syncs with major enterprise tools could be a friction point. Analysts must evaluate whether they are willing to operate their outbound sales motion in a separate environment from their institutional record-keeping. The tool fits best when treated as the absolute top of the funnel, with successful conversions manually exported to the primary firm CRM once a letter of intent is drafted.

    Competitive landscape

    The commercial real estate data and prospecting landscape is highly fragmented, forcing REHQ to compete against both specialized data providers and horizontal sales tools. When evaluating REHQ, analysts should consider alternatives based on their specific operational bottlenecks.

    For teams primarily focused on property data and market analytics rather than outbound dialing, platforms like CompStak (Score: 88) or Cherre (Score: 86) offer deeper, more institutional-grade data aggregation, though they lack built-in power dialers and email sequencers. If the goal is purely predictive analytics and site selection based on alternative data, HelloData (Score: 91) provides superior algorithmic insights, identifying anomalies in property performance rather than just aggregating owner contacts.

    In the direct prospecting space, REHQ competes with established property databases which provide owner information but often require users to export lists to third-party CRMs or specialized dialing software to execute campaigns. Cotality (Score: 91) is another strong peer in the broker-efficiency space, offering high-tier relationship mapping, though REHQ leans more heavily into the mechanical execution of cold outreach like direct mail and power dialing. Ultimately, REHQ differentiates itself not by having exclusive data, but by collapsing the distance between finding a property and calling the owner.

    The bottom line

    REHQ is a highly tactical, execution-focused platform built for commercial real estate professionals who prioritize outbound origination. It succeeds by eliminating the administrative friction of moving data between property databases, skip tracers, and communication tools. If your team struggles with inconsistent prospecting because the process of building and executing lists is too cumbersome, this software provides a unified, structured environment to force daily sales activity. However, it is not an institutional underwriting tool or a predictive analytics engine. The contact data will still require standard verification, and the platform demands a user willing to put in the hours on the phone. Buy REHQ if you want to consolidate your top-of-funnel sales stack and accelerate your cold outreach; pass if you need deep macroeconomic modeling or require integration into a rigid enterprise CRM.

    Frequently asked questions

    Does REHQ provide accurate owner phone numbers for every property?

    No platform can guarantee 100% accuracy for owner contact data. REHQ uses entity resolution to match LLCs to likely decision-makers, providing a high-probability starting point. Users should expect standard industry bounce rates and disconnected numbers, requiring manual verification for highly targeted, complex corporate ownership structures.

    Can I replace my current CRM with REHQ?

    Yes, if your primary use case is outbound prospecting and deal origination. REHQ includes built-in pipelines, email sequencing, and call logging. However, if you work at a large institution with complex, multi-departmental reporting requirements, it may lack the extreme customization found in legacy enterprise CRMs.

    Is pricing for REHQ available online?

    The company has a public pricing page, which advertises a 14-day free trial on all plans. They operate on a customized paid subscription model. Prospective buyers must book a demonstration with their sales team to receive a quote, which likely scales based on user count and the volume of outreach or data utilized.

    Does the platform include direct mail capabilities?

    Yes, REHQ integrates direct mail into its automated outreach sequences. Users can build a list of targeted properties and trigger physical mailers directly from the platform, alongside digital touchpoints like emails and SMS, keeping all multi-channel prospecting efforts centralized in one interface.

    Is REHQ suitable for analyzing demographic trends and rent growth?

    No. REHQ is strictly a prospecting and deal origination tool. It provides physical property characteristics, zoning, and ownership data to facilitate direct outreach. It does not offer predictive macroeconomic modeling, demographic shifts, or detailed rent roll analytics required for institutional underwriting.

    How long does it take to learn the software?

    The map-based property search is intuitive and can be mastered in a few hours. The steeper learning curve involves configuring automated email sequences and establishing daily habits with the power dialer. The vendor says teams can be up and running in as little as 30 days through guided onboarding.

    Related Reviews

    Compare REHQ with other Underwriting & Deal Analysis tools BestCRE has scored: Crexi (78/100), redIQ (71/100), Cactus (71/100) and Capitalize.io (71/100). Browse every review in CRE Underwriting & Deal Analysis, the full Best CRE AI Tools directory, or the 20 CRE Sectors hub.
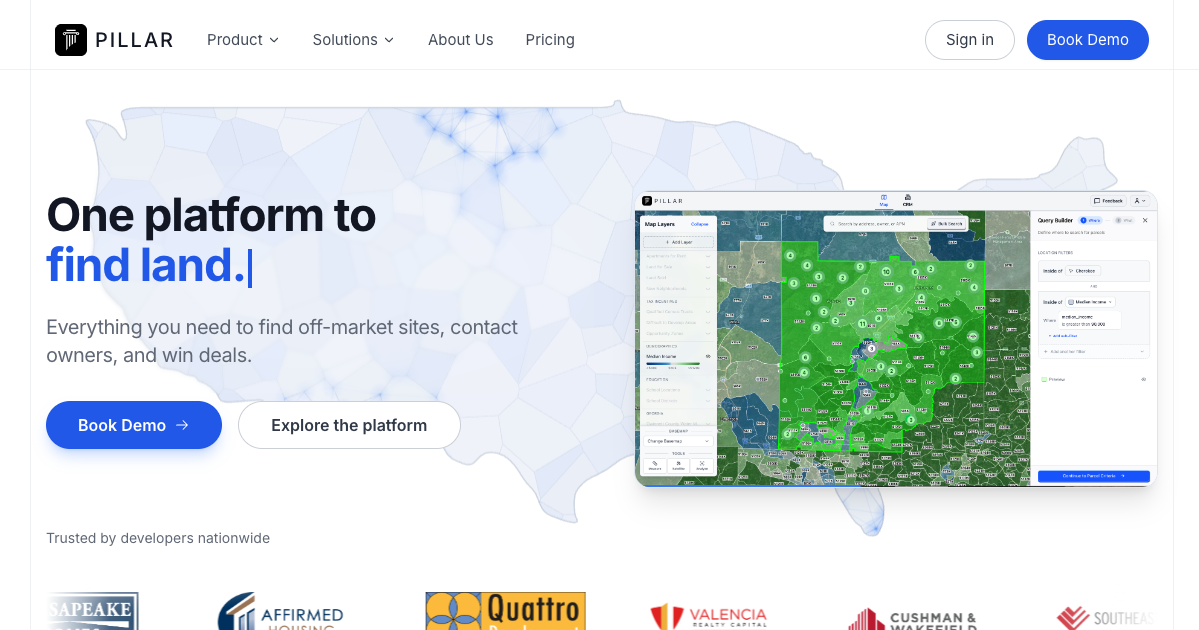
  • Prophetic Review: AI-powered land acquisition and zoning intelligence for commercial real estate developers

    Prophetic Review: AI-powered land acquisition and zoning intelligence for commercial real estate developers

    BestCRE 9AI Score

    64/100 · Niche

    Prophetic ranks #337 of 450 commercial real estate AI tools scored on the 9AI Framework. Nine dimensions, each scored out of 10: CRE relevance, data quality, ease of adoption, output accuracy, integration fit, pricing transparency, support, innovation and market reputation.

    Prophetic is an AI-powered land acquisition and zoning intelligence platform designed for commercial real estate developers, currently classified in the BestCRE master database as a Tier 2 CRE-native application. The platform focuses specifically on automating the early stages of site selection and feasibility analysis, moving away from manual municipal code research toward algorithmic parcel evaluation. In the commercial real estate underwriting and deal analysis category, most software providers attempt to solve cash flow modeling or rent roll parsing. Prophetic narrows its focus entirely on the physical and legal constraints of dirt, aiming to calculate what can be built on a specific site before a developer commits capital to formal architectural or legal feasibility studies.

    As of Q3 2026, evaluating Prophetic requires acknowledging the inherent difficulty of its chosen niche. Municipal zoning codes are notoriously fragmented, poorly digitized, and subject to frequent amendments. A tool attempting to parse this data must navigate conflicting local ordinances and subjective planning board guidelines. Our analysis indicates that Prophetic targets this exact friction point, offering developers a way to screen thousands of parcels for specific development criteria rather than manually reading local ordinances. However, because it operates in a Tier 2 capacity, prospective buyers must approach the platform with a clear understanding of the necessity of human verification, although the vendor claims nationwide coverage across more than 20,000 zoning jurisdictions. The software does not replace the zoning attorney, but it does aim to significantly accelerate the initial pipeline screening process for land acquisition teams.

    What Prophetic does and how it works

    Prophetic functions primarily as a search and feasibility engine for land acquisition. Users interact with the platform by inputting specific development parameters, such as desired asset class, minimum buildable square footage, required floor area ratios, and parking minimums. The software then queries its database of mapped parcels and ingested municipal zoning codes to return sites that legally permit the proposed development. This process replaces the traditional method of identifying a parcel and subsequently researching the local code, instead allowing developers to start with their target criteria and filter the market for compliant land.

    Beyond initial filtering, the platform provides automated zoning intelligence and preliminary feasibility reports for individual parcels. When a user selects a specific site, Prophetic extracts the relevant zoning parameters, including setbacks, height restrictions, maximum lot coverage, and permitted uses. The engine attempts to synthesize these constraints into a preliminary massing or yield study, calculating the theoretical maximum density achievable on the site. Our analysis shows this mechanic is highly dependent on the quality of the ingested municipal data. If a city provides clean, updated digital zoning files, the output is highly actionable. If the municipality relies on scanned PDF documents from decades ago, the AI must interpret unstructured text, increasing the probability of errors.

    The platform also includes workflow tools for deal analysis, allowing acquisition teams to save parcels, annotate findings, and track the status of various sites through the pipeline. Users can export the zoning summaries and feasibility metrics to share with investment committees or external consultants. While the core mechanic relies heavily on natural language processing to interpret legal text, the user interface presents the data in standard commercial real estate formats, focusing on the mathematical constraints of development rather than the underlying code parsing.

    9AI Framework: the score, dimension by dimension

    Dimension Score
    CRE Relevance 8/10
    Data Quality and Sources 7/10
    Ease of Adoption 7/10
    Output Accuracy 7/10
    Integration and Workflow Fit 6/10
    Pricing Transparency 4/10
    Support and Reliability 6/10
    Innovation and Roadmap 7/10
    Market Reputation 6/10
    Composite 9AI Score 64/100

    CRE Relevance: 8/10

    Prophetic is a CRE-native application built specifically for the nuances of commercial real estate development and land acquisition. Unlike generic data extraction tools, its architecture is fundamentally designed around zoning codes, floor area ratios, and parcel boundaries. The platform addresses a highly specific, high-friction workflow: determining legal development feasibility before spending money on consultants. Because it focuses entirely on the physical and regulatory constraints of real estate, its relevance to ground-up developers is high, though the vendor lists homebuilders and horizontal residential developers first among its audiences. It does not attempt to serve property managers, and although the vendor also markets to land brokerages, the product stays aligned with the acquisition and underwriting process. In practice: Development teams will find the platform speaks their exact language, using industry-standard terminology for site constraints and yield metrics.

    Data Quality and Sources: 7/10

    The platform relies on a combination of public municipal records, GIS parcel data, and proprietary AI extraction. Because zoning data is inherently fragmented across thousands of local jurisdictions, the baseline data quality fluctuates significantly based on the target market. In major metropolitan statistical areas with modernized planning departments, the inputs are generally reliable. In secondary or tertiary markets, the software must interpret unstructured, often contradictory PDF documents, which introduces risk. Prophetic does not publish its exact error rates for municipal data extraction, meaning users must treat the outputs as preliminary indicators rather than guaranteed facts. In practice: Analysts must still cross-reference the platform’s zoning summaries with official municipal websites before finalizing any underwriting assumptions.

    Ease of Adoption: 7/10

    Implementing Prophetic requires a shift in how acquisition teams approach site selection. While the user interface is straightforward, the methodology of searching by development criteria rather than geographic boundaries requires training. The platform demands that users clearly define their yield requirements and architectural constraints upfront. Furthermore, because the outputs require human verification, teams must establish standard operating procedures for how the software’s data is utilized in committee memos. The learning curve is less about software navigation and more about integrating AI-generated feasibility into a traditionally manual, highly scrutinized legal workflow. In practice: Expect a two-to-four week onboarding period where analysts learn to calibrate their search parameters and trust the preliminary yield outputs.

    Output Accuracy: 7/10

    Evaluating the accuracy of AI-generated zoning intelligence is complex. Prophetic excels at identifying explicit numerical constraints, such as maximum height limits or parking ratios. However, zoning codes frequently contain conditional clauses, overlay districts, and subjective design guidelines that algorithms struggle to interpret accurately. Our analysis indicates that while the platform rarely hallucinates standard parcel data, it can miss nuanced exceptions that a local zoning attorney would immediately recognize. The mathematical feasibility calculations are generally sound, provided the underlying zoning inputs were extracted correctly. In practice: The software provides a highly accurate first pass for site screening, but its feasibility reports cannot serve as the sole legal basis for a non-refundable earnest money deposit.

    Integration and Workflow Fit: 6/10

    As a Tier 2 application, Prophetic currently operates primarily as a standalone research and screening environment. API access and custom data export are listed only on its Enterprise plan, and it does not offer the extensive API ecosystems found in more mature, Tier 1 data platforms. Users typically export the feasibility data and zoning summaries as static files or manually transfer the yield metrics into their proprietary Excel underwriting models. While it can theoretically sit alongside other market data tools, it does not natively push data into major enterprise resource planning systems or advanced portfolio management software. In practice: Analysts will use Prophetic in a separate browser tab to gather site intelligence, manually inputting the resulting buildable square footage into their existing cash flow models.

    Pricing Transparency: 4/10

    Prophetic sells Pro, Expert and Enterprise plans, and baseline costs for each are not published on its website. This lack of transparency is standard for specialized CRE data platforms, but it significantly complicates the initial evaluation process for mid-sized development shops. Buyers must engage directly with the sales team to determine if the platform fits within their technology budget. The vendor plans page does publish what each tier includes and explains that pricing is either per user or unlimited-user and based on geography, which lifts the score above the minimum. Because no public figures are available, organizations cannot perform preliminary cost-benefit analyses prior to a demonstration. In practice: Prospective buyers should prepare for a traditional, multi-call enterprise sales cycle to discover the actual financial commitment.

    Support and Reliability: 6/10

    As a Tier 2 startup in the BestCRE database, Prophetic provides adequate but not exceptional support infrastructure. The company does not currently offer the dedicated, 24/7 global account management teams found at legacy data providers. Support is primarily handled through standard ticketing systems and scheduled check-ins during the onboarding phase. Because the software deals with highly technical zoning data, support requests often require escalation to data engineers rather than quick fixes from front-line representatives. Buyers should not expect immediate resolution for complex municipal data discrepancies. In practice: Expert and Enterprise plans add white-glove training, and Enterprise adds year-round support with in-platform live chat, but users must still factor in potential delays when reporting bugs related to specific local zoning interpretations.

    Innovation and Roadmap: 7/10

    Prophetic occupies a compelling position within the CRE technology landscape, targeting a workflow that has historically resisted automation. The company’s roadmap appears focused on expanding geographic coverage and refining the natural language processing models used to parse complex municipal ordinances. Future iterations will likely attempt to integrate more dynamic financial modeling, bridging the gap between physical feasibility and financial return metrics. The challenge for Prophetic will be maintaining the accuracy of its core zoning engine while scaling to new municipalities, each with its own unique legal quirks. In practice: Buyers are investing in a platform that will likely become significantly more powerful over the next 24 months as its municipal database expands.

    Market Reputation: 6/10

    Within the specific niche of land acquisition and development feasibility, Prophetic is building a reputation as a specialized, high-potential tool. However, as an unproven Tier 2 startup, it lacks the widespread industry recognition of general market data providers like CompStak or Cherre. Development principals are generally intrigued by the premise of automated zoning intelligence but remain highly skeptical of relying on algorithms for legal feasibility. The company is currently securing early adopters who are willing to tolerate occasional data gaps in exchange for a first-mover advantage in site selection. In practice: Prophetic is viewed as an experimental but highly promising addition to the tech stack, requiring an internal champion to drive adoption.

    Who should use Prophetic

    Prophetic is highly specialized and delivers the most value to teams actively engaged in ground-up development or significant value-add repositioning. The platform is best suited for organizations that spend excessive time and capital on early-stage site screening.

    Ground-Up Developers: Teams needing to quickly filter available parcels based on specific yield requirements and zoning constraints across multiple municipalities.

    Land Acquisition Managers: Professionals tasked with keeping a pipeline full of viable development sites who want to automate the initial reading of municipal codes.

    Urban Infill Specialists: Developers operating in dense markets where zoning overlays and floor area ratios dictate project viability, requiring rapid feasibility testing.

    Real Estate Private Equity (Development Funds): Analysts evaluating joint venture development opportunities who need an independent tool to verify a sponsor’s density assumptions.

    Who should look elsewhere

    Because the platform focuses entirely on physical feasibility and zoning, it offers little to no value for professionals managing stabilized assets or executing standard lease transactions. Organizations without an active development pipeline should avoid this tool.

    Property Managers: Teams focused on tenant relations, maintenance, and operations will find no applicable features within a zoning and land acquisition platform.

    Agency Leasing Brokers: Professionals marketing existing space to tenants do not require preliminary massing studies or municipal code extraction.

    Core-Plus Investors: Buyers acquiring stabilized, cash-flowing assets with no intention of redevelopment will not generate any return on investment from feasibility software.

    Pricing and ROI

    Prophetic utilizes a custom enterprise pricing model, and specific costs are not published publicly. Our research indicates that organizations must engage directly with the vendor to receive a quote, which is typically structured around the number of active user seats and the geographic footprint required. Because it is a Tier 2 platform targeting a highly specific workflow, buyers should expect pricing to reflect the specialized nature of the zoning data rather than a generic software-as-a-service subscription.

    Calculating the return on investment for Prophetic requires measuring the reduction in dead-deal costs. In traditional land acquisition, developers often spend thousands of dollars on preliminary architectural massing studies and zoning attorney retainers simply to determine if a site can support their target yield. At an illustrative cost of $15,000 to $25,000 annually for a small team, the platform only needs to prevent the underwriting of three to five unviable sites to pay for itself. Furthermore, the ROI is realized through pipeline velocity. If an acquisition analyst can screen fifty parcels in the time it previously took to research five, the probability of securing a highly profitable off-market site increases dramatically. The financial justification rests entirely on displacing early-stage consulting fees and accelerating the initial screening phase.

    Integration and CRE tech stack fit

    Prophetic occupies an isolated position within the standard commercial real estate technology stack. Because its primary function is early-stage feasibility and zoning research, it does not require deep, bidirectional data flows with general ledger systems like Yardi or MRI. It is a top-of-funnel application used before a deal becomes an active project in an enterprise resource planning environment.

    For most development teams, Prophetic will sit alongside market data platforms like CompStak or Cherre, but it will not natively communicate with them. The integration fit is primarily manual. Analysts will utilize Prophetic to determine the maximum buildable square footage and permitted uses for a parcel, and then manually input those physical constraints into their proprietary Excel underwriting models or specialized financial software like Argus Developer. While the lack of open APIs limits its utility for advanced data engineering teams looking to build centralized data lakes, this standalone nature is perfectly acceptable for the target audience. Land acquisition is inherently a research-heavy, fragmented process, and Prophetic serves as a specialized research terminal rather than a foundational database for the entire firm.

    Competitive landscape

    The competitive landscape for AI-powered underwriting and deal analysis is expanding, but Prophetic operates in a highly specific sub-category. While platforms like Cotality (BestCRE Score: 91) and HelloData (BestCRE Score: 91) excel at automating the extraction of data from offering memorandums, rent rolls, and operating statements, they are fundamentally designed for evaluating existing, cash-flowing assets. They do not compete directly with Prophetic’s focus on dirt, zoning codes, and physical feasibility.

    Prophetic’s true competitors are a mix of specialized urban planning software, localized GIS platforms, and traditional manual consulting. Platforms like Deepblocks or Giraffe offer similar capabilities regarding spatial analysis, preliminary massing, and zoning intelligence. When comparing Prophetic to these alternatives, buyers must evaluate the depth of the municipal data ingestion. Some competitors focus heavily on the 3D visualization of the massing study, while Prophetic leans heavily into the natural language processing of the underlying legal text.

    For general market data and demographic analysis during the acquisition phase, firms will still rely on established players. Cherre (BestCRE Score: 86) provides superior data connection infrastructure for aggregating disparate real estate feeds, while CompStak (BestCRE Score: 88) remains necessary for verifying the lease comparables that will eventually populate the development’s pro forma. Prophetic does not replace these tools; it operates earlier in the timeline. Buyers must decide if the specific friction of zoning research warrants a dedicated platform, or if their existing GIS tools and external zoning counsel are sufficient for their current pipeline volume.

    The bottom line

    Prophetic is a highly specialized, high-potential platform that directly addresses one of the most frustrating bottlenecks in commercial real estate development: municipal zoning research. It is not a general-purpose underwriting tool and offers zero utility for investors focused on stabilized assets. However, for ground-up developers and land acquisition teams, it provides a mathematical, scalable approach to site selection. The decision to purchase hinges entirely on your pipeline volume and geographic focus. If your firm evaluates hundreds of parcels annually across multiple jurisdictions with complex floor area ratio requirements, Prophetic will significantly reduce your reliance on early-stage consultants and accelerate your screening process. If you operate in a single, familiar market where your team already knows the zoning code by memory, the platform is an unnecessary expense. Commit to this software only if you are willing to train your analysts to trust AI-assisted feasibility and adjust your acquisition workflow accordingly.

    Frequently asked questions

    Does Prophetic replace the need for a zoning attorney?

    No. Prophetic is designed for early-stage screening and preliminary feasibility. While it accurately extracts numerical constraints from municipal codes, it cannot provide formal legal opinions. Developers must still engage zoning attorneys to verify interpretations and secure entitlements before closing on land.

    How does Prophetic price its software for development teams?

    Prophetic uses a custom enterprise pricing model and does not publish its rates publicly. Costs are typically determined by the number of user seats and the specific geographic markets required. Buyers must complete a sales demonstration to receive a formal price quote.

    Can Prophetic underwrite the financial cash flows of a development?

    No. Prophetic focuses strictly on physical feasibility, zoning constraints, and preliminary massing. It calculates what can legally be built on a site, but users must export those yield metrics into Excel or Argus to model construction costs, debt structures, and financial returns.

    What markets does Prophetic currently cover?

    Coverage depends heavily on the availability of digitized municipal data. While it targets major metropolitan statistical areas, buyers must verify coverage for their specific target submarkets during the evaluation process, as secondary markets with poor public records may have limited functionality.

    Does Prophetic integrate directly with Yardi or MRI?

    No. As an early-stage land acquisition tool, it operates independently of standard property management and accounting systems. Users typically export zoning summaries as static PDF files or manually transfer the buildable square footage calculations into their proprietary underwriting models for committee review.

    Is Prophetic suitable for evaluating stabilized, cash-flowing office buildings?

    No. The platform is engineered specifically for land acquisition, zoning intelligence, and ground-up development feasibility. Investors evaluating existing, stabilized assets should instead look toward platforms like Cotality or HelloData, which specialize in parsing rent rolls and historical operating statements.

    Related Reviews

    Compare Prophetic with other Underwriting & Deal Analysis tools BestCRE has scored: Crexi (78/100), DealWorthIt (72/100), redIQ (71/100) and Built AI (71/100). Browse every review in CRE Underwriting & Deal Analysis, the full Best CRE AI Tools directory, or the 20 CRE Sectors hub.

  • Pillar Review: Automated land acquisition workspace for modern real estate developers

    Pillar Review: Automated land acquisition workspace for modern real estate developers

    BestCRE 9AI Score

    73/100 · Contender

    Pillar ranks #50 of 584 commercial real estate AI tools scored on the 9AI Framework. Nine dimensions, each scored out of 10: CRE relevance, data quality, ease of adoption, output accuracy, integration fit, pricing transparency, support, innovation and market reputation.

    Pillar (pillar.codes) is an automated land acquisition platform for developers that combines nationwide parcel mapping, property intelligence, CRM features, and direct mail outreach into a single workspace. Classified in the BestCRE Master Database as a CRE-Native, Tier 2 application within the CRE Underwriting & Deal Analysis category, Pillar is designed specifically to accelerate site selection and due diligence for residential and commercial developers. The platform aggregates massive amounts of public data and allows users to query it using a natural language, paragraph-based interface, turning what is traditionally a fragmented, manual process into a centralized workflow. Led by CEO Dylan Goren, the company has recently gained traction among developers looking to identify off-market parcels and assemblages without relying on traditional broker networks or manual county record searches.

    Evaluating Pillar requires a skeptical look at its ability to deliver on the promise of automated site selection. While competitors like Cotality (BestCRE Score: 91) and HelloData (BestCRE Score: 91) have established themselves in the underwriting and data aggregation space, Pillar attempts to carve out a niche specifically focused on the very top of the development funnel: finding and acquiring dirt. Our analysis indicates that the platform’s core strength lies in its ability to quickly filter sub-markets using points of interest, zoning data, and demographic criteria, then immediately push those results into a Kanban-style project pipeline for direct mail outreach and skiptracing. However, as an unproven startup in a crowded proptech landscape, buyers must weigh its intuitive interface against the inherent risks of adopting early-stage software. As of August 2026, the tool presents a compelling vision for data-driven land acquisition, but requires careful validation of its underlying public data sources before committing capital to a subscription.

    What Pillar does and how it works

    Pillar operates as a comprehensive workspace for land acquisition, accessed entirely through a unified web interface that prevents constant page reloading. The core mechanic revolves around an interactive parcel map that serves as the primary analytical environment. Users begin by executing bulk searches using a paragraph-based query system, which allows non-technical analysts to define complex parameters, such as minimum acreage, distance from specific grocery stores, daily traffic counts, and median income, using plain language. The software then scans its aggregated public database to highlight parcels that match the exact criteria, effectively automating the initial site selection phase.

    Once target parcels are identified, Pillar moves the workflow from spatial analysis into active pipeline management. Users can save selected sites into custom lists and push them into a built-in Kanban-style project board. This CRM functionality tracks deals from initial lead through the closing process. Crucially, the platform includes integrated skiptracing capabilities, allowing acquisition teams to perform bulk owner contact lookups directly within the same interface. This eliminates the need to export parcel data to a third-party service just to find phone numbers or mailing addresses for off-market property owners.

    The final mechanical step in the Pillar workflow is direct outreach execution. The platform features a native direct mail campaign management tool, enabling users to design, order, and track letters sent to the owners of the identified parcels. By combining the interactive map, the Kanban pipeline, the skiptracing engine, and the direct mail sender into one continuous loop, Pillar attempts to replace the traditional tech stack of a land developer. Our analysis shows that this consolidation is the product’s defining mechanical advantage, allowing a single analyst to perform the work of a dedicated site selection team without leaving the browser window.

    9AI Framework: the score, dimension by dimension

    Dimension Score
    CRE Relevance 10/10
    Data Quality and Sources 6/10
    Ease of Adoption 9/10
    Output Accuracy 6/10
    Integration and Workflow Fit 7/10
    Pricing Transparency 8/10
    Support and Reliability 7/10
    Innovation and Roadmap 7/10
    Market Reputation 6/10
    Composite 9AI Score 73/100

    CRE Relevance: 10/10

    Pillar is unequivocally built for commercial real estate, specifically targeting the land acquisition and development sector. As a CRE-Native, Tier 2 application, it addresses a highly specific, notoriously inefficient phase of the real estate lifecycle: site selection and off-market deal sourcing. The platform’s features, including zoning data layers, parcel mapping, and bulk skiptracing, are entirely tailored to the daily realities of a development analyst or acquisitions manager. Unlike generic CRM or mapping tools that require extensive customization to understand property boundaries or ownership structures, this software understands the fundamental concepts of assemblages, parcels, and land use right out of the box. Our analysis confirms that its focus on the developer’s workflow makes it highly relevant to its target audience. In practice: Development teams can immediately begin filtering parcels by acreage and zoning without needing to configure custom data fields or build external integrations.

    Data Quality and Sources: 6/10

    The platform relies heavily on aggregating public county records, demographic information, and points of interest to fuel its mapping and search functions. While the breadth of data is extensive, covering nationwide parcels, the inherent nature of public real estate data means that accuracy can vary significantly by municipality. Pillar uses automated systems to parse and standardize this information, but analysts must remain aware that zoning changes, recent deed transfers, or lot splits may not instantly reflect in the system. Compared to Tier 1 data providers like CompStak (BestCRE Score: 88) which rely on proprietary, verified transaction data, Pillar’s reliance on public sources introduces a standard margin of error common to all public data aggregators. In practice: Analysts should use the platform to quickly identify potential sites, but must still perform manual verification with local municipalities during the formal due diligence period.

    Ease of Adoption: 9/10

    Adoption is one of the software’s strongest attributes, driven primarily by its paragraph-based query interface. Instead of forcing users to navigate complex dropdown menus or write SQL queries to filter parcels, the platform allows analysts to define criteria using natural language structures. The single-workspace design, where the map, lists, and Kanban boards are accessible from a single left-hand rail without page reloads, significantly reduces the learning curve. For a real estate firm transitioning from manual spreadsheet tracking and disparate county GIS portals, the user experience is highly intuitive. Training a new analyst to run bulk searches and initiate direct mail campaigns can likely be accomplished in a matter of hours rather than weeks. In practice: Non-technical acquisitions staff can successfully execute complex spatial queries and manage direct mail campaigns on their first day of using the software.

    Output Accuracy: 6/10

    When evaluating the accuracy of Pillar’s outputs, our analysis separates the spatial filtering from the skiptracing results. The geographic and demographic filtering performs reliably, accurately highlighting parcels that meet the specified distance and size criteria. However, the contact information generated by the bulk skiptracing feature is subject to the same decay rates seen in all public record databases. Phone numbers may be disconnected, and mailing addresses for LLC owners often point to registered agents rather than the actual decision-makers. While the platform excels at identifying the right piece of dirt, the accuracy of the contact data required to actually acquire that dirt will require human persistence to validate. In practice: Users should expect a standard bounce rate on direct mail campaigns and will need to cross-reference LLC ownership structures to reach the true principals of off-market parcels.

    Integration and Workflow Fit: 7/10

    Pillar aims to replace multiple tools by offering an all-in-one workspace for mapping, CRM, and direct mail. While this consolidation is efficient for boutique developers, it presents integration challenges for larger institutional players with established tech stacks. The software features an open architecture, but specific details regarding native API connections to enterprise ERP systems or heavy-duty CRMs like Salesforce are not published. For firms already utilizing platforms like Cherre (BestCRE Score: 86) for data warehousing, adopting a closed-loop system for acquisitions might create data silos between the development team and the rest of the organization. Our analysis suggests it functions best as a standalone tool for the acquisitions department rather than a fully integrated enterprise node. In practice: Mid-sized developers will likely use this as their primary acquisitions system, manually exporting successful deals into their main accounting or project management software.

    Pricing Transparency: 8/10

    The BestCRE Master Database confirms that Pillar operates on a Paid/Subscription model, but the vendor publishes a free plan, a Pro plan at $199 per user per month billed annually, and $0.10 per added credit, with Enterprise quoted separately on its public website. Only Enterprise buyers need to engage in a sales process simply to determine if the software fits their budget. For a tool that includes variable costs like direct mail credits and bulk skiptracing lookups, credit-based usage pricing, such as 3 credits per skip trace, adds some friction for analysts attempting to model the total cost of ownership. Following the BestCRE 9AI Framework guidelines, a vendor that publishes plan prices and credit rates can receive a strong score in this dimension. In practice: Buyers can start free and should confirm credit allowances against expected subscription costs, skiptracing fees, and direct mail credit pricing before committing to a pilot.

    Support and Reliability: 7/10

    As a relatively new entrant in the proptech space, Pillar is an unproven startup, which inherently limits its score for support reliability. While the platform offers tutorials, priority support and onboarding on the Pro plan, and 1:1 support with an SLA on Enterprise, it has a shorter operating record and less proven support depth than mature competitors. If the system experiences downtime or a bug in the direct mail ordering process, users are entirely dependent on a small startup team for resolution. The company has demonstrated recent growth and secured funding, but it has not yet established a multi-year track record of maintaining uptime during critical business hours for a large enterprise user base. In practice: Early adopters should maintain backup methods for accessing county GIS data in the event of unexpected platform outages or delayed support response times.

    Innovation and Roadmap: 7/10

    The development trajectory of Pillar shows a clear focus on automating the most tedious aspects of land acquisition. By incorporating AI-driven natural language queries and modular architecture, the company is applying natural language AI search to how developers interact with spatial data. Their roadmap appears centered on expanding the types of public data ingested and refining the user interface to make complex demographic and zoning analysis accessible to non-technical users. Compared to legacy GIS software that has remained stagnant for a decade, this platform is iterating rapidly. Our analysis indicates that the leadership team is highly attuned to the specific pain points of modern site selection and is deploying capital to solve them efficiently. In practice: Users can expect frequent feature updates and continuous improvements to the search interface as the startup refines its data aggregation models.

    Market Reputation: 6/10

    Pillar is currently building its reputation among residential and commercial developers, primarily driven by word-of-mouth and appearances on industry podcasts by its CEO, Dylan Goren. However, as an unproven startup, it does not yet possess the widespread market validation or institutional trust enjoyed by established data platforms like CompStak or Cherre. Early case studies suggest strong revenue growth and satisfied initial users who appreciate the time saved on manual site selection. Yet, the broader commercial real estate industry remains largely unaware of the tool. It is viewed as an intriguing, specialized utility rather than an industry-standard platform. According to our framework, its reputation score must remain capped until it achieves deeper market penetration. In practice: Buyers will find enthusiastic early adopters willing to provide references, but will struggle to find extensive third-party reviews or long-term institutional case studies.

    Who should use Pillar

    Pillar is highly specialized, making it an excellent fit for teams focused entirely on the top of the development funnel. The ideal buyers are those who spend excessive hours cross-referencing county GIS maps with demographic data and manually managing outreach.

    Residential Land Developers: Teams looking to identify off-market assemblages or single-family lot opportunities based on specific zoning and acreage requirements.

    Retail Site Selection Analysts: Professionals tasked with finding commercial parcels that meet strict demographic, traffic count, and distance-from-competitor metrics.

    Boutique Acquisitions Teams: Small to mid-sized firms that want to consolidate their mapping, CRM, and direct mail tools into a single, cost-effective workspace.

    Proptech-Forward Principals: Leaders willing to adopt early-stage software to gain a competitive advantage in sourcing off-market dirt before it hits the brokerage community.

    Who should look elsewhere

    Because the platform is built specifically for land acquisition and relies on public data, it is not suitable for every commercial real estate professional. Firms requiring deep financial modeling or enterprise-grade integrations should look elsewhere.

    Asset Managers: Professionals focused on the operational performance and leasing of existing buildings will find no value in a land acquisition tool.

    Institutional Core Investors: Funds that strictly acquire stabilized, Class A assets through institutional brokerages do not need off-market parcel mapping or skiptracing.

    Enterprise Firms Requiring Custom ERP Integration: Organizations that mandate strict API data flows into legacy systems like Yardi or MRI will find the standalone nature of this workspace limiting.

    Pricing and ROI

    Based on the BestCRE Master Database, Pillar operates on a Paid/Subscription model. The vendor publishes a free plan and a Pro plan at $199 per user per month billed annually, with Enterprise pricing on request. Only Enterprise buyers must engage directly with the sales team to obtain a custom quote. The published cost structure involves a base platform fee for access to the nationwide parcel map and CRM, coupled with variable, usage-based fees for bulk skiptracing lookups and direct mail credits. Published plan and credit pricing makes initial budget approvals straightforward for analysts.

    To evaluate the return on investment (ROI), buyers must calculate the labor hours currently spent on manual site selection. If an acquisitions analyst earning $100,000 annually spends 15 hours a week cross-referencing county GIS portals, pulling ownership records, and formatting direct mail spreadsheets, the hard cost of that labor is approximately $37,500 per year. If Pillar can compress that workflow into two hours a week, it effectively frees up $32,500 in labor capacity. Assuming the subscription and variable costs fall below $15,000 annually, the software delivers a clear, positive ROI simply through labor efficiency, before factoring in the potential profit from successfully acquiring an off-market development site ahead of competitors.

    Integration and CRE tech stack fit

    Pillar is designed to be a consolidated workspace, which inherently changes how it fits into a traditional commercial real estate tech stack. Rather than acting as a middleware data connector like Cherre (BestCRE Score: 86) or a specialized underwriting plug-in like HelloData (BestCRE Score: 91), it attempts to replace the top-of-funnel stack entirely. For many development firms, adopting this tool means abandoning disparate subscriptions to generic CRMs, standalone skiptracing services, and manual direct mail houses.

    However, our analysis indicates that its integration capabilities with downstream enterprise systems are not fully detailed. Once a parcel is successfully acquired, the project must transition into construction management and formal accounting. Because native integrations with industry-standard ERPs like Yardi, MRI, or Procore are not published, analysts should expect to manually export closed deal data or utilize custom API workarounds to push information out of the Kanban pipeline. Ultimately, it fits best as an isolated, high-speed engine for the acquisitions team, operating parallel to, rather than deeply integrated with, the firm’s core financial and property management software architecture.

    Competitive landscape

    The landscape for real estate data and site selection is highly competitive, forcing buyers to carefully compare Pillar against both established data giants and specialized AI tools. For pure data aggregation and property intelligence, CompStak (BestCRE Score: 88) and Cherre (BestCRE Score: 86) offer vastly superior enterprise data warehousing and verified transaction histories. However, neither provides the native direct mail or Kanban pipeline features that make Pillar a closed-loop acquisition tool.

    When looking at automated underwriting and market analysis, Cotality (BestCRE Score: 91) and HelloData (BestCRE Score: 91) are formidable peers. HelloData excels at extracting insights from existing property documents and automating valuations, which is highly valuable for acquiring existing assets, but less relevant for raw land assemblage. Akkio (BestCRE Score: 86) and RETS AI (BestCRE Score: 86) offer powerful predictive analytics and machine learning capabilities that can be applied to real estate, but they are general-purpose or broad CRE tools that require significant user configuration, whereas Pillar is strictly CRE-Native and ready out of the box for developers.

    The most direct alternatives are legacy GIS platforms like LandVision or specialized mapping tools like Regrid. While these competitors provide excellent parcel data, they often lack the intuitive, natural language query interface and built-in CRM functionality. Our analysis concludes that while competitors may offer deeper data or broader AI capabilities, Pillar has uniquely positioned itself by bundling mapping, skiptracing, and direct mail specifically for the off-market land developer.

    The bottom line

    Pillar is a highly effective, purpose-built tool for development teams that need to accelerate their land acquisition pipeline. If your firm’s current process involves manually scraping county GIS websites, exporting CSV files, and managing direct mail through disconnected third-party vendors, this software will immediately reduce your operational friction. The paragraph-based query interface is genuinely intuitive, allowing non-technical staff to perform complex spatial analysis. However, as a young startup with Enterprise pricing on request, it carries inherent adoption risks. Institutional investors requiring verified, proprietary transaction data or deep enterprise ERP integrations should pass. Conversely, for residential developers, retail site selectors, and boutique acquisition teams focused on finding off-market dirt, the efficiency gains in the initial site selection phase easily justify the investment. Buy it to automate your top-of-funnel outreach, but maintain rigorous manual due diligence before closing any deal.

    Frequently asked questions

    Does Pillar provide verified commercial real estate transaction comps?

    No. The platform focuses heavily on public parcel data, zoning restrictions, and demographic information to aid in site selection and land acquisition. For verified, proprietary transaction or lease comparables, analysts should utilize dedicated data providers like CompStak rather than relying on this software.

    Can I send direct mail to property owners directly through the platform?

    Yes. The software includes a native direct mail campaign management tool. Users can design letters, order them, and track their delivery to off-market property owners directly from the same workspace used to map the parcels and manage the CRM pipeline, eliminating third-party vendors.

    How does the software handle finding contact information for LLC-owned properties?

    The platform features built-in bulk skiptracing capabilities designed to look up owner contact information. However, our analysis notes that reaching the true decision-maker behind an LLC often requires manual persistence, as public records frequently point to registered agents or attorneys rather than principals.

    Is the pricing for the software based on a flat monthly fee or usage?

    Pricing is not published publicly on the vendor’s website. Based on standard industry practices for similar acquisition tools, buyers should expect a base subscription fee for general platform access, combined with variable, usage-based costs for executing bulk skiptracing lookups and sending direct mail campaigns. You must request a custom quote.

    Will this tool integrate directly with my enterprise accounting software like Yardi?

    Native integrations with legacy enterprise resource planning systems like Yardi or MRI are not explicitly detailed by the vendor. The platform is designed primarily as a standalone workspace for acquisitions, meaning users will likely need to manually export closed deal data to their accounting systems.

    Do I need to know how to write SQL code to filter parcel data?

    No. The software utilizes a paragraph-based query interface that allows users to filter parcels using simple natural language. This intuitive design enables non-technical real estate professionals to execute complex spatial searches, such as minimum acreage or traffic counts, without any prior coding or GIS knowledge.

    Related Reviews

    Compare Pillar with other Underwriting & Deal Analysis tools BestCRE has scored: Crexi (78/100), Enaia (73/100), Endex (73/100) and redIQ (71/100). Browse every review in CRE Underwriting & Deal Analysis, the full Best CRE AI Tools directory, or the 20 CRE Sectors hub.

PRIME 7.00%FED FUNDS 3.88%5-YR UST 4.64% ▲10-YR UST 4.86% ▲SOFR 30D 3.91%Updated Nov 10, 2026
Talk to a CRE Capital Advisor
Sizing a deal? | Curated capital network Tell Us About Your Deal (307) 439-0410